1 Introduction
The four reports that make up our suite of documents – this present work, in addition to the Capacity to Pay, Debt Capacity, and Efficiency Reports – have been produced according to world best practice with the intent of providing end-users with a comprehensive picture of Federation’s financial sustainability as it relates to a special rate variation (SRV). The reports have been co-authored by three of the most prominent local government scholars in the world – we have a combined output of well over 220 peerreviewed scholarly works that have been cited around 4,000 times by our peers. Furthermore, the aforementioned reports have been produced in a strictly independent manner and we have been provided with unhindered access to all Council records, many of which we have thoroughly interrogated. Moreover, in the four reports we have drawn on sophisticated world’s best empirical techniques which clearly provide the best foundation for good decision-making. We know that some might find parts of our work imposing, but this is unavoidable if we want reliable facts. The main audience for our work is the Independent Pricing and Regulatory Tribunal (IPART), the Councillors and the Council Executive. We have also produced a number of videos, public forums and supplementary resources for the community. Professor Drew also made himself personally available to all parties including at several public forums, stakeholder engagements (in person and via Zoom), through email and over the telephone.
We acknowledge the sterling efforts of staff and Councillors, over the last three years, in particular. Sophisticated work like data envelopment analysis and free disposability hull analysis leave no room for reasonable doubt about close-to-optimal conversion of inputs into outputs (efficiency) in a relative sense. Moreover, this Council body demonstrated the prudence to recognise that they were in a serious predicament and get the expert help that they needed. Many other councils are in a comparatively worse position and have yet to take these critical steps. The community may not always agree with everything that these decision-makers have done, but it would be reasonable to acknowledge that they have taken courageous and prudent action, and that the data makes clear that they are starting to turn the ship around. We encourage the community to acknowledge the efforts of recent years and work constructively with Council as they sincerely attempt to do better in the future. It is important to note that in our other work we have demonstrated beyond reasonable doubt that much of the problems at Federation go back decades and were exacerbated by bad decision-making with respect to amalgamation and its immediate aftermath (see, Drew et al., 2023).
Financial sustainability is best defined as the ability to meet the needs of the current residents without putting at risk the capacity of the next generation to meet their own needs (Drew and Dollery, 2020). Key to this definition is its focus on needs, not wants. Also important is the dictate to fully fund our own needs. This is not always occurring – for example, a good proportion of our roads have not been maintained adequately (nor have the table drains running alongside the roads) and this poses great risk not only to the integrity of the infrastructure, but also sustainability. When needs aren’t addressed in a timely matter, they become burdens for a future generation – what Drew (2021) refers to as implicit debts. They are every bit as bad as explicit debts with a bank, indeed likely worse 1 If the next generation is forced to completely rebuild roads because we did not perform timely maintenance, then they will struggle to generate enough funds to meet their own needs. This sets up a scenario for a grievous transgression of inter-generational equity. We can and must collectively do better.
1 If roads aren’t sealed in time, water leaks into the substrate and the whole structure can fail. When this happens, the cost is typically eight times larger than it would have been to have done timely re-seals. Therefore, implicit debts are often many times larger than they might first appear on paper.
When local governments fail to maintain sustainability, they create a morally indefensible burden for our children and grandchildren. They are also likely to become the subject for disagreeable interventions. One intervention is amalgamation, which the community at Federation knows from experience. Amalgamations result in disenfranchisement, transfer of debt, and often higher costs and taxes (Drew, 2021; McQuestin et al., 2021; Drew et al., 2021; Drew et al., 2023). We note that a three-way amalgamation had been proposed in the past. We also know that state governments have refused to rule out further amalgamations and that the Local Government Act (1993, NSW) still allows for same.
The other disagreeable intervention that has been common in the past is for the state government to place unsustainable councils into administration. Some people in the community have opined that this would be a preferable state to what they have now. We beg to differ. Administration involves the complete suspension of democratic voice, often for lengthy periods. For instance, Central Darling Shire was first placed into administration in December 2013, and still has not had democracy returned to them (see, Drew and Campbell, 2016 for a full account of how the process took place). Moreover, administrators have precisely the same tools available to them as do elected councillors and executive – they can reduce or defer spending, sell community assets, or increase fees and taxes (rates). It is notable that Central Coast which was put into administration in October 2020 has had IPART approve or extended significant special rate variations (2021-22, and 2022-23). Important community assets have also been sold, and the council continues to be run by an Administrator, which the audited financial statements reveal received $337,000 in fees and expenses for the 2023 financial year (more than twice what Federation’s Mayoral and entire councillor costs were for the same period).
There are two additional important differences between an administrator and an elected council. The first is that an administrator generally does not own property in the local government area. This means that when an administrator puts up fees, cuts back services, sells community assets, or increases taxes, he does not personally bear any of the costs of doing so. The second main difference is that an administrator is only answerable to the Local Government Minister that appointed him, not the community.
Furthermore, we have shown in our earlier work that the post-amalgamation administration period resulted in a number of decisions that continue to have important and deleterious effects on Federation’s finances.
For all these reasons we strongly suggest that the community would be far worse off than it currently is, if a decision were to be made in the future to place it into administration. We are not suggesting that a decision of this kind is imminent, merely responding to statements made by some in the community.
In our earlier work, and also in the accompanying Capacity to Pay Report, we detail the very large special rate variations that were proposed by the former Corowa and Urana shires just prior to amalgamation. State government legislation and administration resulted in these proposals being deferred. Deferring reasonable increases to taxation simply compounded the financial sustainability problem and has resulted in a more dire set of circumstances for current councillors and staff to deal with now. Figure 1 compares various special rate proposals prior to amalgamation with what actually happened, and it is notable that only in 2023/24 (after the first portion of the temporary SRV) does the actual rates extracted slightly exceed that which had been planned so many years before. Clearly, delaying the needed SRV’s first proposed in 2015 has seriously impacted financial sustainability at Federation. We remind readers of the four year rate freeze following amalgamation that was mandated by the then state government.

Further exacerbating problems are a number of economic shocks which have affected all local governments. Professor Drew outlines sector wide alarming changes to expenditure and financial sustainability attendant on additional COVID-19 costs, and inflation on his YouTube site based on audited financial statements (see, for example, https://www.youtube.com/watch?v=3C7DPQUcHpc or https://www.youtube.com/watch?v=CL989GPoW98 or https://www.youtube.com/watch?v=6T2bWQp2FVU ). Notably, as the data in these reports will show, Federation has been largely bucking the deleterious trends in the sector in NSW (which is a good thing).
Inflation is a particular concern and a cause of much confusion in the community, and also it seems, amongst some state and federal government decision-makers. There are a number of measures of inflation produced by the Australian Bureau of Statistics. The Consumer Price Index (CPI), by definition, measures the changes in a basket of household goods and services. It therefore has limited relevance to local government, although it might tangentially measure changes in capacity to pay of some residents 2 The Produce Price Index (PPI) is arguably more relevant to local government – it measures the change in prices for business. Even more informative is the PPI (roads) which is specific to the single largest cost of local government.
The local government cost index (LGCI) is supposed to measure the increases to costs faced by local governments which have been immense because inflation has thus far disproportionately affected energy and materials, and local government is obliged to make considerable use of these resources to fulfil its remit (the budget for fuel and oil in 2024/25 was some $900,000). The local government cost index is used to guide decisions around the IPART rate cap which is the maximum percentage that a council can increase its total tax take in a given year, in the absence of a special rate variation. Unfortunately, the LGCI does not measure cost pressures accurately – recent changes have improved matters a little, but it is still far from fit-for-purpose. As a result, the allowable tax increases have largely lagged actual cost pressures over many years according to Australian Bureau of Statistics data (Figure 2 below). This gap has been slowly
2 It is important to remember that people on welfare have their incomes adjusted to CPI twice per year. Employees, often have to wait for an Enterprise Bargaining agreement to be executed and may suffer a significant lag in trying to maintain real incomes.
Figure
compounding and explains some of the financial sustainability predicament faced by local governments across the state.
2: Rate Cap Compares to Various Measures of Inflation
2 Analysis
In the graphs below we compare the performance of Federation Council against peers who belong to the same OLG grouping according to the Guidelines. In truth, the best comparison is against Federation Council itself over time because different councils face quite disparate operating environments which make performance relatively easier or harder. Table 1 provides details of the peer group used for comparisons.
Bellingen Shire Council Cabonne Council CootamundraGundagai Regional Council
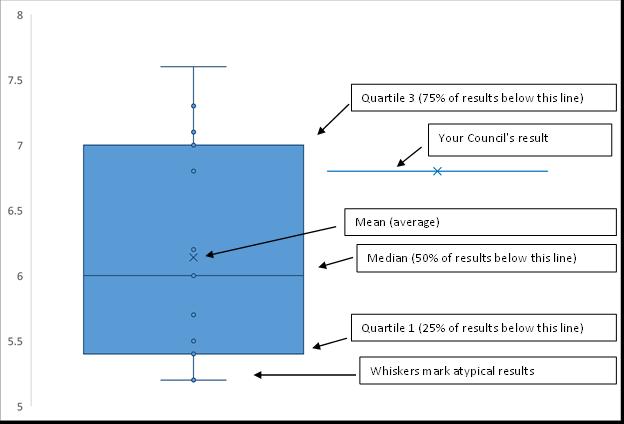
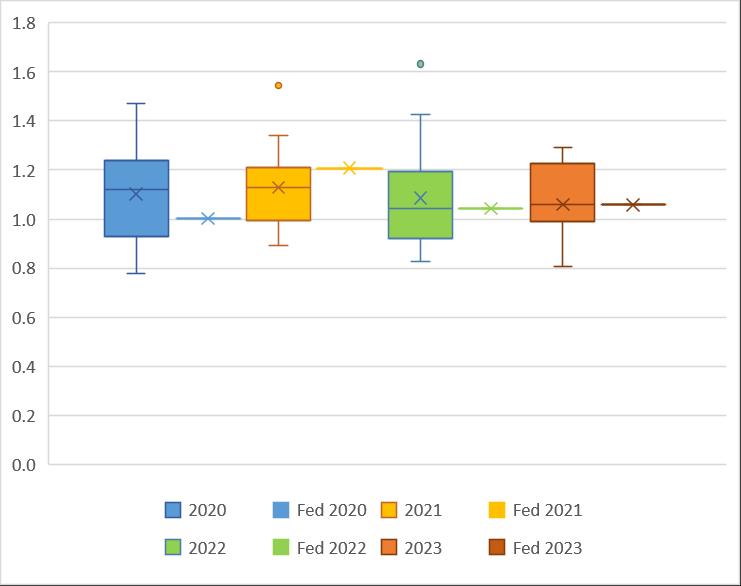
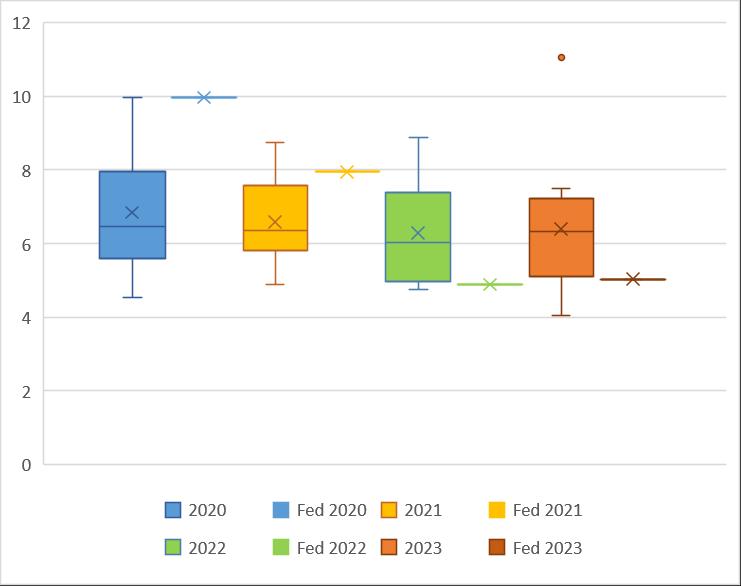
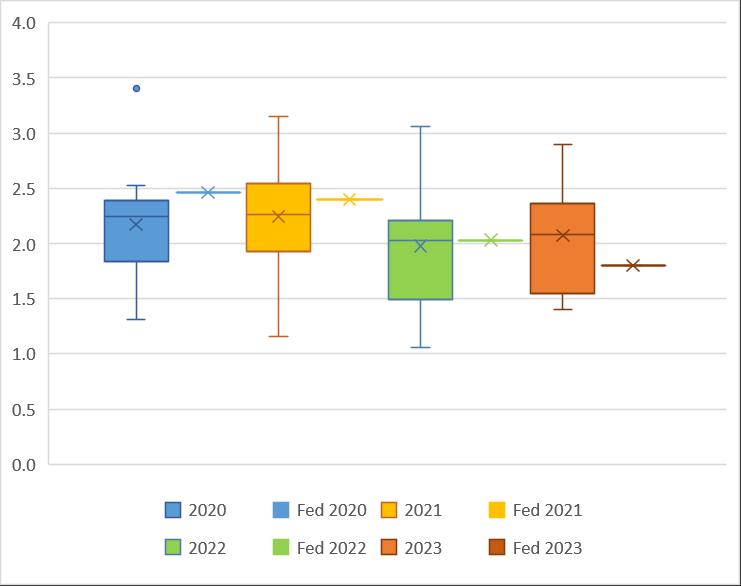
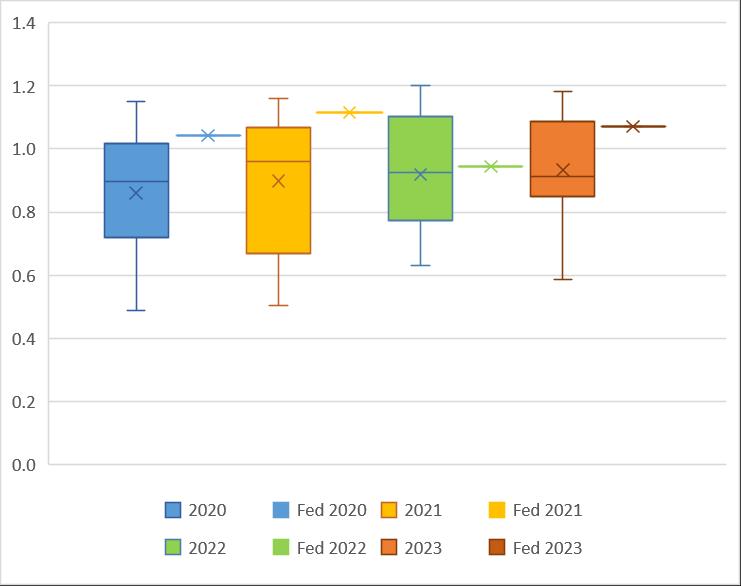
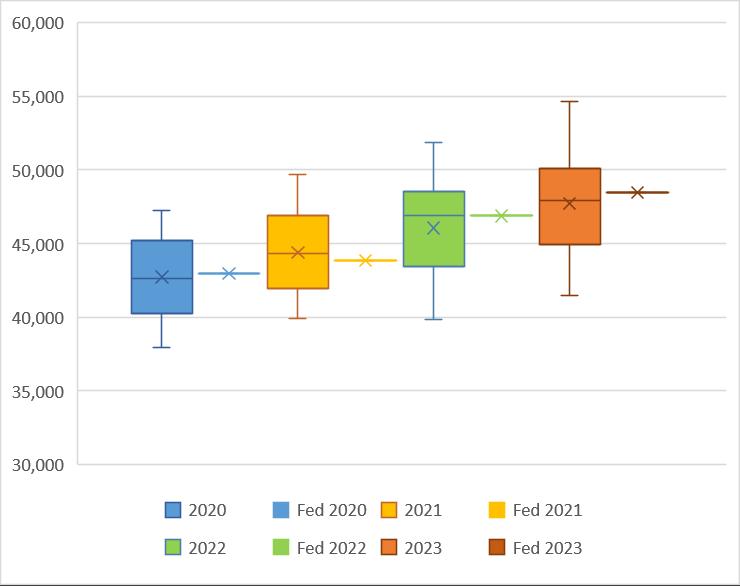
Comparative data is presented in box and whisker plots which are the best way to illustrate a particular council’s performance relative to its peer group. Figure 3 reminds readers how best to interpret such plots.
Table 1: Peers Used in Comparisons
Cowra Shire Council
Greater Hume Shire Council
Gunnedah Shire Council
Inverell Shire Council Leeton Shire Council
Moree Plains Shire Council
Murray River Council Nambucca Valley Council Parkes Shire Council
Snowy Valleys Council
Figure 3: Interpreting Box and Whisker Plots
We note that in our Capacity to Pay, Efficiency and Debt Capacity Reports our sophisticated econometric and data envelopment analyses compare Federation to all the rural councils in the state over much longer time horizons. The OLG and IPART seem to expect crude metric comparisons of the kind we present below, but generally it is much better to place emphasis on the more robust sophisticated work that can be found in the aforementioned reports.
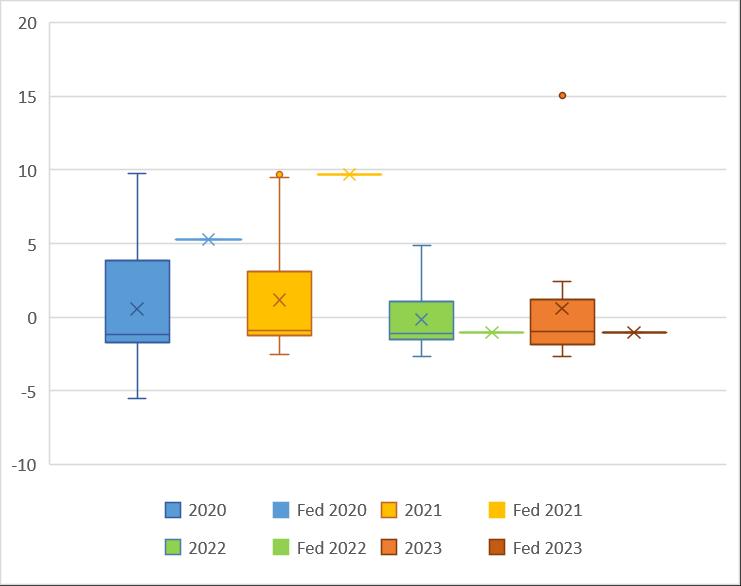
The operating performance ratio is arguably the most prominent of the metrics required for annual reporting in financial statements and to regulators. In simple terms it expresses the surplus or deficit (excluding capital grants) as a proportion of operating revenue. Ideally this ratio would sit at an average of break-even over the medium to long term to assure financial sustainability. As can be seen, the metric for Federation has been negative for the last four years (2022 was negative 0.03%), albeit improving from 2020 levels. Chronic negative operating performance results suggest that assets are unlikely to be replaced and maintained as required. In a relative sense Federation Council consistently performs worse than typical (with reference to the mean, or average) in all years and this is quite concerning given that the particular peer group includes some of the more fiscally distressed councils in the state. Clearly, there is an urgent need to increase revenues such that the general fund might be reasonably put in a position where it might be hoped to achieve a structural balance, as soon as possible.

A lot of focus has been placed on the Own Source ratio in recent years – particularly during the amalgamation debates. The truth of the matter is that many rural councils have limited opportunities to generate own source revenue. Moreover, the Local Government (Financial Assistance) Act (1995, CTH) clearly states a horizontal fiscal equalisation (HFE) objective and in this legislated context it is unreasonable to expect all councils in the state to achieve a single benchmark. Rural councils – especially those in low density or disadvantaged areas – ought to be receiving higher HFE allocations and thus shouldn’t be expected to meet benchmarks suitable for urban or affluent areas. Federation achieves well below the benchmark which is entirely reasonable for a low-density rural council.
Figure 4: Operating Performance Ratio

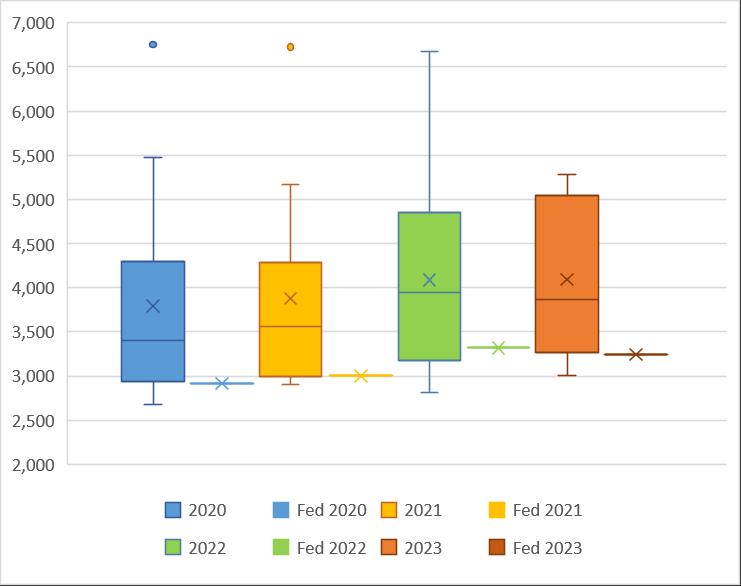
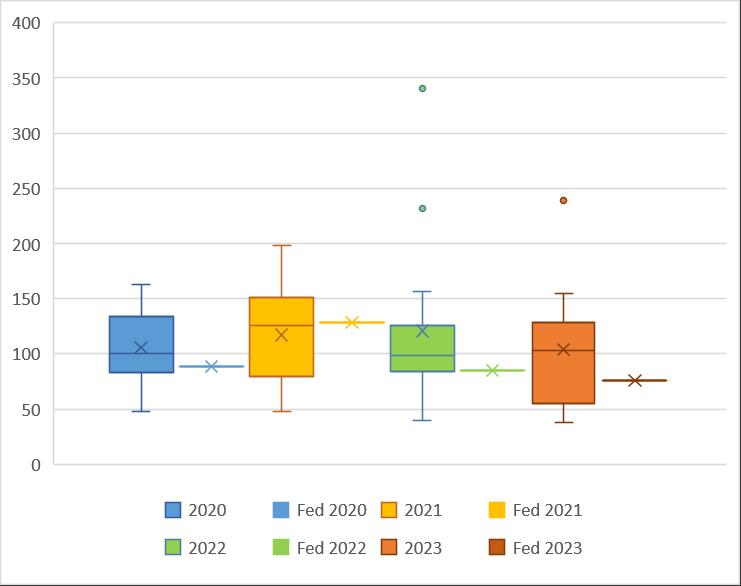
Indeed, the performance of the vast area contained by Federation Council (which astoundingly was created to be larger than some thirty-three nations in the world today) with respect to the own source ratio, is suggestive of a system of grants that has wholly failed to fulfil its legislated mandate of horizontal fiscal equalisation as articulated in s6(3)(a) of the Local Government (Financial Assistance) Grants Act 1995 (CTH). We have previously provided evidence of this in our 2023 report. In Figure 6 we show the relative FAG grant per person (excluding the road component) and compare this to the peer group. If we restrict our comparison to just peers which face similar environmental constraints allocations appear satisfactory –but if we consider that councils such as the affluent high density Bayside received almost as much in aggregate (some $4.3 million compared to Federation’s $5.49m) then it would be hard to argue that grants are indeed being allocated such as to ‘ensure that each local governing body in a State is able to function, by reasonable effort, at a standard not lower than the average standard of other local governing bodies in the state’ (the Act (1995, CTH), s6(3)(a)). If grant bodies refuse to allocate according to the intent of the legislation, then clearly ratepayers will be forced to pay more taxes (including through special rate variations).
Figure

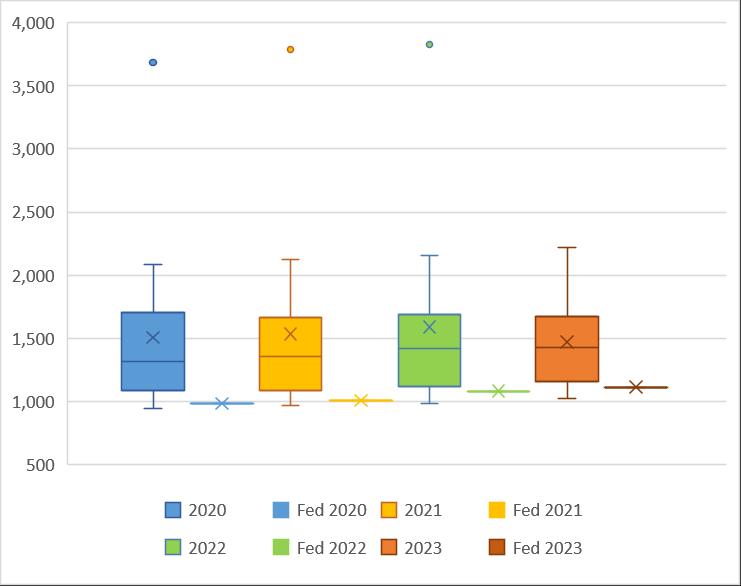
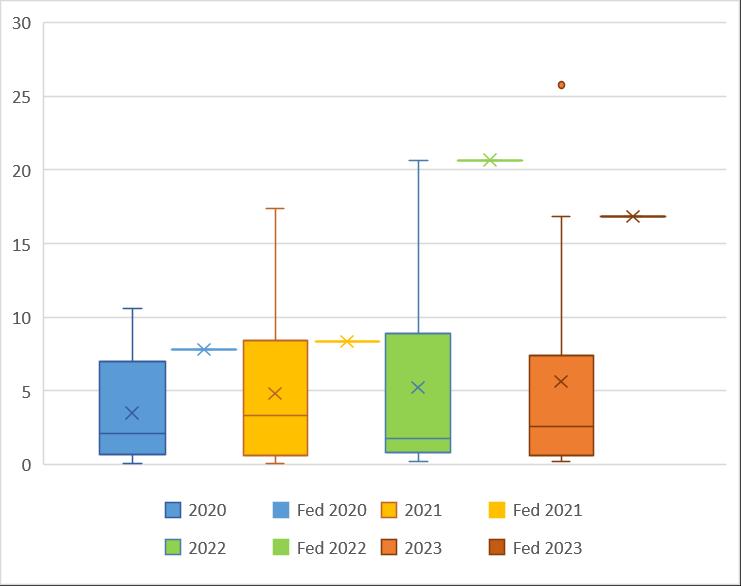
The matter seems even more perverse when one considers the road grant allocations on a per kilometre basis. In Figure 7 we show that Federation is clearly getting far less than a fair share, even when compared against other rural councils that the OLG deems to be similar (who are also missing out on the kind of allocation intended by the drafters of the Act (1995, CTH)). If we cast our net wider, we see that, once again, metropolitan councils are reaping a higher level of funds than could reasonably be expected given the stated HFE objective of the legislation. Indeed, to use the same Bayside example (which is by no means an isolated case), this affluent metropolitan council receives some $4,300 per km, whilst Federation receives just $1,380 per km. The allocations are particularly hard to understand when one considers the much higher burden placed on rural roads by heavy trucks and agricultural machinery. It bears repeating that if we are not going to allocate grants according to the HFE principles embodied in federal legislation, then it means that the ratepayers of Federation are going to have to pay considerably higher taxes than their city counterparts (hence, in part, this desperately needed special rate variation).
Figure 6: General Component of Financial Assistance Grant per Person
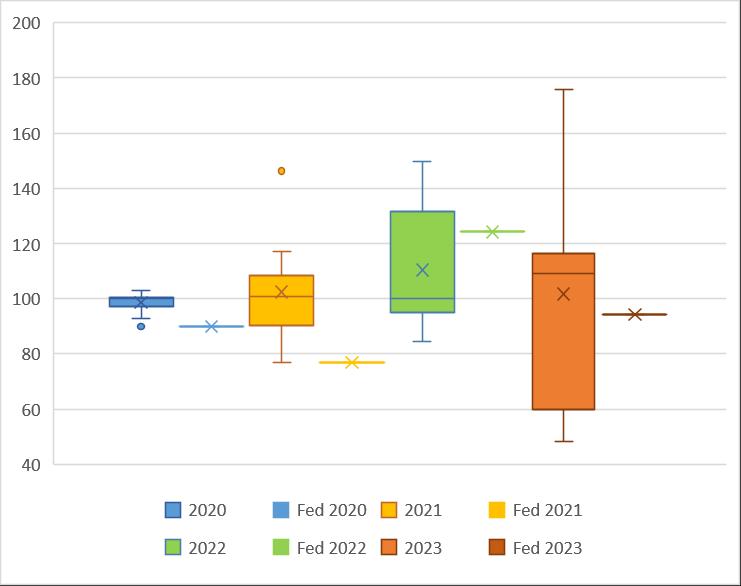
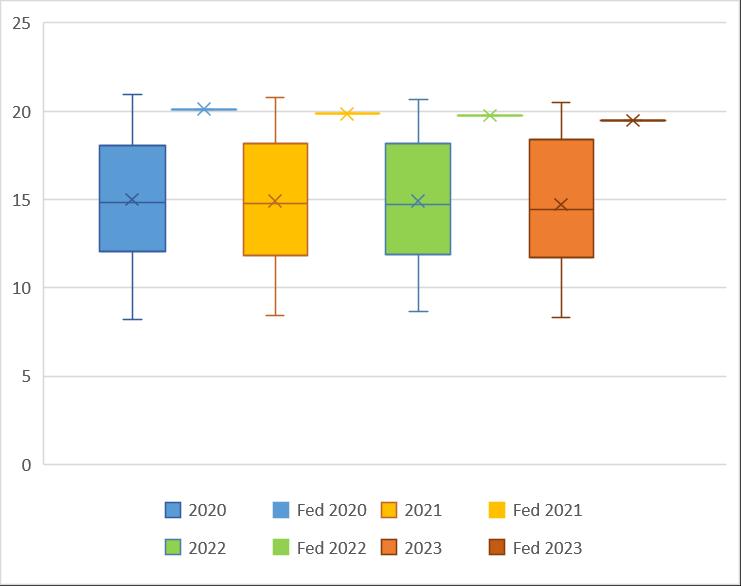
The inevitable outcome arising from lower than warranted grant transfers over many decades, combined with lower than typical rates, is a council facing a significant financial sustainability predicament (as shown in our 2023 reports). The unrestricted current ratio is one metric that points to the problem (ignoring the inappropriate benchmark). Federation Council remains stubbornly in the second quartile (below typical) in a relative sense, even when being compared to a cohort which is widely regarded as fiscally distressed. This is clearly not a sustainable situation.
Figure 7: Road Grant per Kilometre
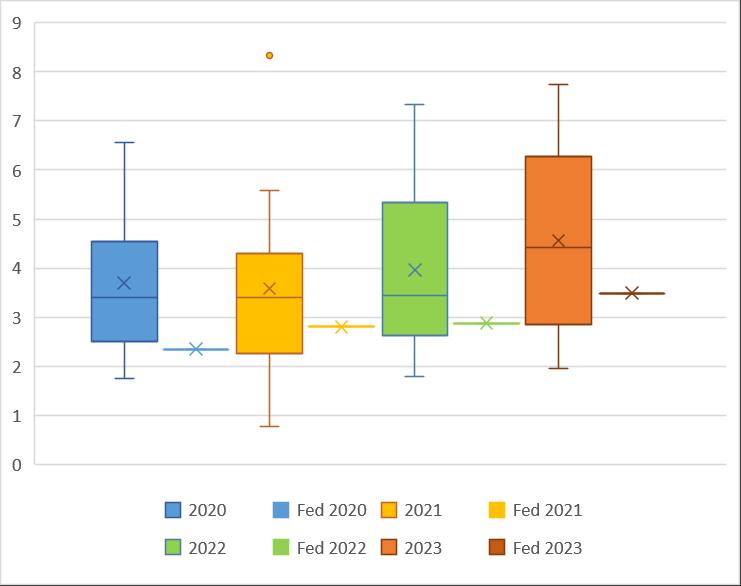
Figure 8: Unrestricted Current Ratio
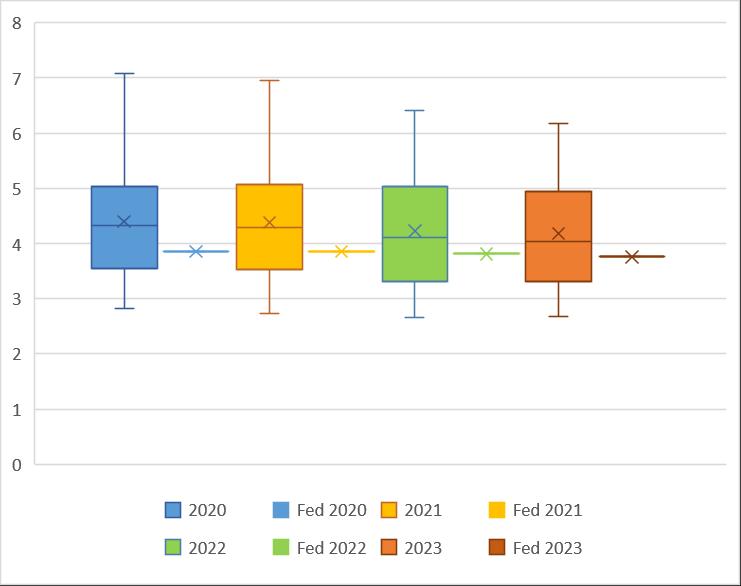
On the other hand, the Debt Service ratio seems to suggest that there is capacity for greater explicit debt to temporarily mitigate matters. However, as we show in our Debt Report this metric is badly flawed and it would be unwise to place much emphasis on it at all. Our sophisticated calculations that take in all liabilities (not merely a subset) over a long panel of time, demonstrate beyond reasonable doubt that Federation has already exceeded its liabilities capacity. If we were also to factor in the substantial implicit liabilities evident to anyone traversing Federation Council roads, then matters would seem to be very serious indeed. To this point a sub-sample was recently taken of roads in Federation Shire, and careful inspections made. What we found was that the cost to bring assets up to a satisfactory standard was some twenty percent higher than the accounting records suggested. There can be no certainty that the roads which weren’t inspected as part of this study would have had precisely the same characteristics but given that we used robust techniques to randomly select, extrapolation is not entirely unreasonable. If we were to do so based on the 2023 FY year statements, we would find that the cost to bring roads to a satisfactory standard might be just over nine million dollars more than the recorded 46.3 million dollars. We note that it is the usual state-of-affairs for there to be significant disparity between accounting records for roads and actual conditions. In our experience the disparity was less than what we would expect to find in most rural councils.

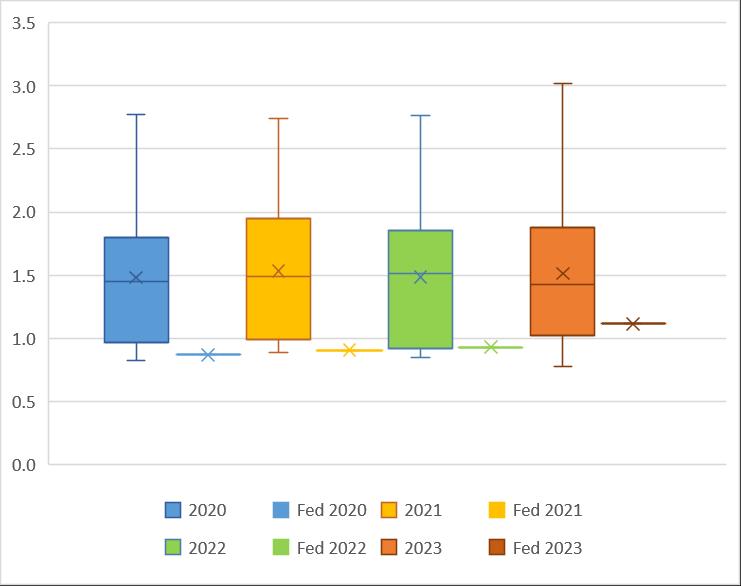
A slightly more reasonable metric on the matter of debt is the nett financial liabilities ratio used in most other states. This is still far from perfect because the ratio is restricted to single years and also neglects capacity to pay. However, it is interesting to note that the metric provides a starkly different picture to the official measure erroneously employed in NSW (Federation falls from the best quartile in Figure 9 to a position not far off the poorest performing quartile – note, the nett financial liabilities ratio works in a contrariwise direction – in Figure 10). Once again, readers are referred to our Debt Report for a proper consideration of debt capacity which uses robust, and hence reliable, methods.
Figure 9: Debt Service Ratio
Depreciation accruals have been a source of ongoing difficulties for all local governments in Australia (Drew and Grant, 2017). In our 2023 report we drew attention to apparent inconsistencies in practice. We are happy to see that accrual practice has attenuated a little in the last financial year and know that staff are working hard on getting a more accurate picture of the state of their assets. Given the size of Federation Council – which as we have said dwarfs many nations – it is unfortunately the case that it will take considerable time yet to build an accurate picture of matters. Implicit liabilities are a grave concern and underscore the urgency and gravity of this current special rate variation request. We take no comfort from the fact that practice is roughly typical for the peer group, because we don’t believe that most councils are indeed accounting for the consumption of long-life assets accurately.
Figure 10: Nett Financial Liabilities
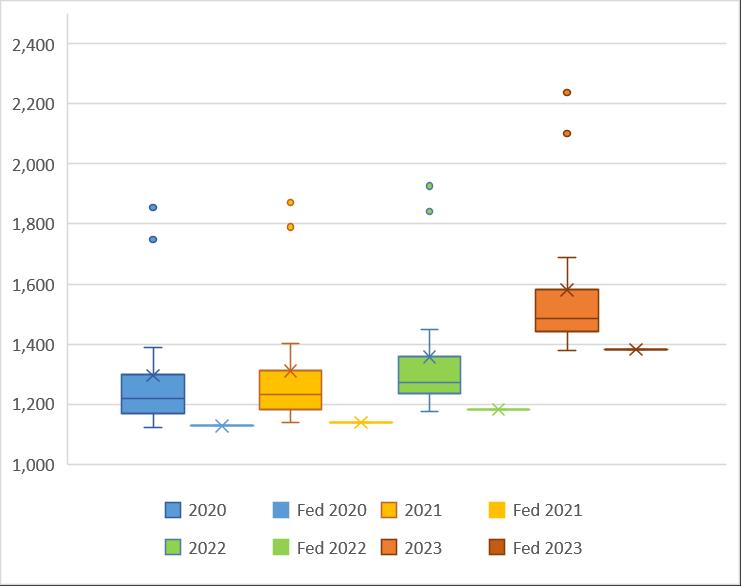
Figure 11: Total Depreciation of Infrastructure, Property, Plant and Equipment Deflated by Carrying Amount
Figure 12 is particularly interesting in a relative sense and might suggest future upwards revisions, or substantial losses on disposal for plant and equipment assets. This will place further burden on scarce resources at Federation Council.
Recent changes to the relative accruals for buildings also give some reason for concern. As we stated in our earlier report, the situation at Federation is so serious as to warrant the planned decline of non-essential buildings in the future. Federation simply does not have sufficient funds to maintain all of its infrastructure and preference must be given to roads – not only because of their importance to the local economy, but also because of the large potential for significant growth to implicit liabilities.
Figure 12: Depreciation of Plant and Equipment Deflated by Carrying Amount
Figure 13: Depreciation of Buildings Deflated by Carrying Amount
We are therefore heartened to see that Federation has resisted the practice of similar councils to reduce depreciation accruals to essential road infrastructure (indicated by the decline to typical depreciation for these assets). Unfortunately, a common response to fiscal stress is to reduce the transparency around the consumption of road assets, and also reduce maintenance. Federation have been both prudent and courageous in not following this practice – indeed, they have committed to increasing seals and drain clearing which is essential to long-term financial sustainability (and the containment of implicit liabilities). However, this comes at a cost, and the continuance of prudent improved stewardship will be highly contingent on the approval of a large special rate variation.

In Figure 15 we show that Council is accounting for the consumption of drainage assets in a relatively robust way. Caution needs to be exercised when interpreting this particular figure as it is well known that many rural councils struggle to correctly account for these kinds of assets.
Figure 14: Depreciation of Roads, Bridges and Footpaths Deflated by Carrying Amount
Figure 15: Depreciation of Stormwater Drainage Deflated by Carrying Amount
The nexus ratio is designed to measure how much of operational expenditure is covered by rates, fees and charges. Quite simply, if people are not paying the full costs for the non-public goods and services that they consume, then this is ultimately subsidised by others. Drew, Miyazaki and Ferreira (2023) strongly urged council in earlier reports to set fees and charges at long run marginal cost starting with the big ticket items and working down the list (and thence reviewing each on a four year cycle). This task is absolutely imperative to sending clear price signals essential for optimal efficiency and improved sustainability. We note that some fees have already been increased substantially – such as the cemetery fees – and look forward to more being done on this over the next few years. Setting appropriate fees is not about merely getting additional income – it is about ensuring that people consume only what they are willing to pay the price for. It is also an important moral matter. If people do not pay the full price for what they consume then we are either forcing the wider body of ratepayers to pay for someone else’s consumption, or worse still, we are asking our children and grandchildren to pick up the tab. People in the community seeking to decry increases to fees should pose themselves the question – ‘why should others pay?’ When we go to a supermarket, we don’t expect other Australians or our grandchildren to subsidise the price of our food. Why should non-public local government goods be any different?

There is a lot of confusion in the community regarding capacity to pay and how rates levels differ to those in similar councils. Most of this confusion has occurred because of the mathematically flawed suggestion by the OLG that councils might compare average rates. As Year 7 mathematics curriculum around the state identify the average is an inappropriate measure of central tendency when data is skewed. Data in rural councils is generally skewed significantly both within categories and between categories. To compare the skewed averages of Federation to other ‘similar’ councils can only result in nonsense. This is a fundamental mathematical fact.
Moreover, rates are paid out of incomes (not statistical calculations), and these differ substantially between councils. It would be absurd to try to assert that a community such as Nambucca (median wage $41,469 according to the ABS, 2023), has the capacity to pay the same rates as Federation (median wage
Figure 16: Nexus
$48,461) or Gunnedah (median wage $54,625). But this is what one implicitly asserts if one starts comparing average rates as a benchmark for capacity to pay.
Matters are even more stark if one considers farm rates. Quite contrary to the picture painted by illadvised comparisons of average farm rates, the revenue effort for farmers in Federation is actually the lowest in the entire peer group according to ABARES data (see the Capacity to Pay Report).
Indeed, a sensible robust measure of capacity to pay reveals that ratepayers in Federation would need to pay an additional thirty-nine percent in nominal terms, just to reach the average revenue effort extracted by all other rural councils (again, see the Capacity to Pay Report).
It is very unfortunate that deeply flawed metrics are suggested by the OLG because they clearly contributed strongly to the spread of avoidable confusion and misapprehension.
Nevertheless, we present average data in Figures 17 to 21 because this is apparently expected. However, we strongly urge end-users to entirely ignore these data that are logically flawed and instead refer to the robust empirical evidence in the aforementioned Capacity to Pay Report.
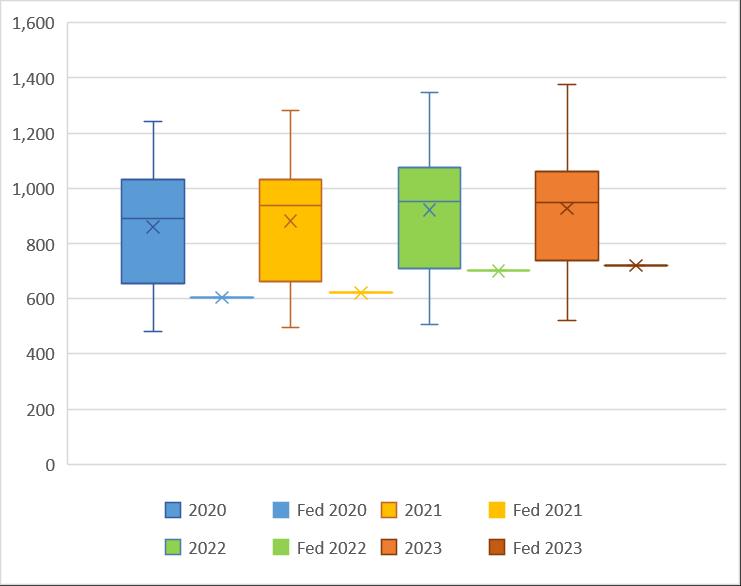
Figure 17: Rates, Fees and Annual Charges per Assessment ($)
Figure 18: Total Rates per Property Assessment ($)
Figure 19: Residential Rates per Assessment ($)
Figure 20: Farm Rates per Assessment ($)
Figure 21: Business Rates per Assessment ($)
In Figure 22 we plot the rates and charges outstanding at Federation relative to the rest of the peer group. Federation performs at the average, and it might be noted that the interquartile range (length of the box and hence ‘common’ outcomes) is very large. Outstanding rates and charges determinants include capacity to pay but also the effectiveness of council’s recovery efforts, local natural disasters, fluctuations to commodity prices, weather events and local economic shocks. The data in Figure 22 provides no good reason to believe that the community, on-the-whole, is unable to pay appropriate levels of taxation and fees.

In our earlier reports we commented on the large budget misses and the scholarly research that suggests this will result in lower efficiency. We are therefore pleased that budget accuracy has been mitigated a little in the most recent year but look forward to further improvements in the next set of financial statements. We know from interactions with key staff and Councillors that much stricter control has been implemented and expect matters to improve substantially in the future. It might be noted that the deviation to the budget revenue reflects under-estimate of income and hence is favourable for the community. It should also be noted that most of the deviation related to grants which are somewhat outside of Council’s control.
Figure 22: Rates and Charges Outstanding

Our earlier points about pleasing progress in fiscal discipline are exemplified by Figure 24. In successive years now, Federation has come well under budgeted expenditure – more so than any other member of the peer group. We have observed a real cultural change in Council and senior staff – there is a palpable atmosphere of striving to contain costs, and we see matters further improving in future years. Our sophisticated analysis in the Efficiency Report shows that council is very close to the efficient frontier and current efforts are likely to see Federation shift to be the most efficient converter of inputs into outputs in the entire cohort of NSW rural councils in the next year or so. We are in no way suggesting that things can’t be better – indeed in our earlier work we put forward a large number of recommendations – but do state plainly that the community needs to be more realistic about the relative size of efficiencies that might be reaped in the future. Future efficiencies will help at the margin, but they will be no substitute for paying appropriate levels of taxation and fees.

In our earlier work we also exposed the fallacy that a few people laboured under regarding the staffing at Federation Council. As Figure 25 clearly demonstrates, Federation is firmly in the lowest quartile when it comes to unit staff costs. We refer end-users to our earlier work that also showed that the costs of the leadership team were typical of the peer-group, contrary to some opinions offered by others (sans facts).
Figure 24: Deviation from Budgeted Expenditure
Figure 25: Staff Expenditure per Assessment
As Figure 26 illustrates, the proportion of expenditure on staff has risen in recent years as Council cuts back on contracts and other costs following the post-amalgamation administration period. This should not be interpreted as a bad thing – it is, in fact, a prudent adjustment of the factors of production that we demonstrate in our Efficiency Report to have resulted in important improvements to the conversion of inputs into outputs.

Far too little attention is given to cash flows – especially in councils with recurrent deficits and relatively low levels of unrestricted cash. In Figure 27 we present the operating cash flows which mainly reflect receipts of rates, charges and grants, less the costs of staff, materials, and services. Things have clearly improved since the worrisome results recorded in 2020 and 2021, both in an absolute and relative sense. They will need to continue to improve further to avert a worsening of the financial sustainability predicament currently faced. A large permanent special rate variation is critical to the continued improvement of this area of the cashflow statement. We remind end-users of the report that the peer group contains a number of councils widely considered to be fiscally distressed.
Figure 26: Proportion of Expenditure on Staff
Investing cash flows are made up of redemption of term deposits, and sales of assets less payments for acquisition of term deposits as well as expenditure on infrastructure, property, plant and equipment (IPPE). As we have already noted in this report and our 2023 work, Federation has been serially underinvesting in infrastructure (especially roads) over many decades. Council and staff have committed to redressing this over time in line with the Strategic Asset Management Plan. Their capacity to do so – and hence mitigate significant intergenerational inequity and local economic risk – is entirely dependent on the approval of a large permanent special rate variation (SRV). Without this, the council will have almost no chance of making progress on its sustainability journey and future generations will be unfairly burdened with paying for what we ought to have funded.
Investing cash flows ought to be negative and a council with the kind of backlog that Federation has, should be even more negative. The progress in the recent years is commendable but more will need to be done if we are to avert failure of core road assets in the future.
Figure 27: Operating Cash Flows (deflated by revenue)
Figure 28: Investing Cash Flows (deflated by revenue)
Financing cash flows are mostly made up of proceeds from borrowing, less repayments. In our Debt Report we present compelling sophisticated empirical evidence that Federation Council is already exceeding its comfortable level of liabilities. We would therefore wish to see these results become more negative in the future (like they have been in the last two financial years). However, we know that council drew down additional debt for essential works in the most recent financial year and this underlines the importance of receiving a large permanent special rate variation as a matter of urgency.
29: Financing Cash Flows (Deflated by Revenue)
It has long been known that asset data contained in the financial statements is unreliable at best (Drew and Grant, 2017). Federation is taking steps to make their data much more reliable, however, not all other councils are acting similarly. For this reason, much caution must be taken when viewing the following three metrics.
The Buildings and Infrastructure Renewal ratio purports to measure the quantum of asset renewals as a proportion of long-lived asset consumption. The benchmark is set at greater than one hundred percent. It is clear that Federation is not spending anywhere near enough to replace assets as they are consumed, according to this metric. In relative terms we are led to believe that this is an atypical result, but we suspect that an audit of the data at other councils would change this conclusion.
Figure
The infrastructure Backlog ratio purports to measure the gap between the cost to bring assets to a satisfactory standard, relative to the value of existing assets. The benchmark is set at less than two percent.
According to Figure 31, Federation Council has the worse relative outcomes in the peer group for the last two years. We believe that, in actual fact, the result partly reflects a more realistic appraisal of matters by staff at Federation Council in recent times. Notably the backlog has reduced in the most recent year, but considerable additional funds will be required if the community wishes matters to be redressed further. A permanent SRV is thus essential if we are to move further towards the mandated benchmark and assure the integrity of our assets and equity for the next generation of Federation ratepayers.
Figure
The Asset Maintenance ratio purports to measure the gap between actual asset maintenance and required asset maintenance. Because ‘required maintenance’ is ill-defined we harbour significant doubts about this data. Driving around Federation Council it is clear that considerable work needs to be done re-sealing roads and cleaning out table drains. This is also reflected in the Strategic Asset Management plans. We note that all Special Schedule 7 ratio data, for all councils, is unaudited. For all these reasons we suspect that it might be better to ignore Figure 32 entirely.
Figure 31: Infrastructure Backlog Ratio
Figure 32: Asset Maintenance Ratio
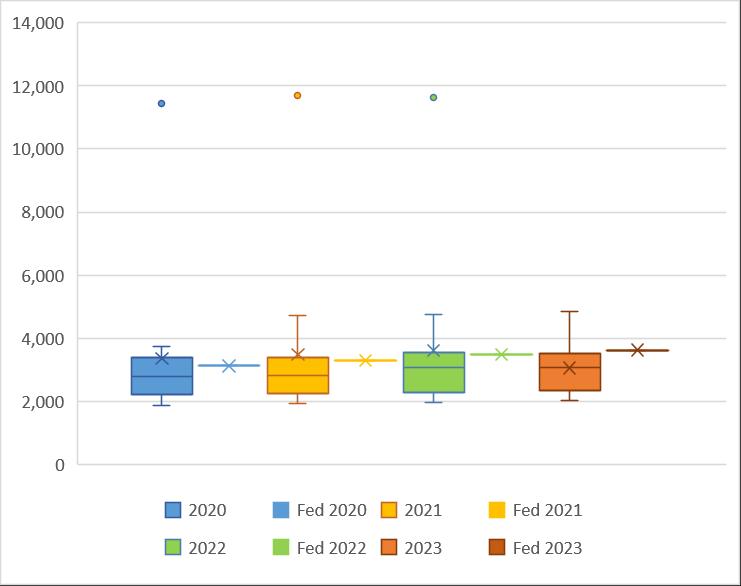
What can’t be ignored is the perilous levels of cash held by Federation and many other rural local governments. Figure 33 illustrates total cash levels, but this is quite deceptive owing to various restrictions on the money.
Figure 33: Total Cash, Cash Equivalents and Investments ($000)

In Figure 34 we see a truer picture of the unrestricted cash position. A general rule of thumb is that a council ought to have two to three months of cash expenditure set aside as unrestricted money. In 2023 this would have been some $7.6 million. Instead, unrestricted cash for financial year 2023 was just $2.471 million. Moreover, even with a large SRV planned unrestricted cash will not reach acceptable levels according to various drafts of the long-term financial plan (LTFP). If a large permanent SRV is not approved, then council will almost certainly face crisis in the next few years. In this scenario, decision-makers will likely have to abandon current prudent plans to start redressing the ballooning implicit liability problem, and roads will consequentially deteriorate further bringing forward catastrophic failure. The cost to repair this will be around eight times or more than what timely maintenance would have required. We cannot see how any Council could recover from such a position without substantial support from the state government. Council is showing great prudence and courage to commit to a recovery strategy, and we urge the community and regulators to respond appropriately to the proposal before them.

Externally restricted cash cannot be used to fund ordinary operating expenses. Levels have been increasing for all Councils in recent years, reflecting Stronger Communities Funding, and then the COVID inspired grants. The problem is that this level of heightened grants is extremely unlikely to be maintained into the future as state governments start to confront their own budget emergencies. Councillors, community, and staff have all become accustomed to a historically high levels of grant flows since 2016 and may well get a shock when things return to more normal levels in the near future. This likely future changes to grant flows also further underscores the importance of the proposed SRV.
Figure 34: Total Unrestricted Cash, Cash Equivalents and Investments ($000)
Figure 35: Total Externally Restricted Cash, Cash Equivalents and Investments ($000)
Internally restricted cash is money put away for really important known future expenses such as employee entitlements, waste restoration and the like. Prudent councils, like Federation, also internally restrict prepaid financial assistance grants because there will inevitably come a time in the future when they are no longer prepaid to such a surprising forward duration. Federation has been increasing its internal reserves in recent years – reflective of both grant prepayments and prudent stewardship. However, more will need to be done to become sustainable – especially around remediation works. Ideally, sufficient money would have been put aside decades ago, and it has now fallen to the current Councillors and staff to mitigate matters. In relative terms Federation looks like they have a high level of internal reserves, but this is entirely an artefact of the peer group having alarmingly low levels.
Figure 36: Total Internally Restricted Cash, Cash Equivalents and Investments ($000)
We now turn our attention to some income and expenditure data, which taken together provide part of the explanation for the cash position.
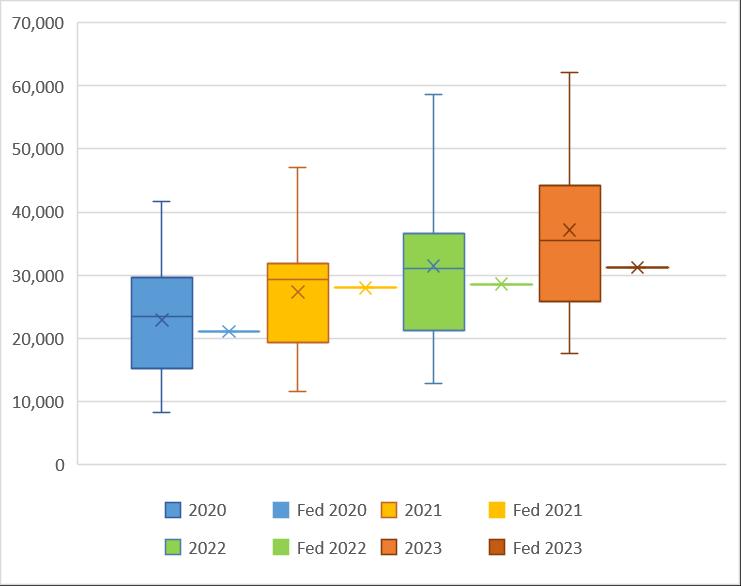
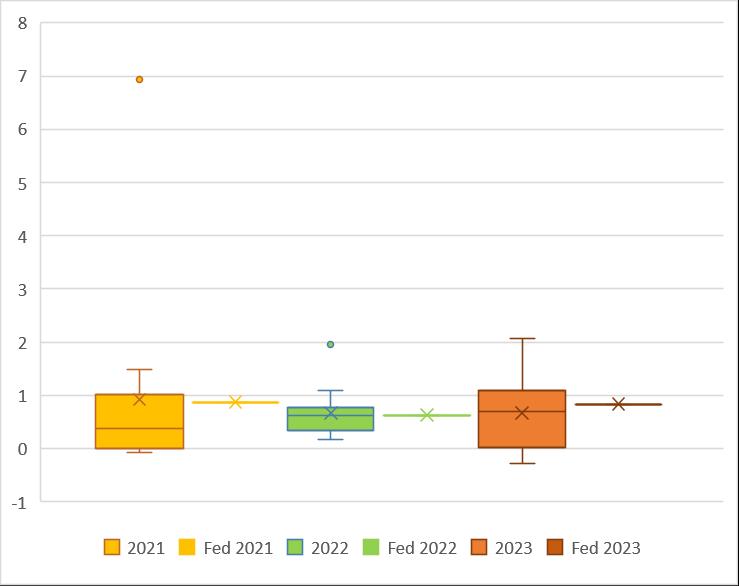
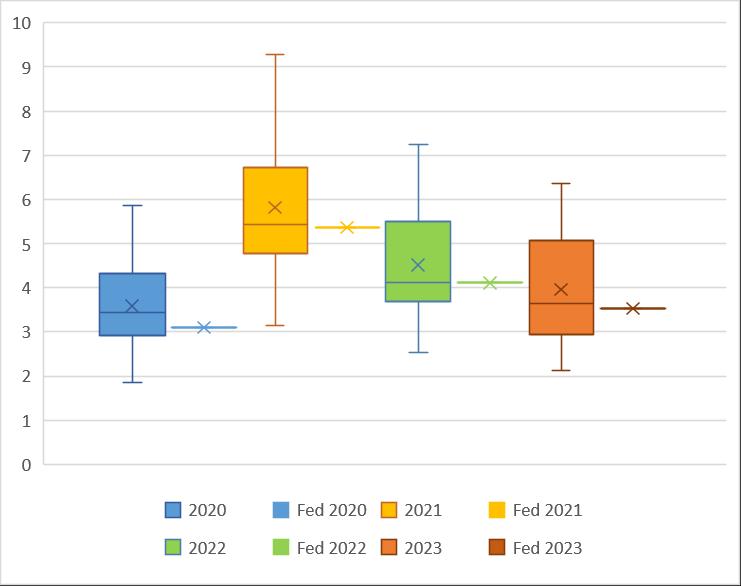
Total income on a per assessment basis for Federation has clearly lagged the peer group typical result over the last four years. Indeed, in 2021 it declined. Moreover, these are not inflation-adjusted numbers, thus the real outcomes are even more alarming.
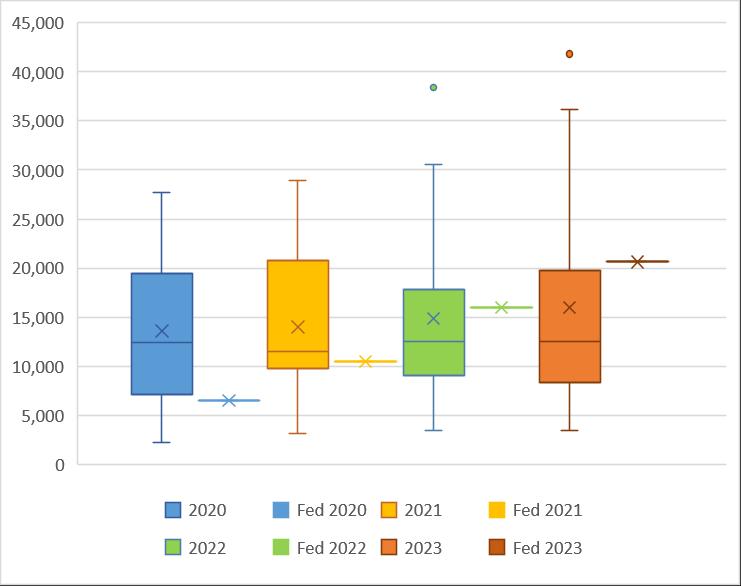
Notably total expenditure on a per assessment basis has been growing at a robust rate for the peer group, as it has for the entire state. Federation council has clearly bucked this trend through careful cost containment. It is beyond dispute that matters would be far worse than they already are had Federation not defied the trends in the sector.
Figure 37: Total Income per Assessment ($000)
Figure 38: Total Expenditure per Assessment ($000)
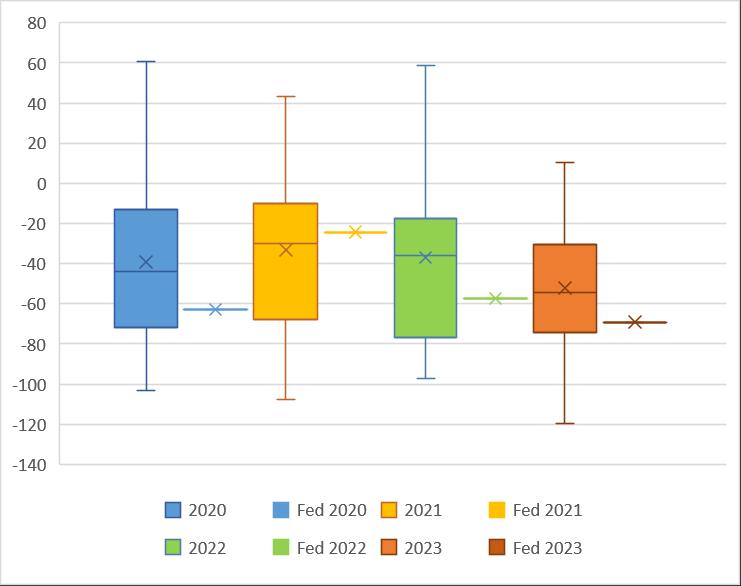
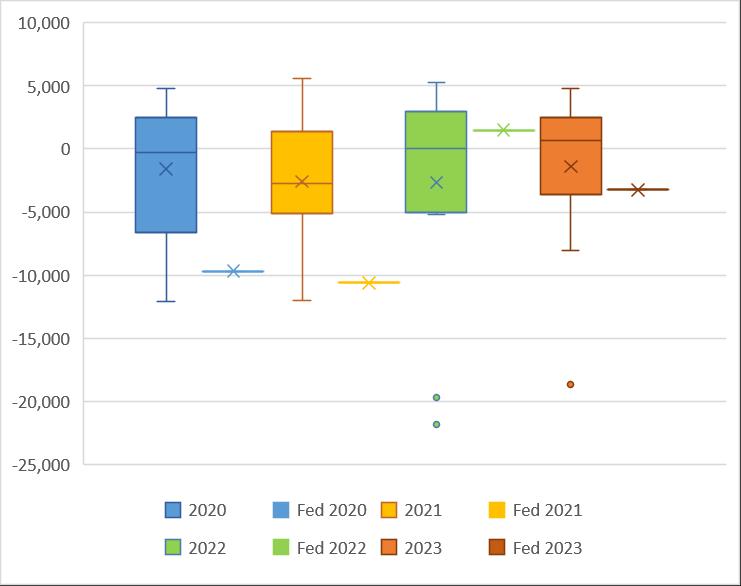
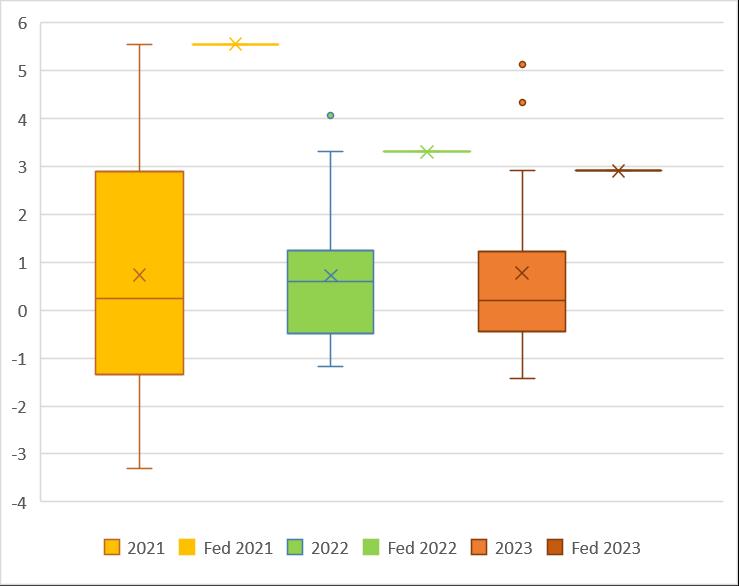
Figure 39 illustrates the nett operating result (inclusive of capital grants money). Operating result is total income less total expenditure. Even including capital grants – which can’t be used for general purposes –the nett operating result was negative before 2022. Since then, Council has taken decisive action to try to mitigate matters (albeit helped by the prepayment of FAG grants, in an absolute sense).

However, as Figure 40 attests this action is unlikely to be sufficient to return to a structurally balanced budget in an ongoing sense (especially the case when prepaid FAG grants are considered). Clearly, to be financially sustainable requires balanced budgets – to reverse decades of underinvestment will require even more work. Without a substantial permanent SRV, it is hard to see how Federation could attain any semblance of financial sustainability. There are two levers – reduce spending and increase revenues – and both will be required to achieve the kind of results necessary to assure the community and future generations regarding council’s capacity to meet their needs. A SRV is clearly an essential part of the picture – especially if grants continue to be allocated in a manner at odds with horizontal fiscal equalisation principles.
Figure 39: Nett Operating Result ($000)
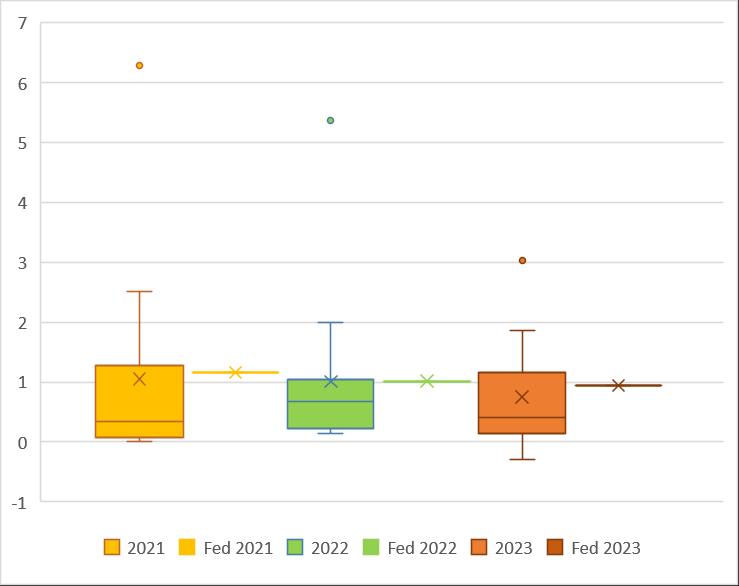
Some people believe that growth might improve financial sustainability. In recent sophisticated empirical work Drew, Miyazaki and Kortt (2023) and Drew, Miyazaki and McQuestin (2024) have shown that this widespread assumption is almost certainly in error. Nevertheless, in Figures 41-44 we illustrate data that shows little growth is indeed occurring, in any case.
Figure 41: Growth in Number of Assessments (%)
Figure 40: Nett Operating Result Without Capital Grants ($000)
Population growth has also been muted, notwithstanding the fact that data for intercensal years is likely to be affected by errors of up to nine percent at the SA2 statistical level, according to the ABS. Because rates are levied on property (irrespective of how many people live in it), and most charges are access rather than consumption (for example sewerage or domestic waste), population growth isn’t a nett positive for financial sustainability in any event (see the aforementioned papers by Drew et al., 2023, 2024).
Figure 42: Growth in Number of Residential Assessments (%)
Figure 43: Growth in Number of Business Assessments (%)
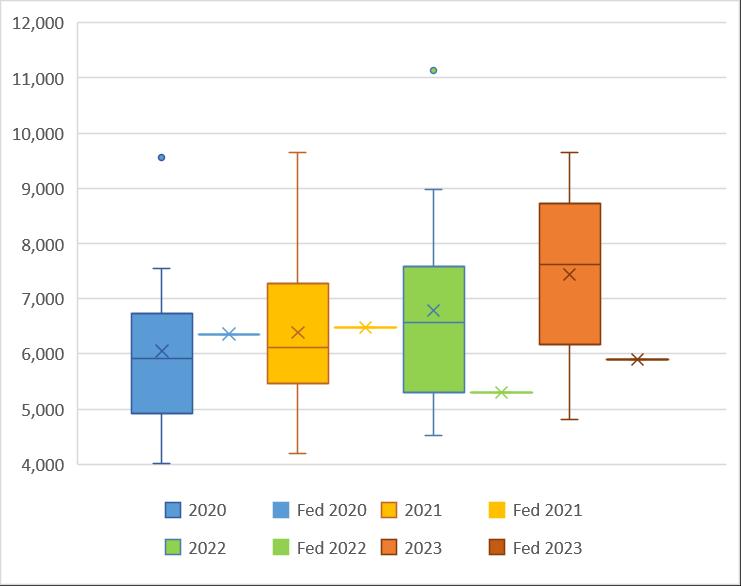
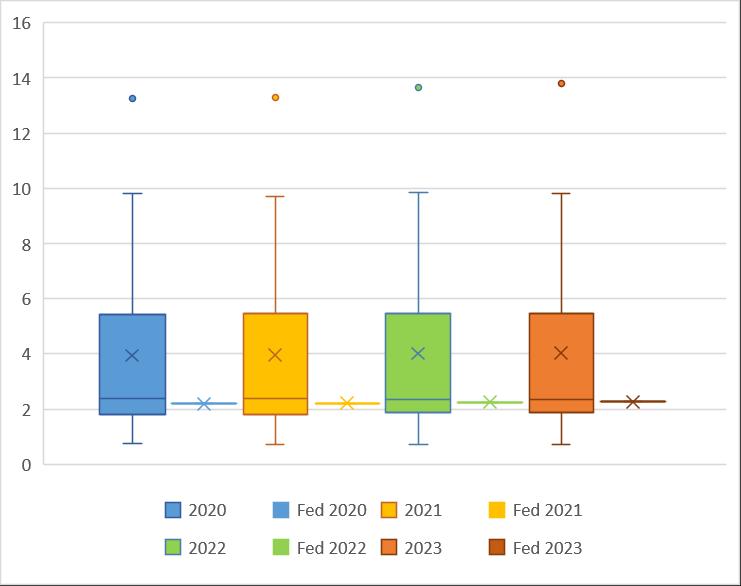
By way of contrast, population density has long been identified as a major determinant of expenditure. As we have already noted, the ill-advised amalgamation resulted in a local government area bigger than many nations abroad. A small population combined with this vast area yields a low population density and suggests an imposing road infrastructure burden. It also means that council has further to drive to deliver services or carry out routine tasks like road inspections. Even in a comparative sense, Federation has relatively low density and is thus faced with a far more difficult operating environment than many of the peer group.
Figure 44: Population Growth
Figure 45: Population Density
Another major obstacle in the operating environment is the large proportion of residents on a pension. People on a pension receive a mandated discount to their rates and some annual charges which is only partially refunded (in FY2023 council was required to give $692,000 in rates and charges rebates but only received $210,000 back from the state government - i.e. a $482,000 loss to revenue). In addition, residents on a pension often require more local government services of a higher quality such as senior citizen halls, more level footpaths and the like. It is thus not surprising to find that proportion of pensioners have been a determinant in most cost function work. Even relative to the peer group Federation is disadvantaged in both a revenue and expenditure sense. It might be noted that statewide 9.8 percent of the population are on the aged pension, thus Federation has almost twice the burden typically experienced by other local governments in NSW.
It is interesting that the HFE grants don’t seem to be reflecting this harsh operating environment.
It is also important to note that people on welfare in Australia receive increases to their payments twice annually, pegged to inflation. Thus, in the years where Federation was receiving a rate cap lower than inflation (Figure 2), people on the pension were, in fact, receiving an additional mandated discount to their local government taxes in real terms.
46: Aged Pension
When we examine the group of people at Federation about to move to an age where they might become eligible for a pension, matters are even more concerning. Add to this the desirability of places such as Mulwala and Howlong for internal migration of pensioners and it becomes clear that decisive action –including a large permanent SRV – will be required to deal with the impending budgetary shock for council.
Figure
Other pension categories are also relevant to the matter of operating environment. In Figure 48 we show that DSP is about typical for Federation whilst in Figure 49 we show that the single parent pension is wellbelow typical. It should be noted that single parent pensions are a relatively small component of the entire pension cohort – less than ten percent of the total pension cohort (aged, DSP etc). Thus, whilst performance in this area is helpful, it does little to ameliorate the large disadvantage faced with respect to the number of residents on the aged pension.
Figure 47: Percentage of Population Aged 60-64
Figure 48: Disability Support Pension
Two other pieces of demographic data have relevance to the operating environment – the number of people on unemployment benefits, as well as the average wage of income earners. Federation has typical proportions of people on unemployment benefits and thus is not subject to operating environment pressures from this particular direction. Scholarly work suggests that the proportion of people on unemployment benefits can drive local government unit costs higher.
Figure 49: Single Parent Pension
Figure 50: Newstart Allowance/ Jobseeker
Federation also has roughly typical levels of median employee incomes. There is a large body of scholarly evidence that suggests higher incomes exert significant upwards pressure on local government unit costs (as many goods seem to be normal in an economic sense). This is why it is essential that taxation collected is commensurate with the incomes accruing to residents (that is, for council to be able to exert an appropriate revenue effort). Unfortunately – as we demonstrate beyond reasonable doubt in our Capacity to Pay Report – the compounding effects of a five-decade long rate capping regime, combined with aborted large SRVs canvassed prior to amalgamation, have resulted in taxation at Federation falling wellbelow average revenue effort. This clearly presents important obstacles to financial sustainability that must be mitigated as soon as possible.
Figure 51: Median Employee Income
3 SRV Proposal and Long Term Financial Plan
Implications
The long-term financial plan (LTFP) is a budget for ten years that takes centre place in IPART considerations of need relating to an SRV.
Accordingly, it is important for the LTFP to be independently evaluated prior to submission with the application. Professor Drew spent many days examining the spreadsheet in detail, including several lengthy Zoom calls with the Directors, Chief Financial Officer, and key finance personnel. All his questions were answered fully, and no restrictions were placed on the data that he could view. In addition, staff went off to recalculate a number of projections after assumptions had been reassessed.
In general, the LTFP at Federation Council was in far better shape than most of the work that Professor Drew has viewed in the past throughout the broader sector. Staff should be congratulated on the detail and thought put into the plan.
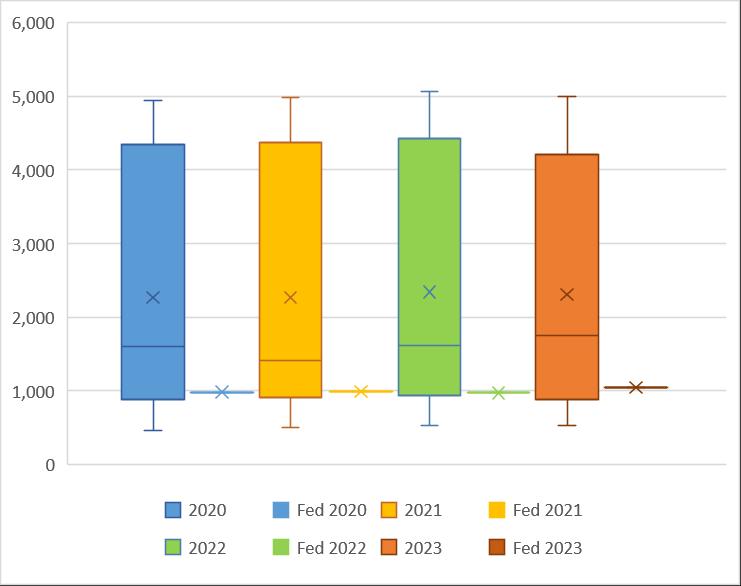
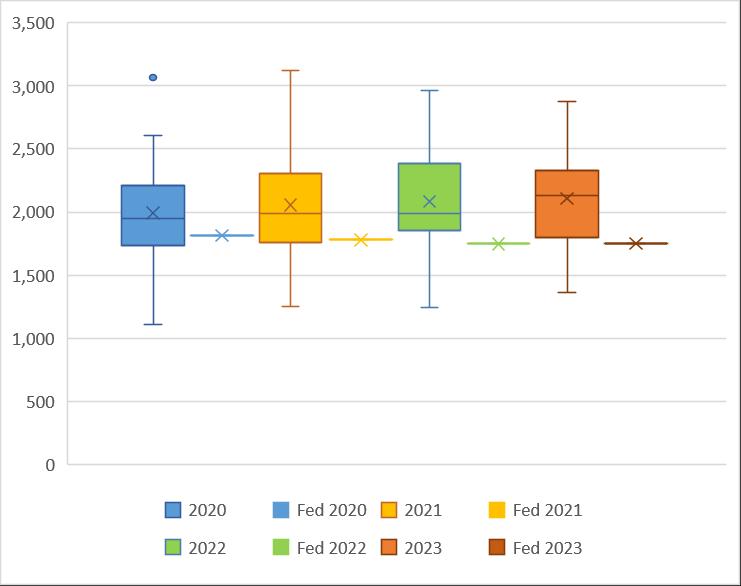
However, it is unfortunately true that very few LTFP are indeed accurate. As forthcoming work from Tsik, Drew and Miyazaki (2024) shows (Figures 52 and 53 below), the accuracy of LTFP used by IPART for past SRV decision making has been less than ideal:
Figure 52: Absolute Value of Income Error (Excluding Capital Grants) in Previous SRVs By Peer Councils
Part of the problem is unpredictable grant allocations, but even when we removed these from past work, we were disappointed in the results of these councils. The other problem is unpredictable mandates and regulatory hurdles – such as centralised auditing (which increased costs substantially), the Red Fleet depreciation controversy, as well as audit and risk committee establishment and operating costs. It is also likely that many of these councils in the past did not put quite as much thought and detail into their LTFP as might be desired.
This is why it was absolutely critical for Professor Drew to spend considerable time interrogating the LTFP for Federation.
Professor Drew asked staff to adjust a number of parameters and assumptions. Most notably, this included changes to inflation projections (and their associated income and expenditure implications), FAG receipts (adjusted up in view of the new formulas as well as strong advocacy by Mayor Pat Bourke at state forums), Saleyard receipts (down in view of industry changes and rainfall predications), fuel costs (up in view of oil prices and geopolitical pressures).
The next task was to work out the SRV figure relative to both the revenue needed, according to the LTFP, the SRV Guidelines, and political pragmatism. The Guidelines for replacing a temporary SRV with a permanent, as well as a further increase, are very ‘complex’ and open to various potential interpretations (IPART, 2024, p. 30). Our approach was to go back to the permissible general rate income calculations in the 2023-24 financial year statements and start with the ‘last year notional general income yield’ data and apply the appropriate two subsequent approved rate caps (4.3% followed by 4.5%). This provided us with a permissible income figure that was exclusive of the Temporary SRV increases actually actioned at Federation. We then compared this number to the likely actual permissible income (these financial statements for 2023/24 didn’t exist in April 2024, of course).
The starting point for our considerations was that the Temporary SRV would need to be made permanent. The gap between the likely actual permissible income figure for 2024/25 (inclusive of the second part of the Temporary SRV (17%) and the permissible income without any of the Temporary SRVs was circa 27.69%.
We then looked at what would be required for Year 1 of this present application (2025/26) which was approximately $15,390 (recall that financial statement figures are presented in thousands of dollars; an
Figure 53: Absolute Value of Expenses Error in
uplift of 19% in nominal terms on the likely actual for 2024/25; recall all figures in financial statements are given in thousands of dollars). The gap between the permissible income in 2024/25 without the Temporary SRV, and this required income was 52.01 percent.
An additional eleven percent for the following year (2026/27) would yield approximately $17,206. The cumulative increase at this point would be 68.94 per cent (the actual figures may change by a few tenths of a percent as a result of rounding error – financial statements are rounded to the nearest thousand of dollars).
Readers should note a number of points regarding the above. First, the figures and our calculations are subject to OLG agreement. Second, what we are talking about is first turning the temporary SRV into a permanent SRV. This makes the total percentage appear somewhat larger than might otherwise be thought, given that the new increases will be nineteen percent in 2025/26 followed by an eleven percent in 2026/27. The headline SRV figure is inclusive of an assumed rate cap. We have gone higher than the two-point-five percent rate cap that the OLG tells all councils to assume and have set out our reasons for doing so in our advice to Council on this matter. It is possible that our revised assumed rate cap may be lower than what is actually put forward by IPART in the future, and if this is the case, then Council would receive a lower additional amount in real terms than what was hoped (and residents receive a relatively lower burden in real terms than might first appear to be the case). What IPART actually decides a year or more hence is clearly beyond anyone’s current knowledge. We would note that the risk seems to mainly lie with council.
In this regard it is important to note that if the community wished to extend the increases over a more lengthy period, then this would have important implications for both the appearance of the headline SRV cumulative figure, as well as financial sustainability. Extending the period increases the number of compounding periods by the assumed rate peg and makes the cumulative number appear much larger. Extending the period also shifts the risk from the residents to the Council, should most economists’ predictions of sticky inflation, with a jawboning central bank deliberately understating inflation projections, come true. For this reason, we strongly caution against extending the SRV over a longer period.
The proposed SRV is not anywhere near sufficient to assure financial sustainability. Staff have estimated that a 120% increase would be required to achieve this, although we think that this number actually understates matters somewhat (based on current revenue and expenditure expectations). What the proposed SRV does achieve is to make a start on the sustainability journey. Efficiencies, repricing unregulated goods and services, reductions to service quality and quantity, and service and asset divestments will all also be required. In addition, we are hoping that the state government might consider greater support for the community whose problems were clearly exacerbated by the amalgamation. We are also hoping for future FAG grant allocations that are more consistent with the horizontal fiscal equalisation objective of the Local Government (Financial Assistance) Act (1995, CTH).
Without these things happening serious financial constraints will start to pinch around the third year. Changes to service levels will thus have to be effected in response. The community should expect to go through a new additional SRV process within five years’ time. What Council will have to come back with in the future will be a function of the interim decisions that this present proposed SRV provides time for people (at state, federal and local government levels) to make.
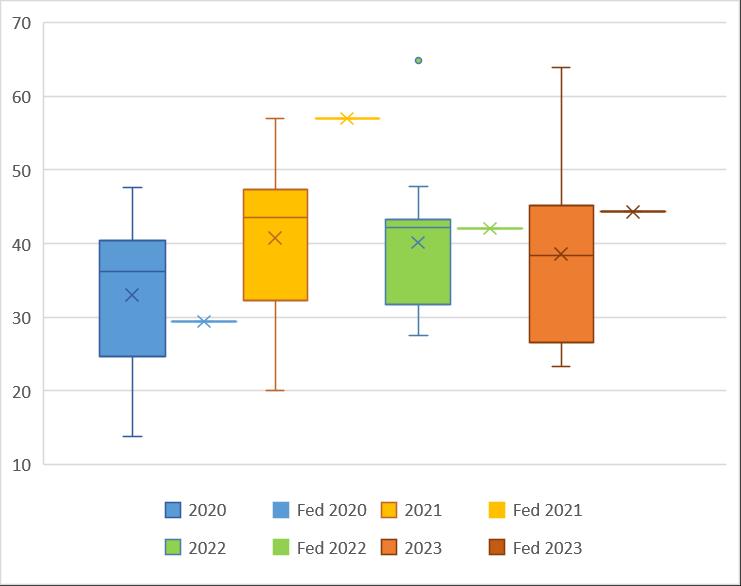
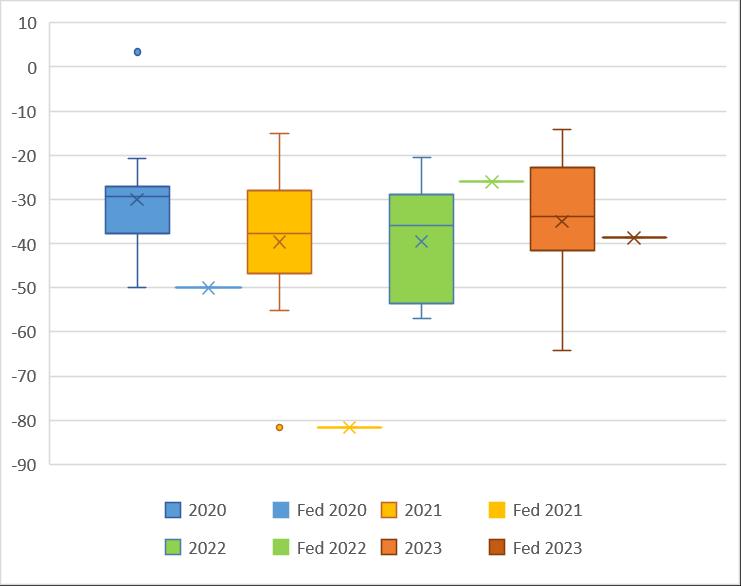
In Figure 54 we illustrate the implications for the LTFP relative to the peer group over the forthcoming years. Things will improve over the next three financial years but are expected to deteriorate thereafter. Notably we are projecting that Council will still have below median (typical) outcomes relative to peer
group for all years except 2026/27. This is concerning given that most would agree that the peer group is on-the-whole fiscally distressed. Clearly without the proposed SRV being approved in full there must be serious concerns about the Council’s ability to provide core services and arrest the alarming increase to implicit liabilities (especially with respect to road maintenance).
Figure 54: Long Term Financial Plan Operating Result After Capital Grants After SRV (Comparison to Available Peers)
4 SRV Recommendation
(must be considered in light of our other four reports)
In sum, the three independent professors that have authored this report strongly recommend that Federation Council submits a SRV which turns the current temporary into a permanent increase, in addition to an uplift of nineteen and eleven-point-eight percent, respectively, in the first two years of operation.
We caution against extending the SRV beyond two years and reiterate our earlier comments regarding both the effect of compounding as well as the transfer of risk that such an act would elicit.
Moreover, we also state plainly our expectation that an additional SRV will be likely within five years. The precise amount that will be required in the future is dependent on decision-making at the local, federal and state levels.
Furthermore, to borrow from the words of the NSW Treasurer, we assert that ‘nice to have policies will need to wait’ for the foreseeable future (ABC, 2024). Instead, the focus will need to be placed squarely on the ‘must have policies’ such as infrastructure remediation (Mookhey in ABC, 2024). Indeed, we also echo Mr Mookhey’s calls for a fairer share of intergovernmental grant revenues in the future (ABC, 2024).
References
Dole, N. (2024). NSW Treasurer Daniel Mookhey Warns of Tough Budget Due to $11.9 Billion GST Hole’. Australian Broadcasting Corporation. Monday 22nd April 2024. Available at: https://www.abc.net.au/news/2024-04-22/nsw-treasurer-daniel-mookhey-warns-budget-shock11b-gst-hole/103751654
Drew, J. (2017). Playing for Keeps: Local Government Distortion of Depreciation Accruals in Response to High Stakes Public Policy-Making. Public Money & Management, 38(1): 57-64.
Drew, J. (2020). Reforming Local Government. Springer Palgrave: Singapore.
Drew, J. (2021). Saving Local Government. Springer Palgrave: Singapore.
Drew, J. and Campbell, N. (2016). Autopsy of Municipal Failure: The Case of Central Darling Shire. Australasian Journal of Regional Science, 22(1): 81-104.
Drew, J. and Dollery, B. E. (2014). Road to Ruin? Consistency, Transparency and Horizontal Equalisation of Road Grant Allocations in Eastern Mainland Australian States. Public Administration Quarterly, 39(3): 517-545.
Drew, J. and Dollery, B. E. (2016). What’s In a Name? Assessing the Performance of Local Government Classification Systems. Local Government Studies, 42(2): 248-266.
Drew, J. and Dollery, B.E. (2020). Introduction to the Special Edition of Public Administration Quarterly: The Economics and Politics of financial Unsustainability in Local Government. Public Administration Quarterly, doi.org/10.37808/paq.44.2.1.
Drew, J. and Grant, B. (2017). Means, Motive and Opportunity: Distortion of Public Policy Making Performance Management Data. Australian Journal of Public Administration, 75(1): 237-250.
Drew, J., McQuestin, D., and Dollery, B. (2021). Did Amalgamation Make Local Government More Fit for the Future? Australian Journal of Public Administration, DOI: 10.1111/1467-8500.12530.
Drew, J. McQuestin, D, and Dollery, B. (2023). Fiscal Outcomes Arising from Amalgamation: More Complex than Merely Economies of Scale. Public Management Review, https://doi.org/10.1080/14719037.2023.2174586
Drew, J., Miyazaki, M., Kortt, M. (2023). The Other Side of the Local Government Ledger – The Association Between Revenue Growth and Population Growth. Australian Journal of Public Administration, DOI: 10.1111/1467-8500.12583.
Drew, J., Miyazaki, M., McQuestin, D. (2024). Is ‘More’ Better? Testing the Assumption That Larger Local Governments Are More Sustainable. Australian Journal of Public Administration, In Print
Independent Pricing and Regulatory Tribunal (IPART) (2021). Rate Peg for NSW Councils for 2022-23. IPART: Sydney.
McQuestin, D., Noguchi, M., and Drew, J. (2020). The Association between Budget Inaccuracy and Technical Efficiency in Australian Local Government. Public Money & Management (in print).
McQuestin, D., Miyazaki, M. and Drew, J. (2020). Do Amalgamations Make a Difference? What We Can Learn from Evaluating the Policy Success of a Large Scale Forced Amalgamation, Public Administration Quarterly, 45(3): 278-298.
Reserve bank of Australia (2024b). Historical Forecasts. Available at: https://www.rba.gov.au/statistics/historical-forecasts.html


