resiliency
“Resilience helps to bridge the gap between disaster risk reduction and climate change adaptation. It accepts the possibility that a wide range of disruptive events – both stresses and shocks – may occur but are not necessarily predictable. It enhances the performance of a system in the face of multiple hazards, rather than preventing or mitigating the loss of assets due to specific events.” (City Resilience Index.”
Collaborators
Instituto Tecnológico de Estudios Superiores de Monterrey School of Architecture. Urbanism Bachelor Sustainable Metropolis: Adaptation
Supervised by: Dra. Karen Hinojosa Dra. Natalia Cervantes Sheila Ferniza
Made by: Ana Cepeda Catalina Salinas Fernando Rodriguez Lia Amelia Rosario Luis Moniet Paulina Ramirez Sara Cardona Victor Sierra October 2022
Content
Executive summary
01 INTRODUCTION
03 DIAGNOSIS
CONTEXT
and
and
and
and
04 master plan proposal
05 CONCLUSIONS
6 MASTER PLAN
3.1 HISTORICAL
3.2 Infrastructure
environment 3.3 Economy
society 3.4 Health
wellbeing 3.5 leadership
strategy 3.6 rapid resilience review cri 3.7 Qualitative RISK ASSESSMENT 3.8 Conclusions 4.1 Introduction to Master Plan 4.1.1Methodology 4.2 lEGAL FRAMEWORK 4.3 MASTER PLAN 4.3.1 Vision 4.3.2 Objectives 4.3.3 Guiding principles 4.3.4 Strategies 4.3 Specific areas of intervention 4.4 Stages of intervention
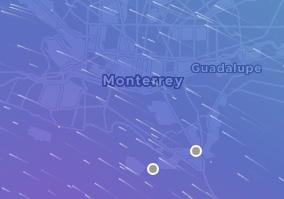
2.1 LOcation 2.2 SITE DESCRIPTION 2.3 objective of document
7
EXECUTIVE SUMMARY
Resilience has been a concept that has gained relevance as the population and risks increase. (ONU-HÁBITAT, 2018) The more population we found in the territory, the more we can see manifestations of climate change due to unsustainable habitating patterns. There´s a need for new strategies to increase coping to hazard events, considering that more than a half of the world´s population are living in cities and 64% of those people have been affected by a natural hazard event (ONU-HÁBITAT, 2018).
The vision for the master plan is that Monterrey’s city center develops closely to its historical and territorial identity with a perspective that embraces preservation and regeneration of the environment. It evolves with an understanding of the social diversity that exists within its neighborhoods and interventions that prioritize resilience through adaptation and mitigation to the hazards of the area.
This master plan pretends to increase the resilience of Monterrey’s center through the methodology of the analysis of the current state of the site, a City Resilience Index (CRI), and a Qualitative Risk Assessment, that highlights the 8 strategic zones of the site that need specific interventions, that are aligned
to the vision, objectives, guiding principles and strategies of the site. It’s needed to point out that the guiding principles are done based on how to make city’s system resilient on the methodology of CRI. The document is made in different dimensions based on the Rapid Resilience Review of the City Resilience Index:
• Infrastructure and Environment Economy and Society
• Health and Wellbeing
• Leadership and Strategy
Right: Etiam egestas, dui vel facilisis consequat, massa nibh ultrices nisl, sed sollicitudin diam odio non ante
8
“Even though resilience is not something that you can accomplish from one day to the next, the first step has been taken.”
9
10
11 SECTION 01: INTRODUCTION
12
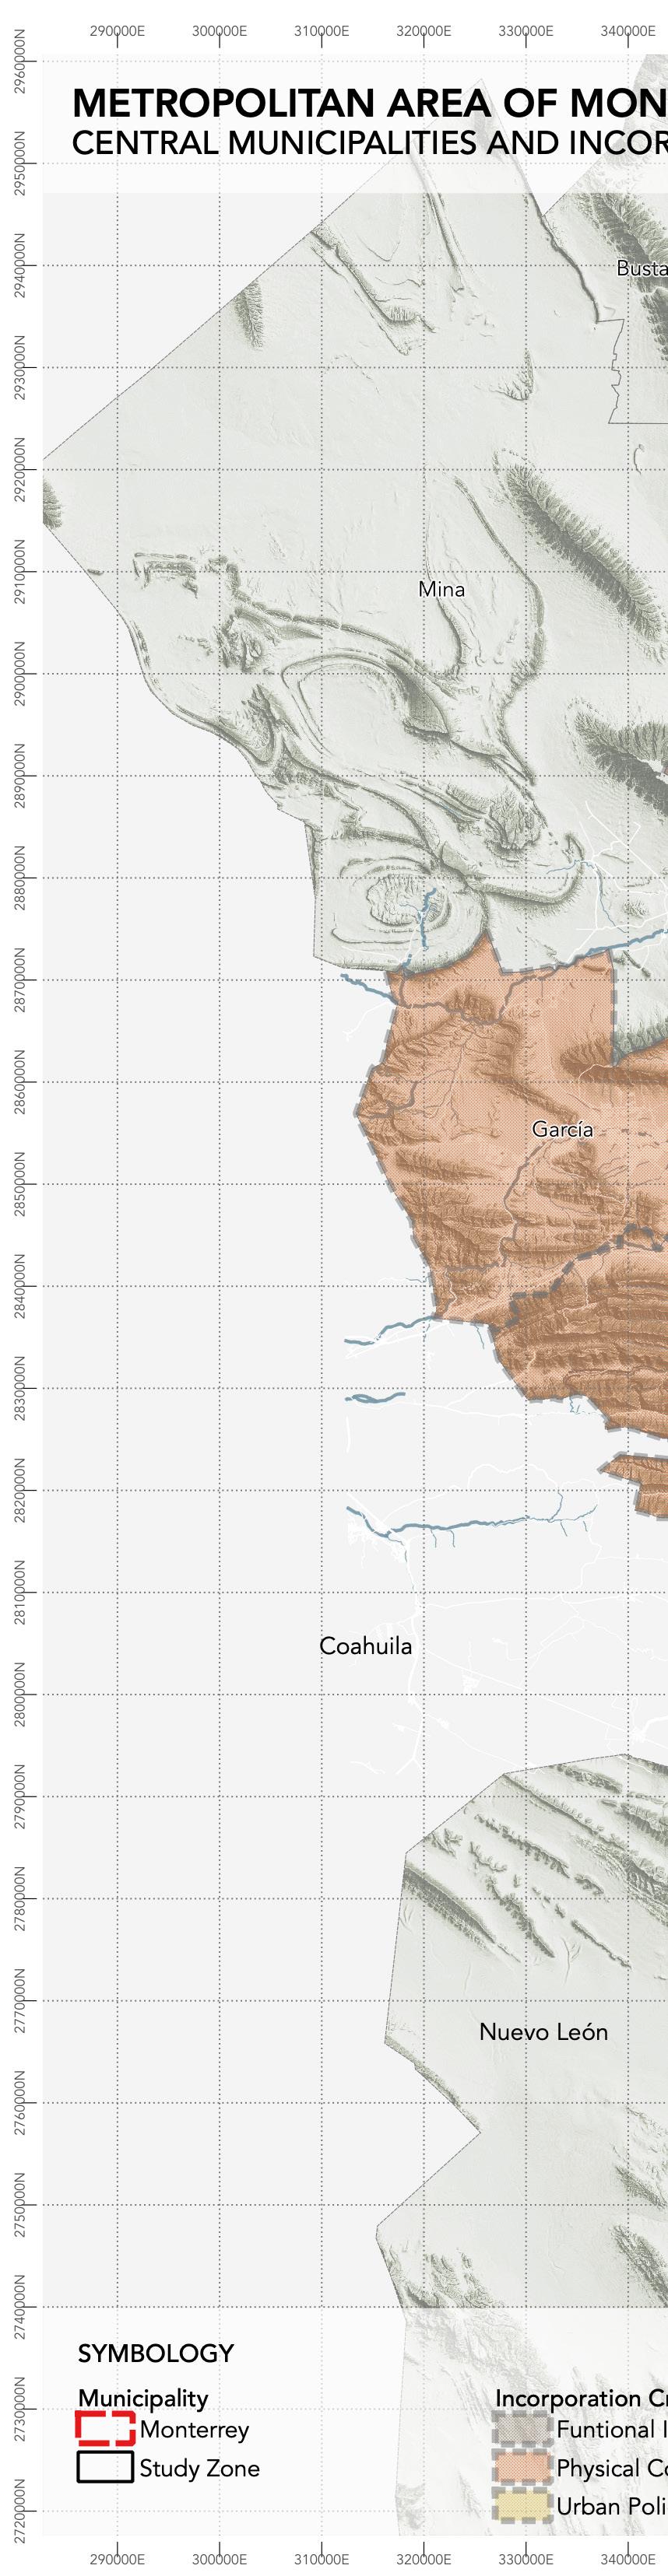
“Monterrey’s Metropolitan Area is composed of 18 municipalities which are divided into central and exterior municipalities.”
INTRODUCTION
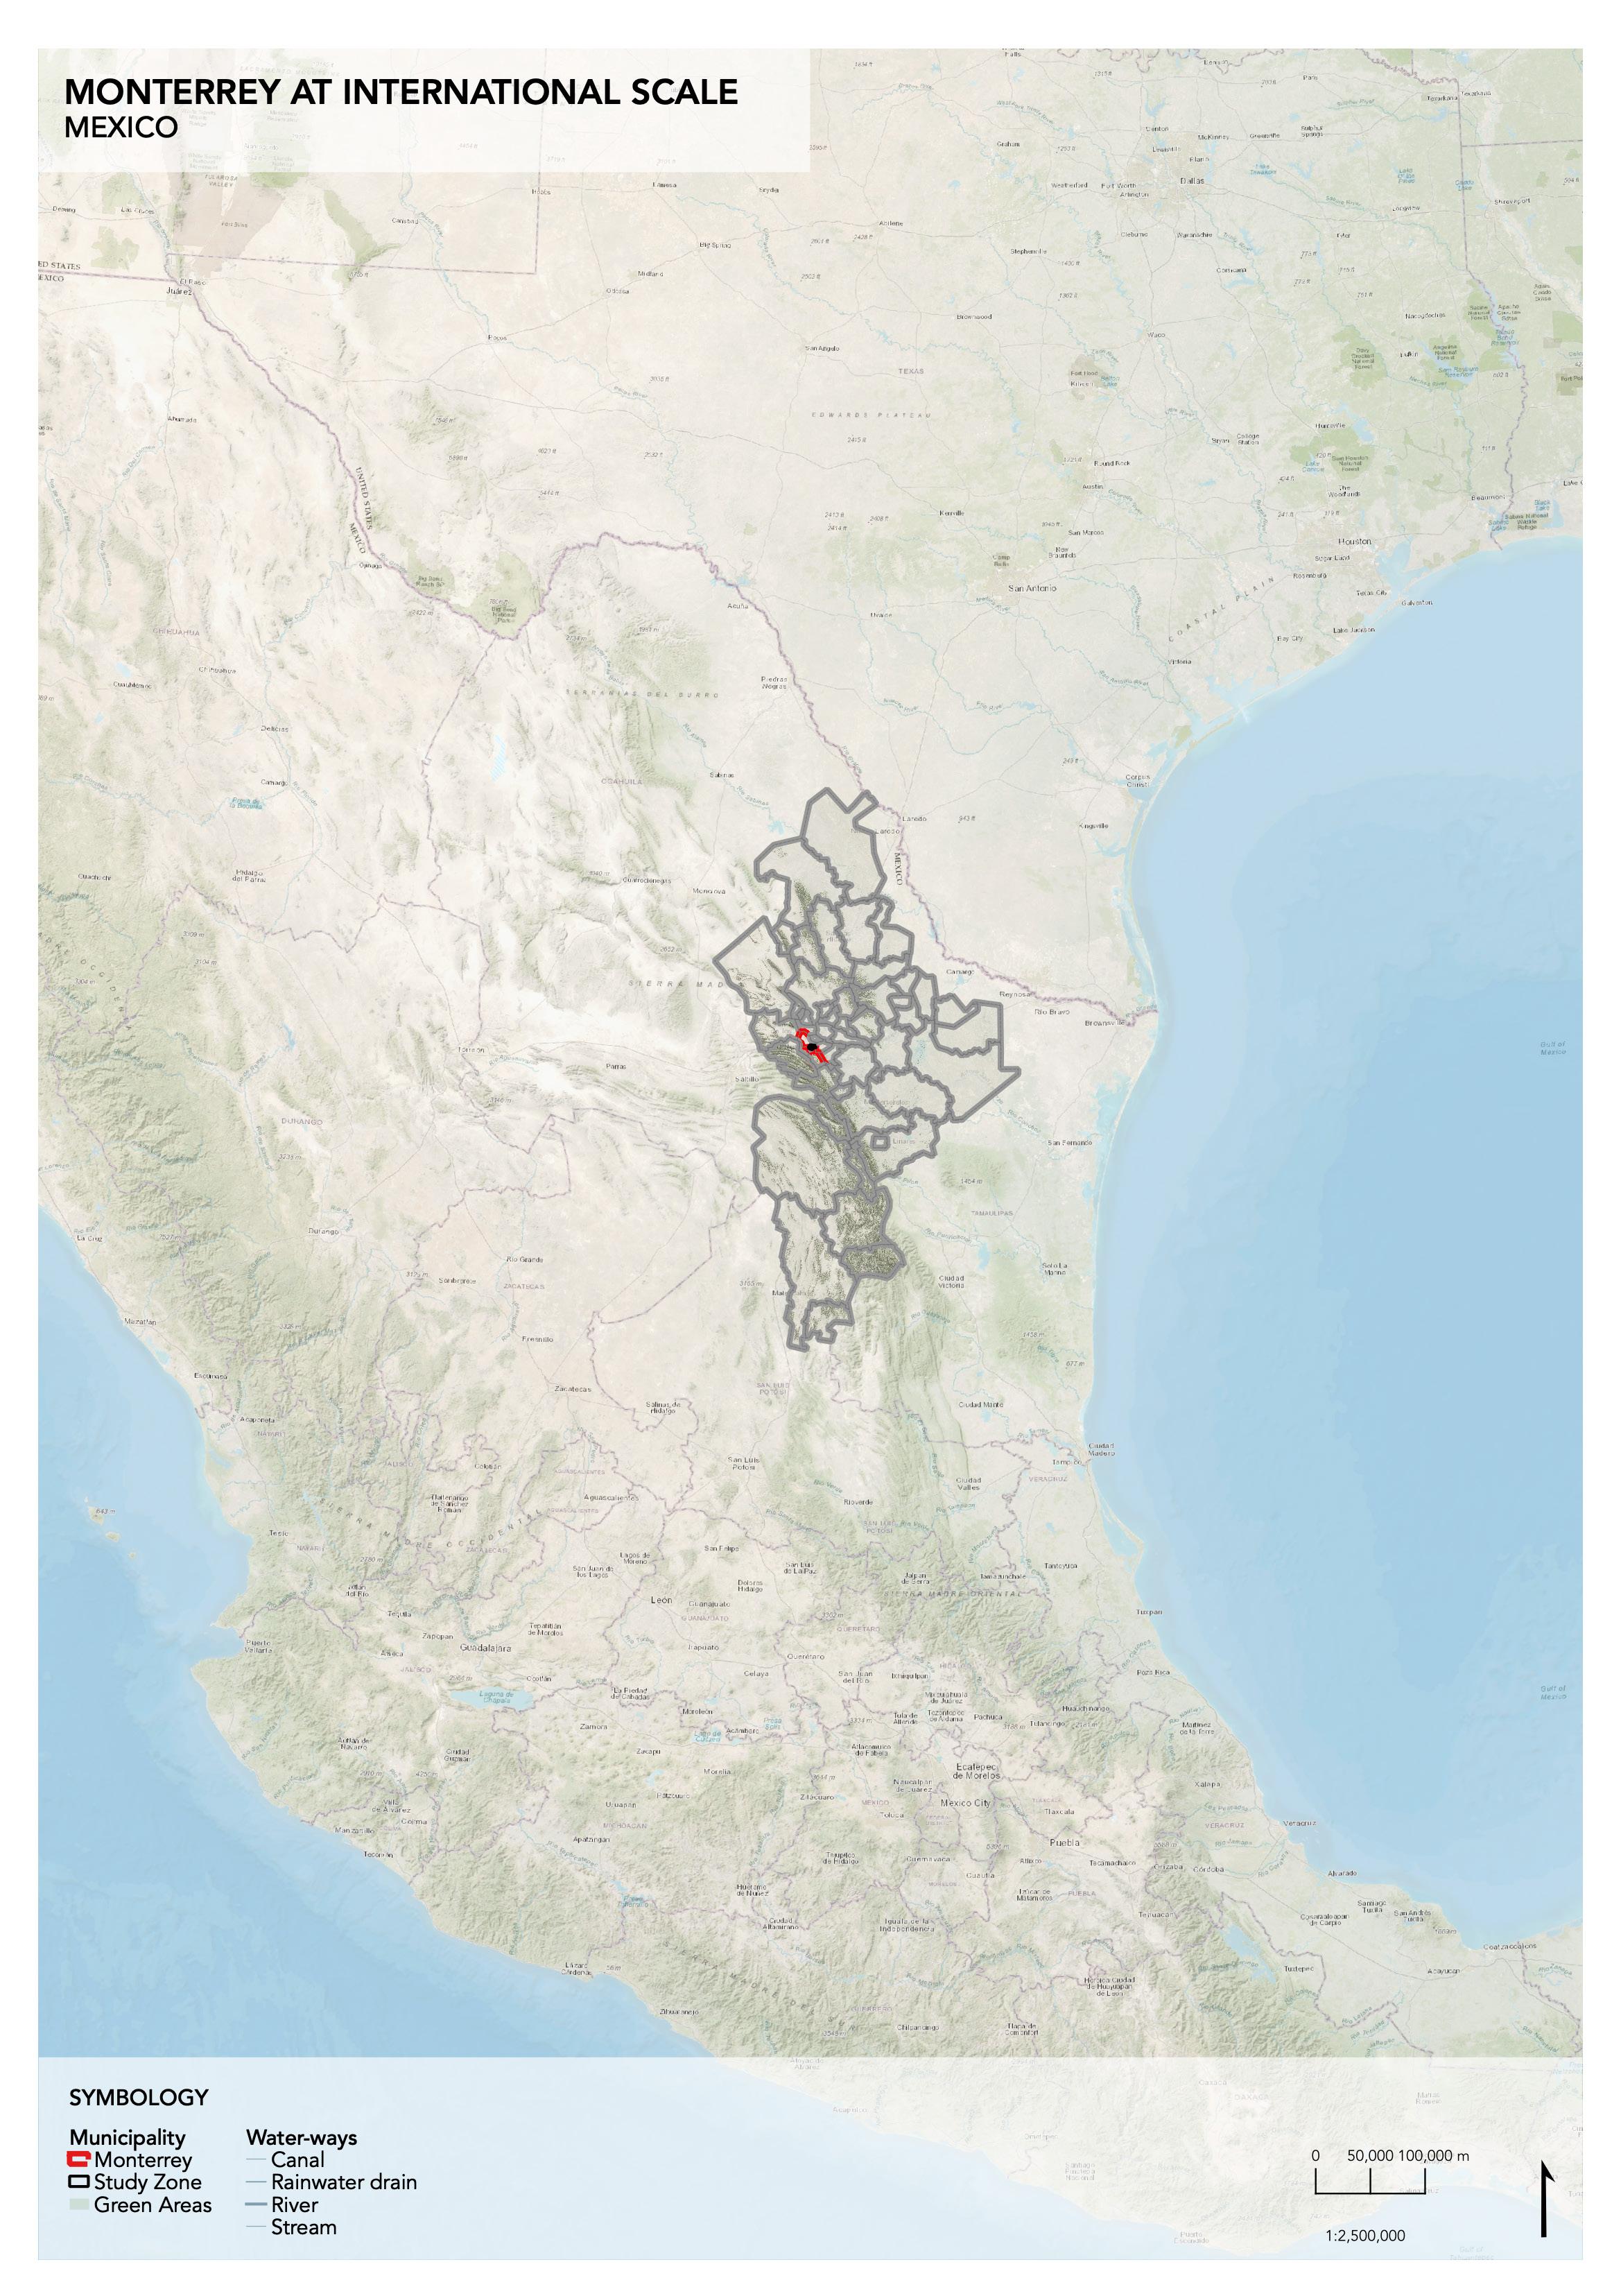
Monterrey, Nuevo León is one of the 3 most important metropolitan areas in Mexico and the most important in the northern part of the country. It’s always been recognized for its industrial, technological, and economic dynamics. The strategic location of the municipality presents a lot of opportunities for employment and the industrial character of the city also. Nevertheless, metropolitan areas are complex not only for their scale but also for the diverse stakeholders present in the city.
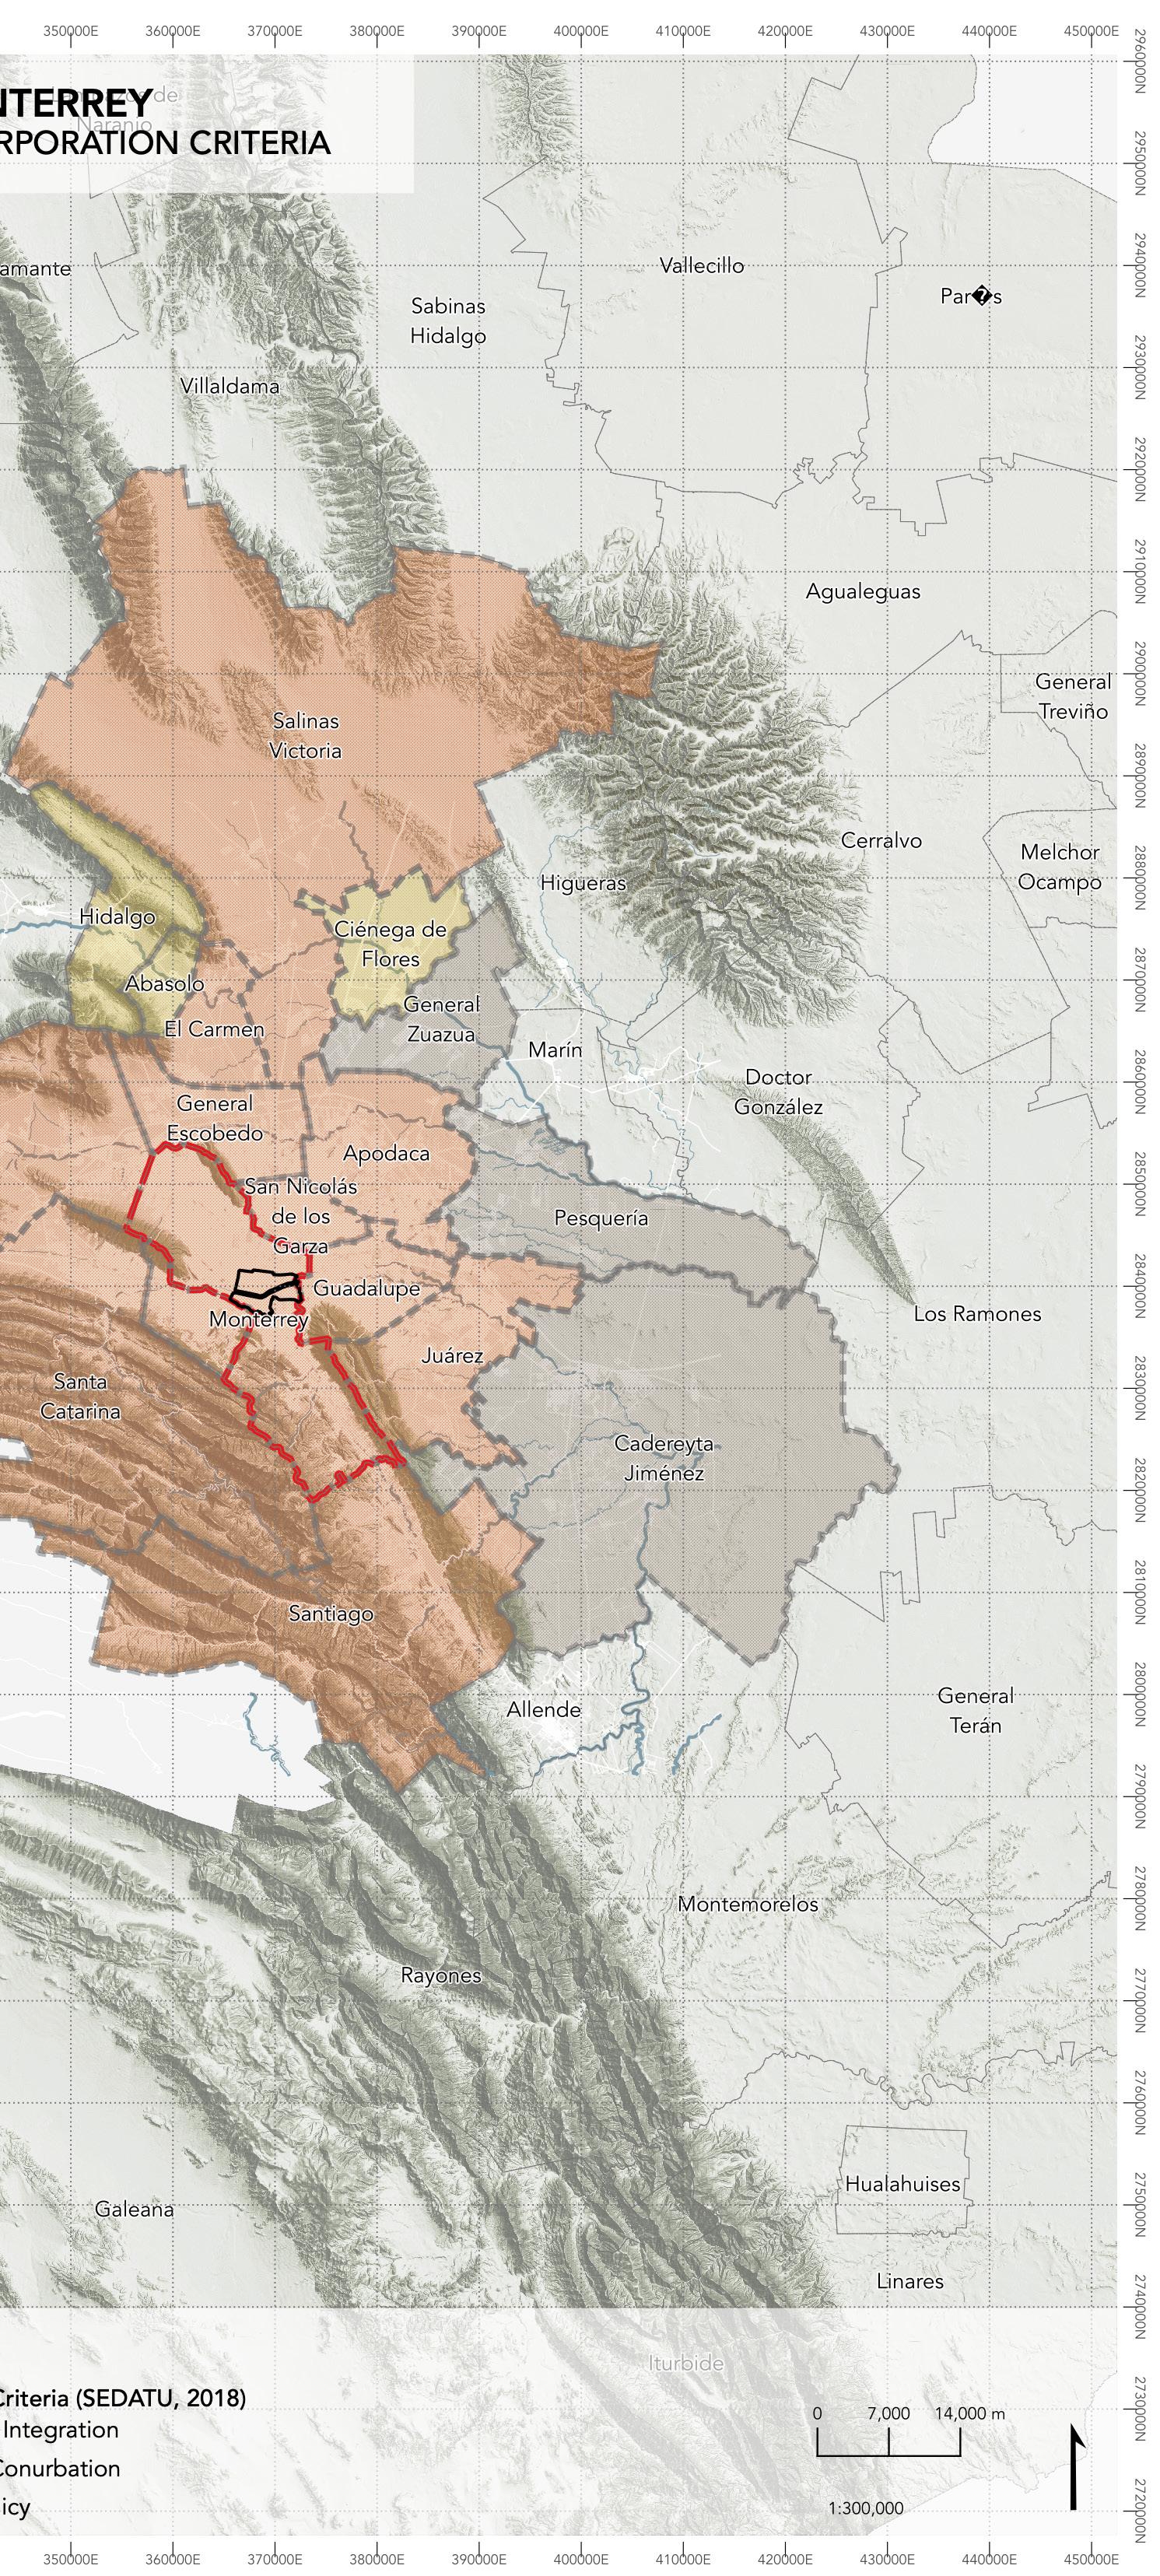
Monterrey’s Metropolitan Area is composed of 18 municipalities which are divided into central and exterior municipalities. The central municipalities are the physical conurbation of Apodaca, El Carmen, García, San Pedro Garza García, General Escobedo, Guadalupe, Juárez, Monterrey, Salinas Victoria, San Nicolás de los Garza, Santa Catarina, and Santiago. The exterior municipalities are divided between functional integration; where Cadereyta Jimenez, Pesquería, and General Zuazua take the role of dormitory towns; and urban policy. The municipalities in urban policy are Hidalgo, Abasolo, and Ciénega de Flores. (SEDATU, 2018).
13
Elaborated by Paulina Ramirez Leal with information from INEGI (2020) and OSM
INTRODUCTION
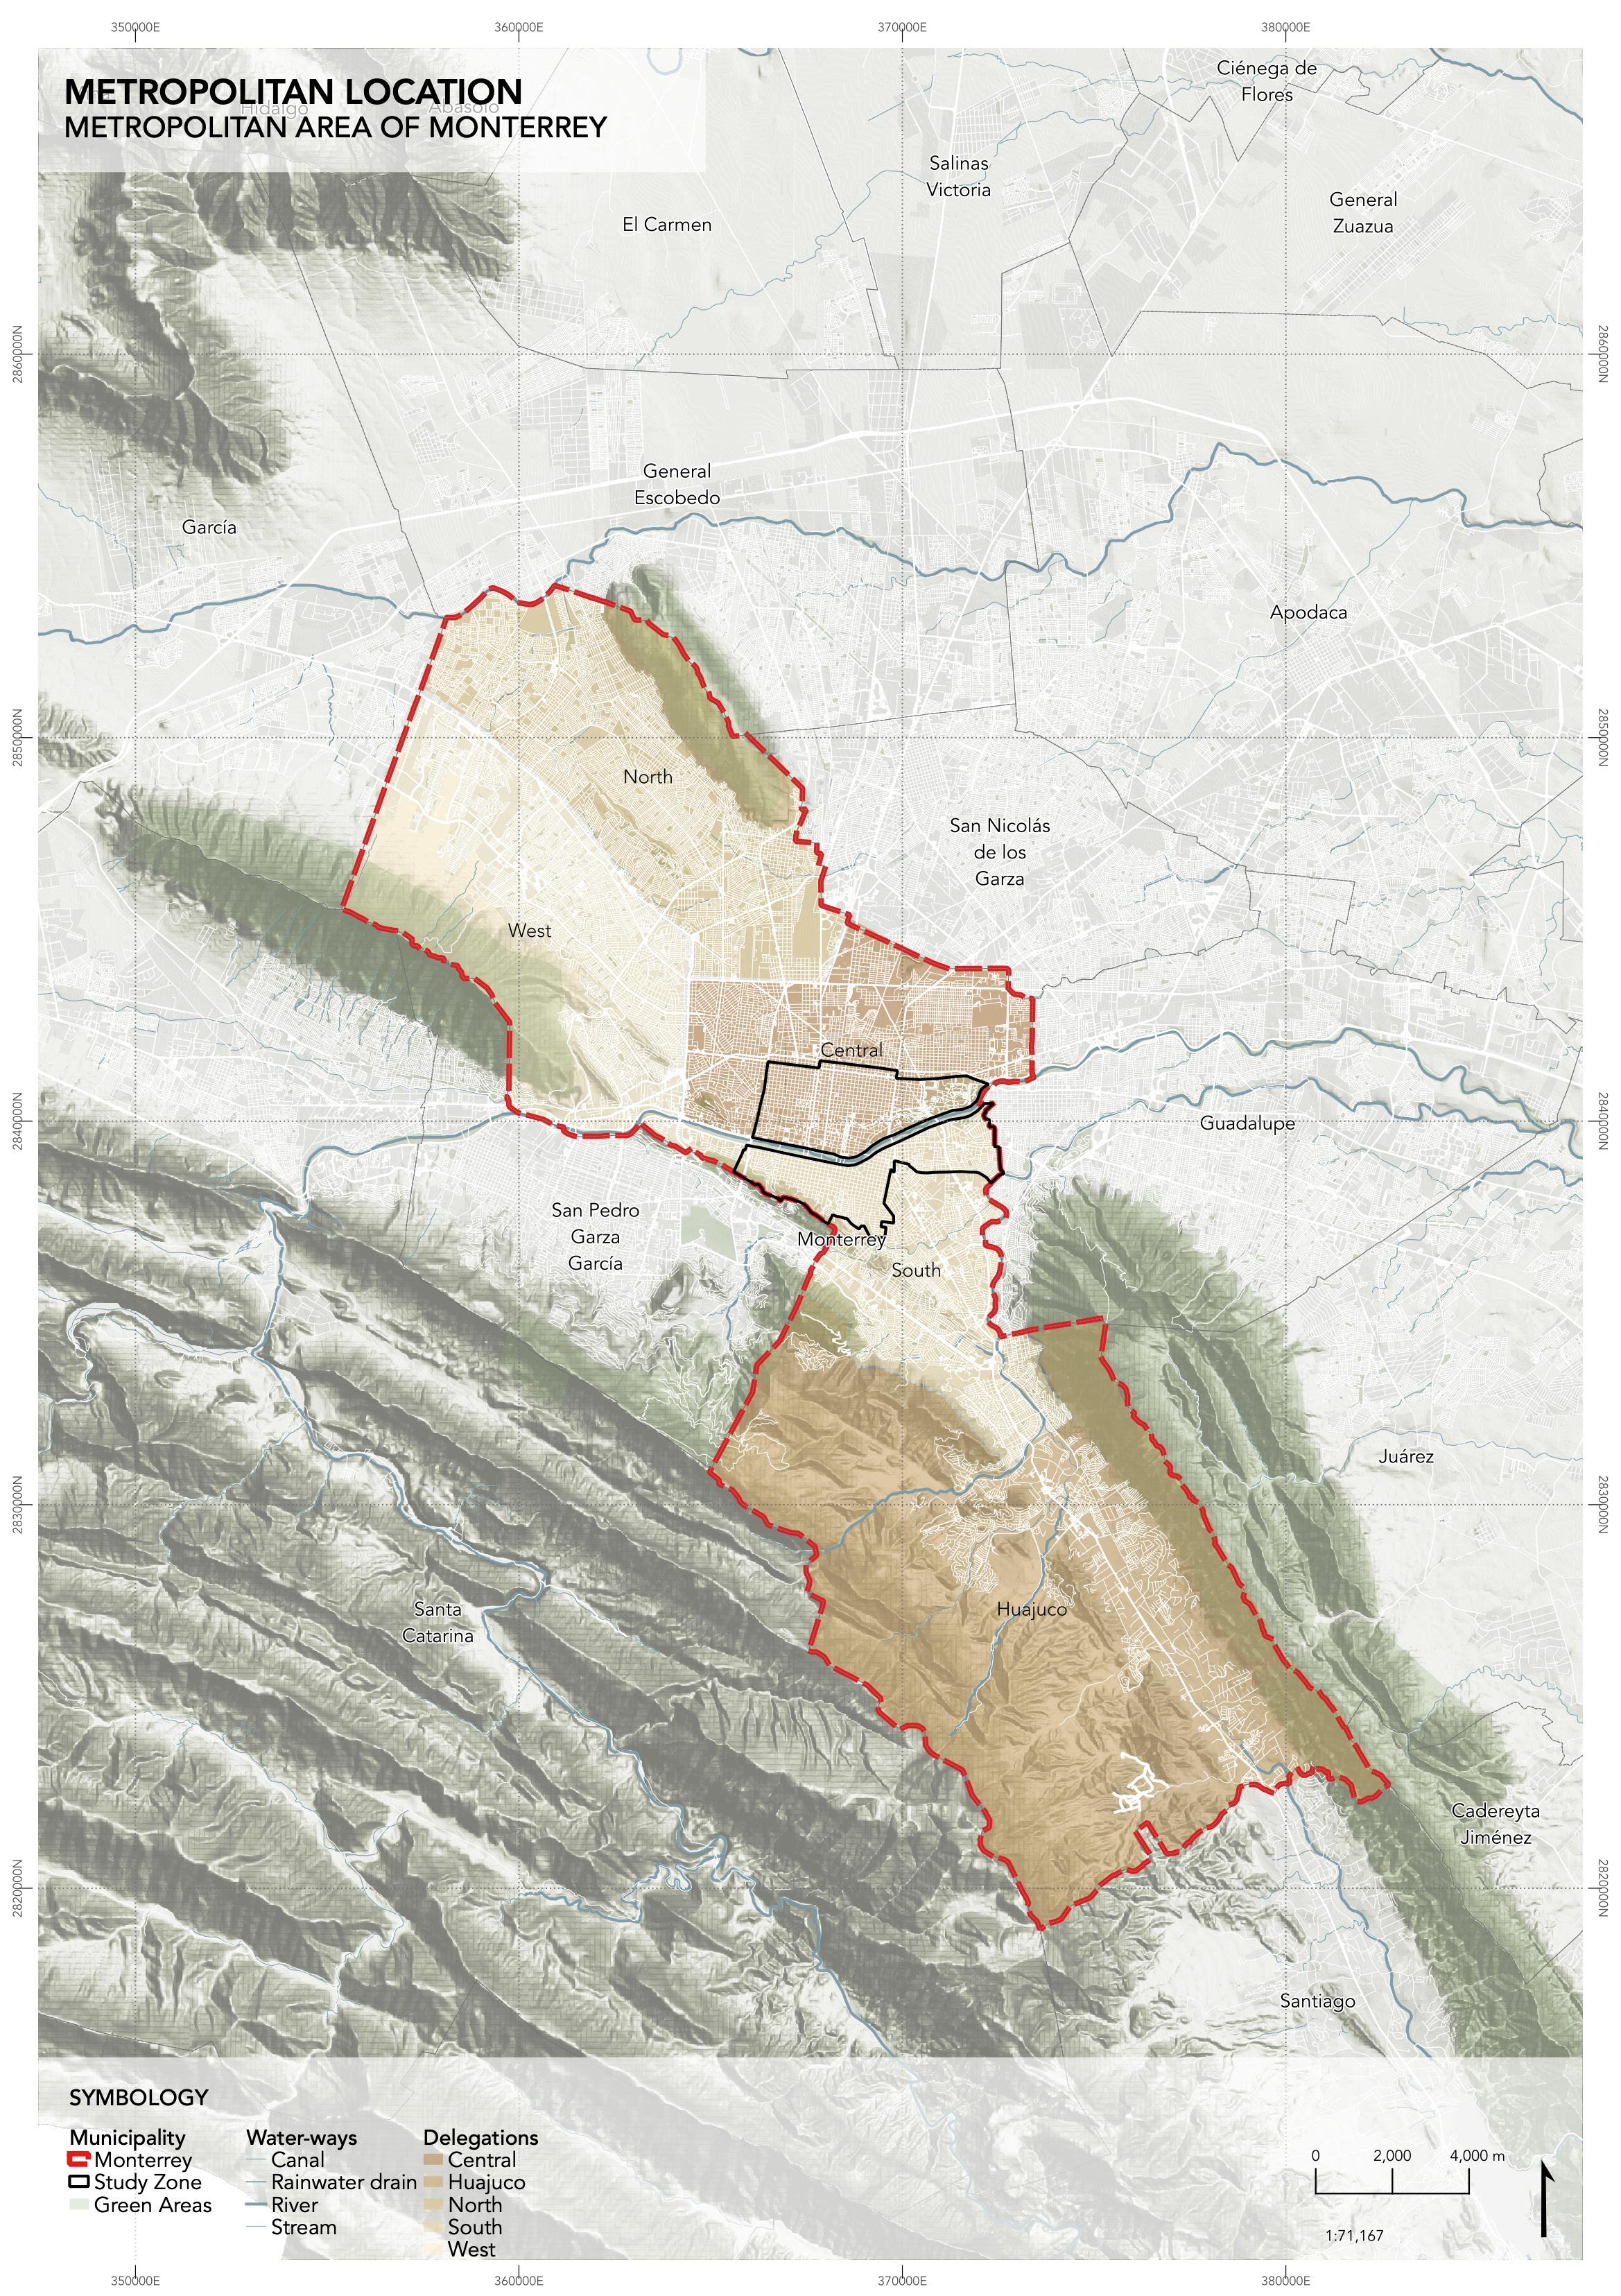
The municipality of Monterrey has 33,899.85 ha and is divided into delegations as a result of the pattern of populationssettlements and physical structure of the municipality.”
The municipality of Monterrey has 33,899.85 ha and is divided into delegations as a result of the pattern of populations settlements and physical structure of the municipality. These delegations are Central, North, West, South, and Huajuco.
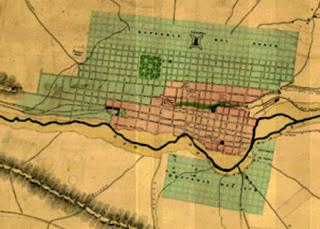
Many latin-american cities have high levels of social segregation that is expressed on urban space, this zone is not the exception. Since the foundation of the city in 1596, spatial
segregation can be found, (see image 1) as a result of the process of economic expansion resulting in social segregation. (Zúñiga y Ribeiro 1990).
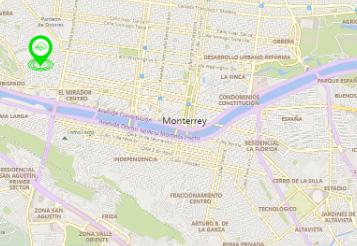
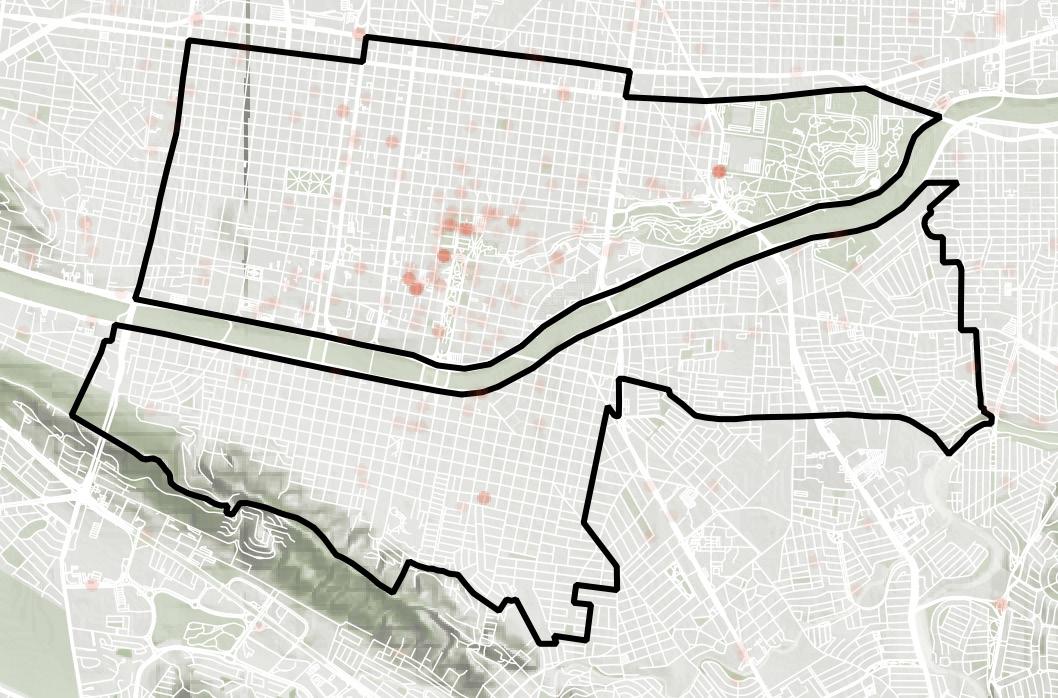
This document focuses on Central and South delegations of Monterrey, that implies Monterrey’s city center (north poligon of study zone) and Independencia neighborhood (south poligon of study zone).
The purpose of this document is to examine and understand the site, presenting an urban diagnosis that takes into consideration the following dimensions:
• Infrastructure and environment
• Economy and society Health and wellbeing
• Leadership and strategy.
This dimensions were considered because we are aligning this document to the Rockefeller Foundation City Resilience Index.
It also presents a risk map with the hazards and vulnerabilities the study zone faces, complementary to this, an evaluation of the zone’s resilience, with the methodology of Rapid Resilience Index, by ARUP.
Left: Monterrey 1895 cartography by Epstein. Mapoteca Orozco y Berra.
Right: Elaborated by Paulina Ramirez Leal with information from INEGI (2020) and OSM
14
15
16
Source:

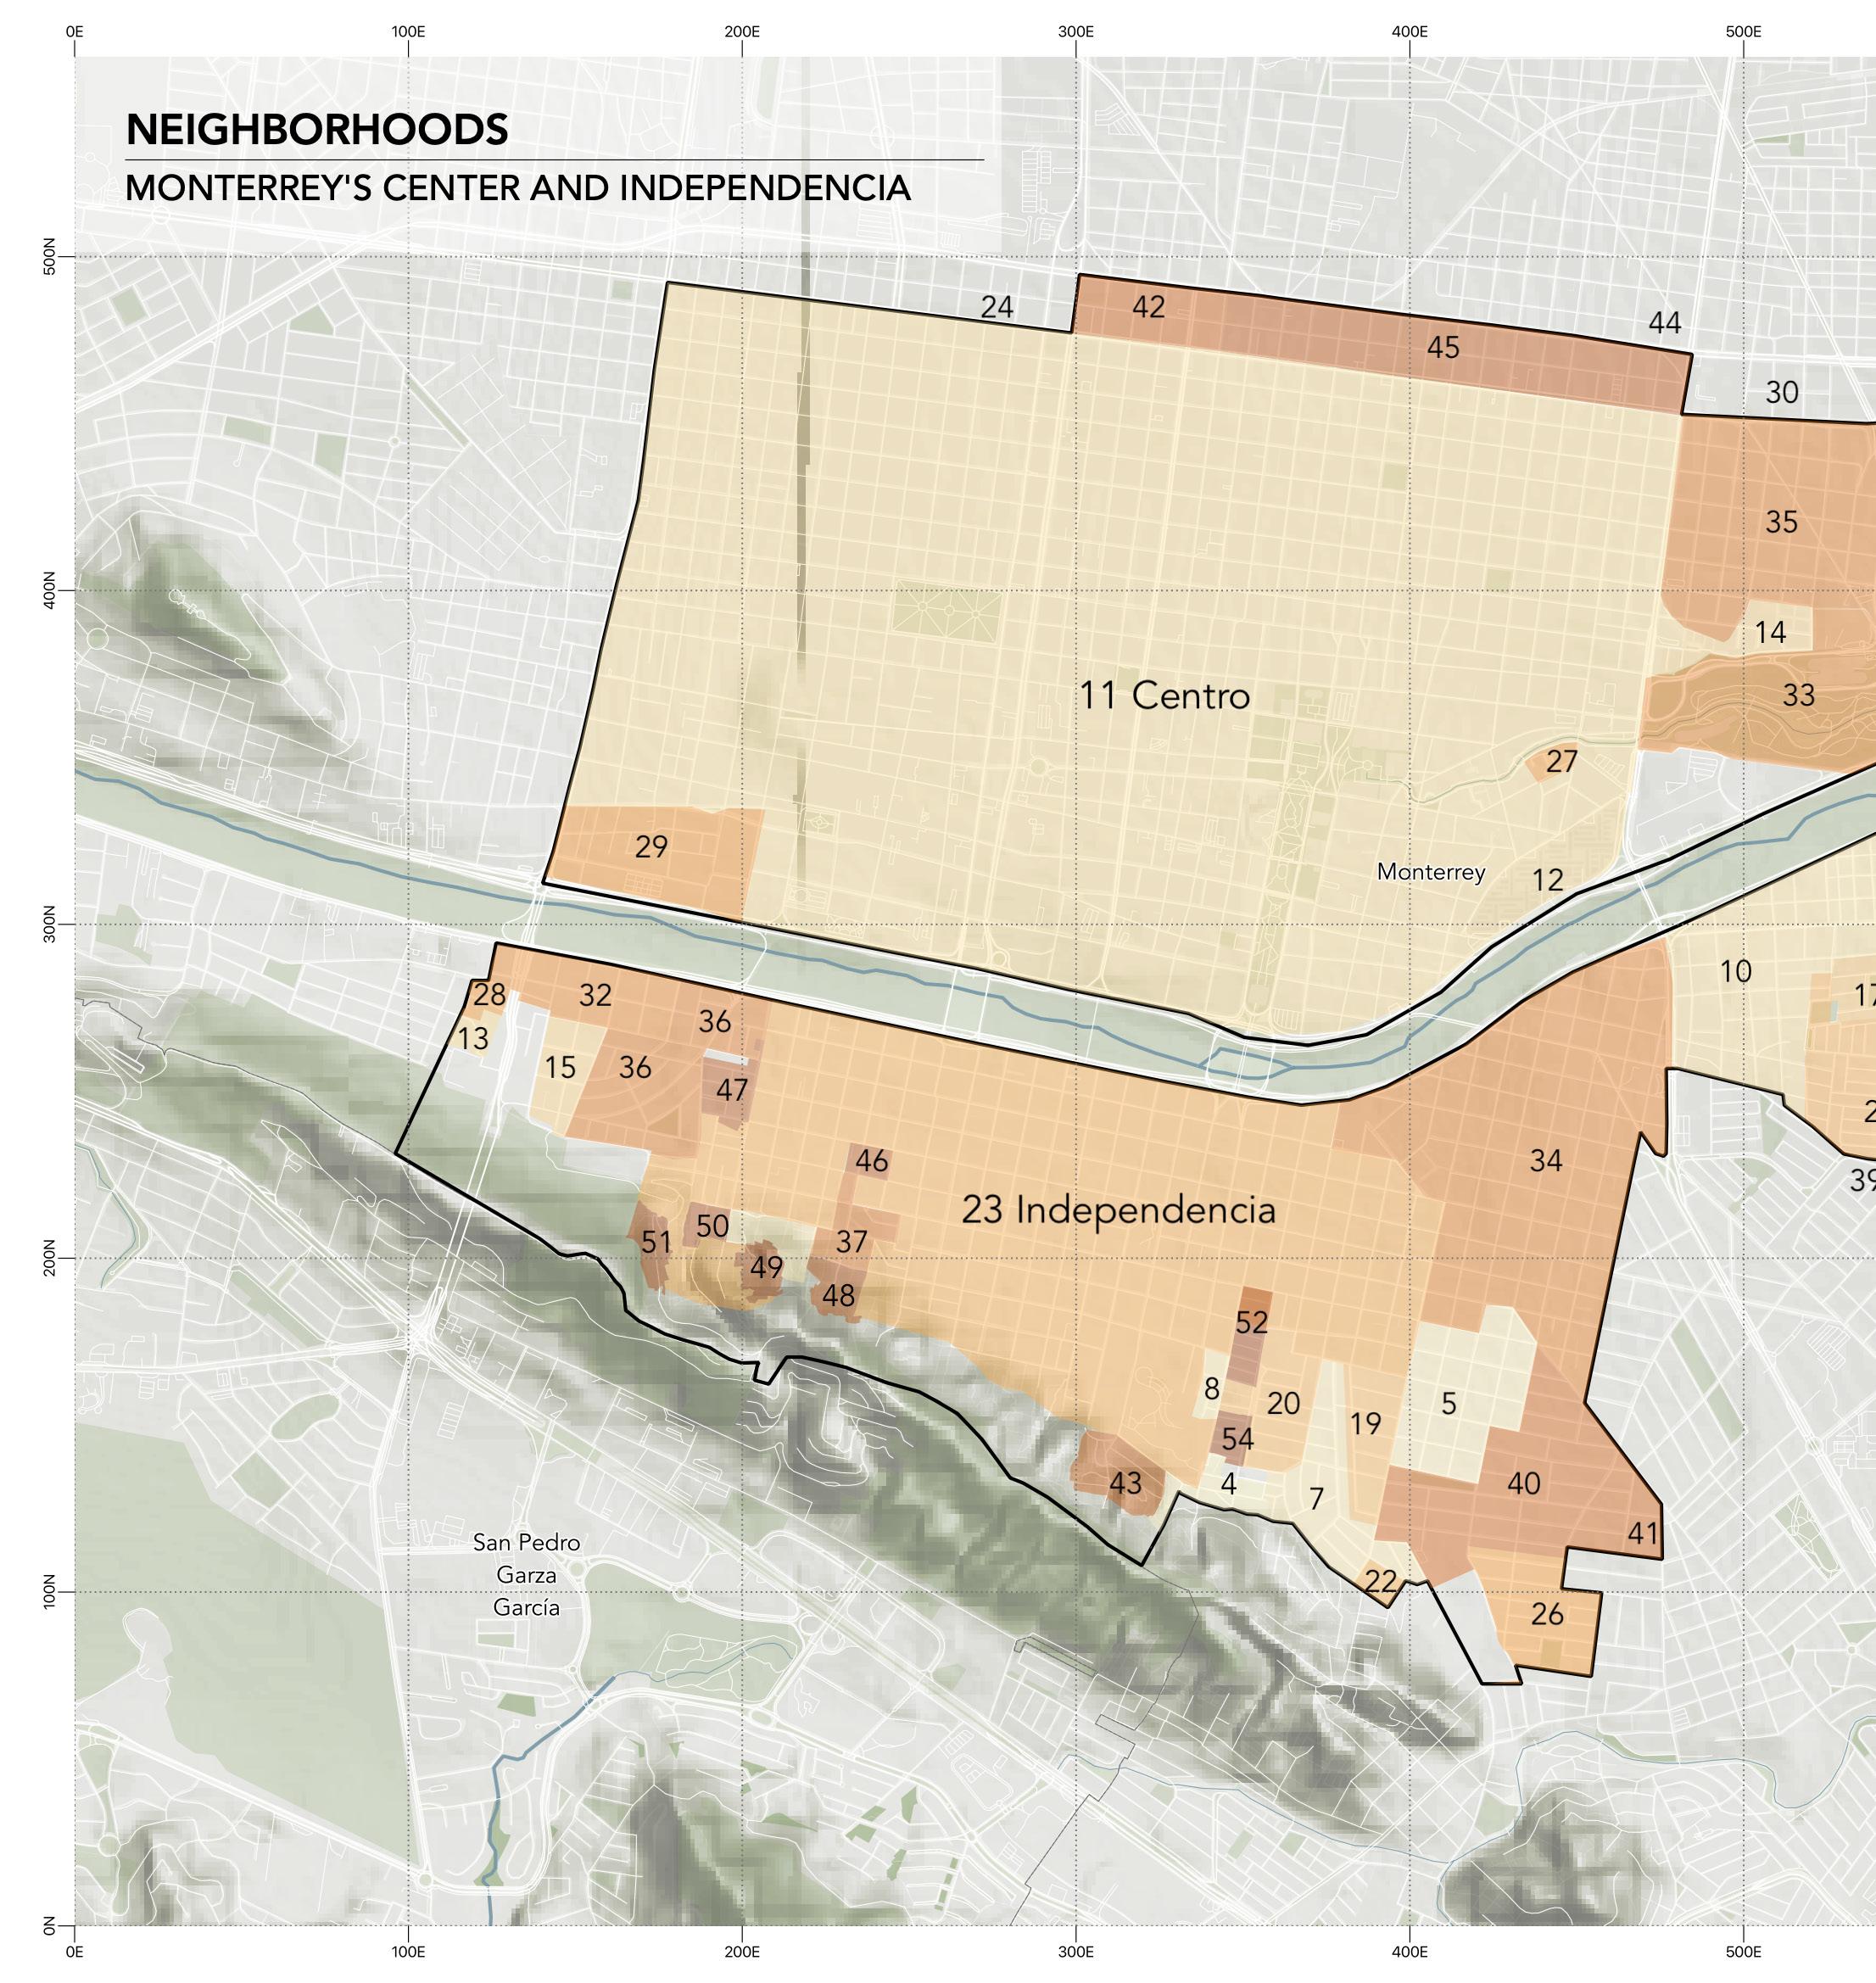
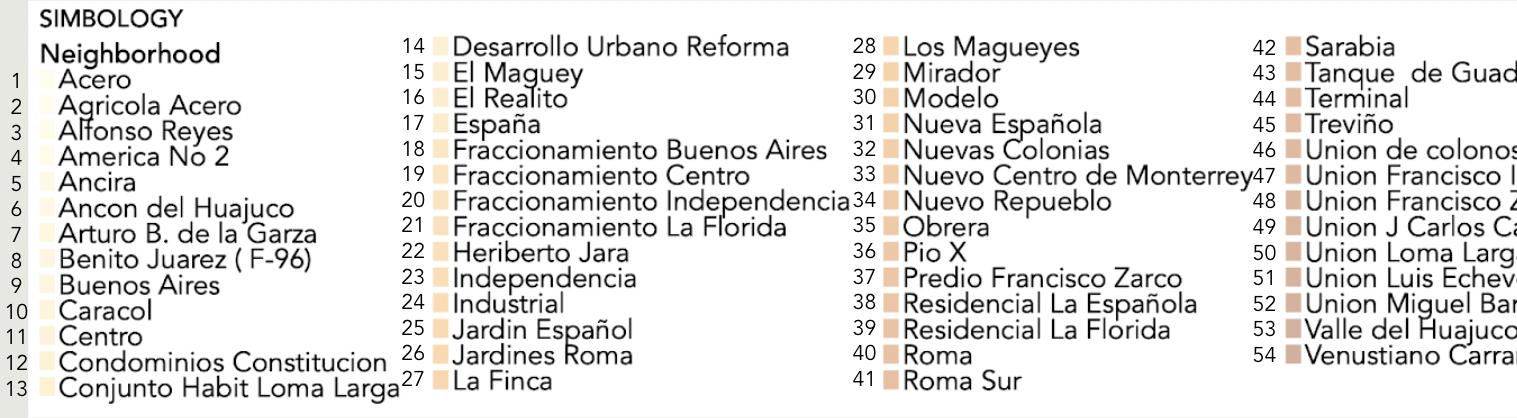
nEIGHBORHOOD LIMITS
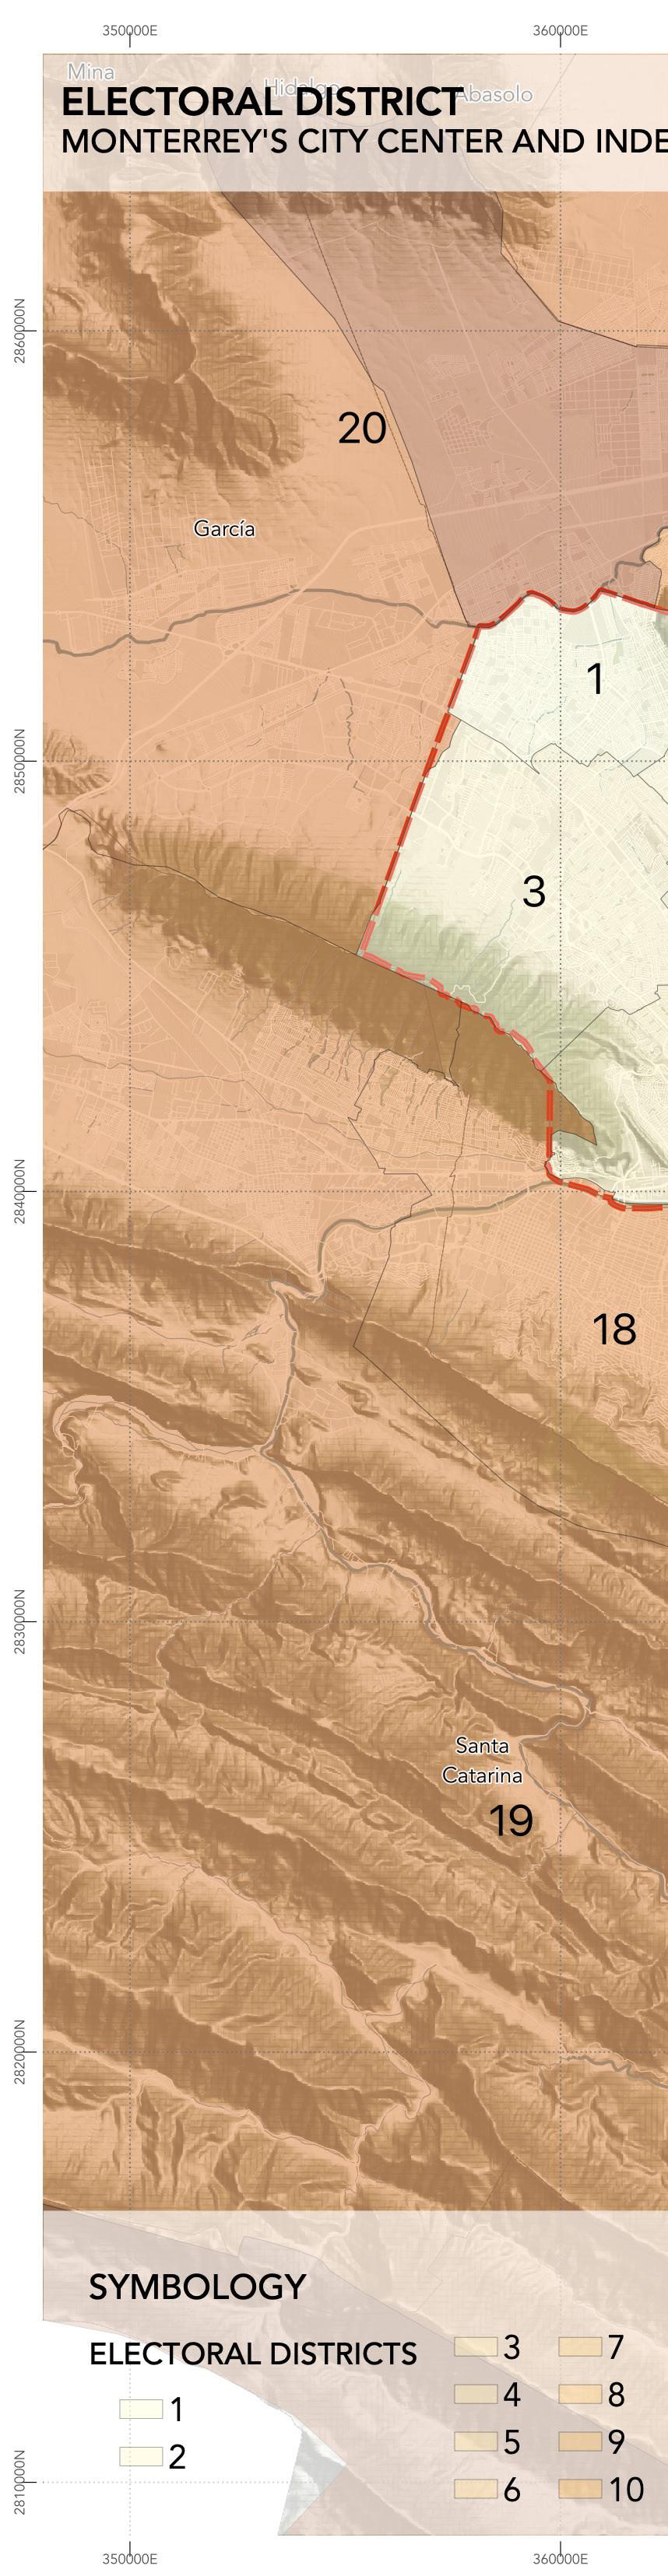
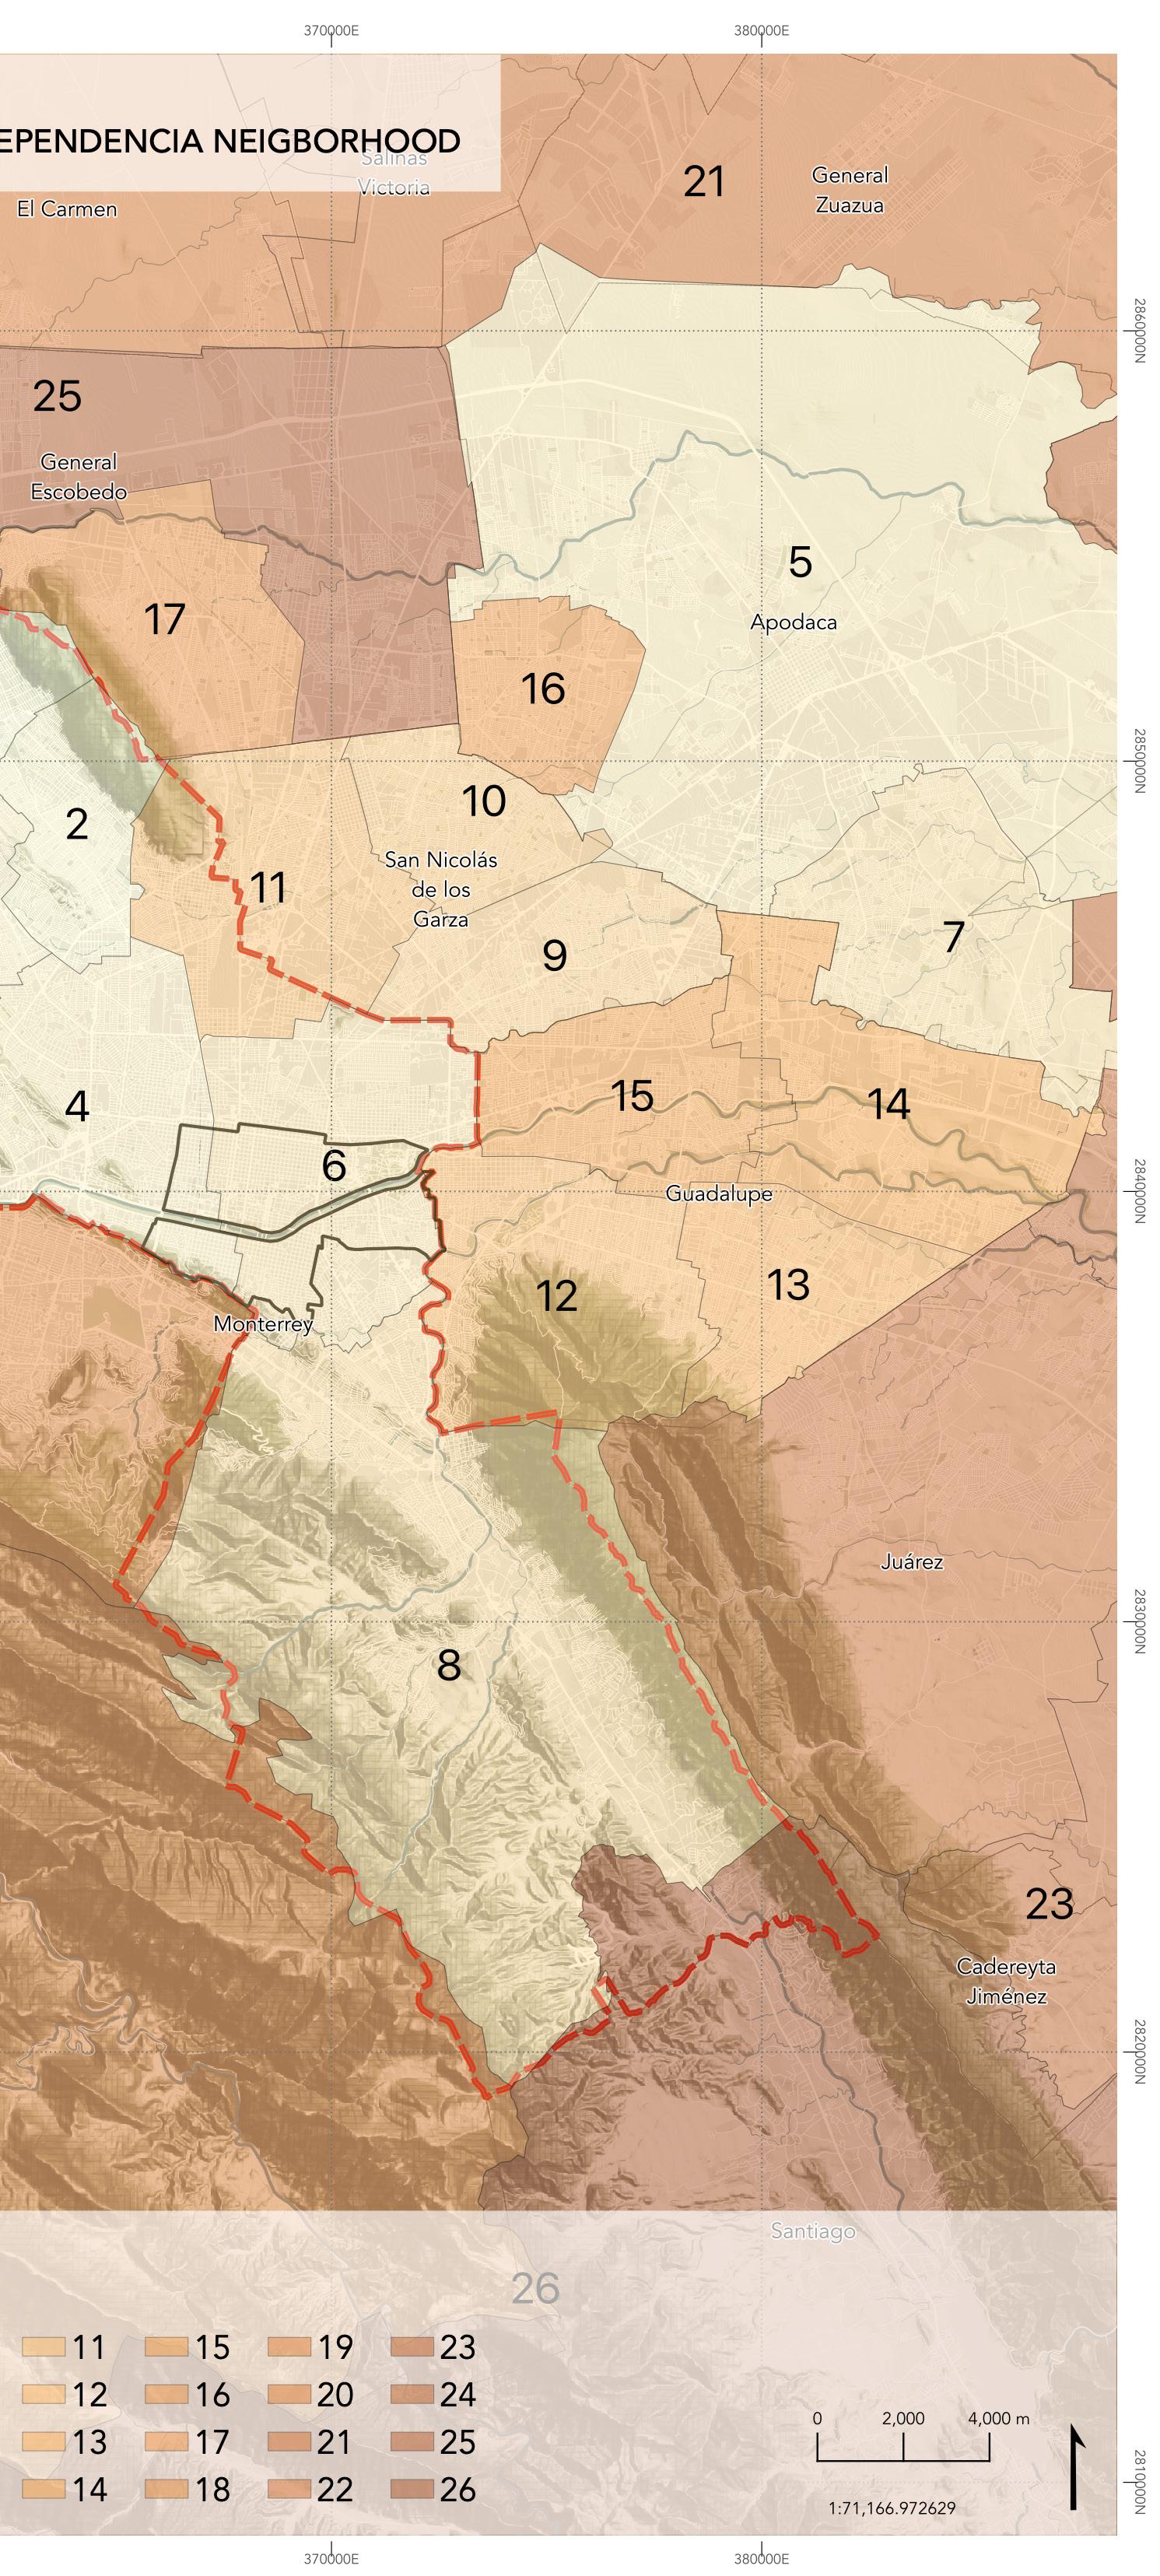
The study zone contemplates 56 neighborhoods, still, the Centro neighborhood distinguishes itself because of its extension with 668 ha, in a contrast with the second biggest which is the Independencia neighborhood with 217 ha, more than 3 times its territorial extension. Even though this is a kind of delimitation, there are also other kinds of separation, for example, political by the electoral federal districts (see maps 1 through 4 on the next page) whose purpose is mainly for the elections, urban by AGEBS (map 2) which is the basic geostatistical area and postal codes (map 3), this is and were used mainly for the facilitation of deliveries.
All of these divisions, even though they are spatial, social, political, and urban limits, make the process of social integration and a sense of community more difficult to accomplish. In another view, it also makes it difficult to govern having so many different social, political, urban, etc. divisions.
With the division of Neighborhoods in North and South of the river, some differences are historical starting with their development; while the North is formed with the intention of the foundation of Monterrey and is now the center of the city with a high concentration of services, economic activity, a historic and cultural identity an extent offer of public transport and constant interventions by the government and different organizations for making it visible, Independencia had a fast development that occupies the hill of la Loma Larga and those settlements are mainly informal, generating lack of services and socially related fewer interventions by the government and associations, by the antecedent of crime and violence that they lived.
17
Cartographer:Paulina Ramirez Leal.
INEGI (2020)
“All of these divisions, even though they are spatial, social, political, urban limits, make the process of social integration and sense of community more difficult to accomplish.”
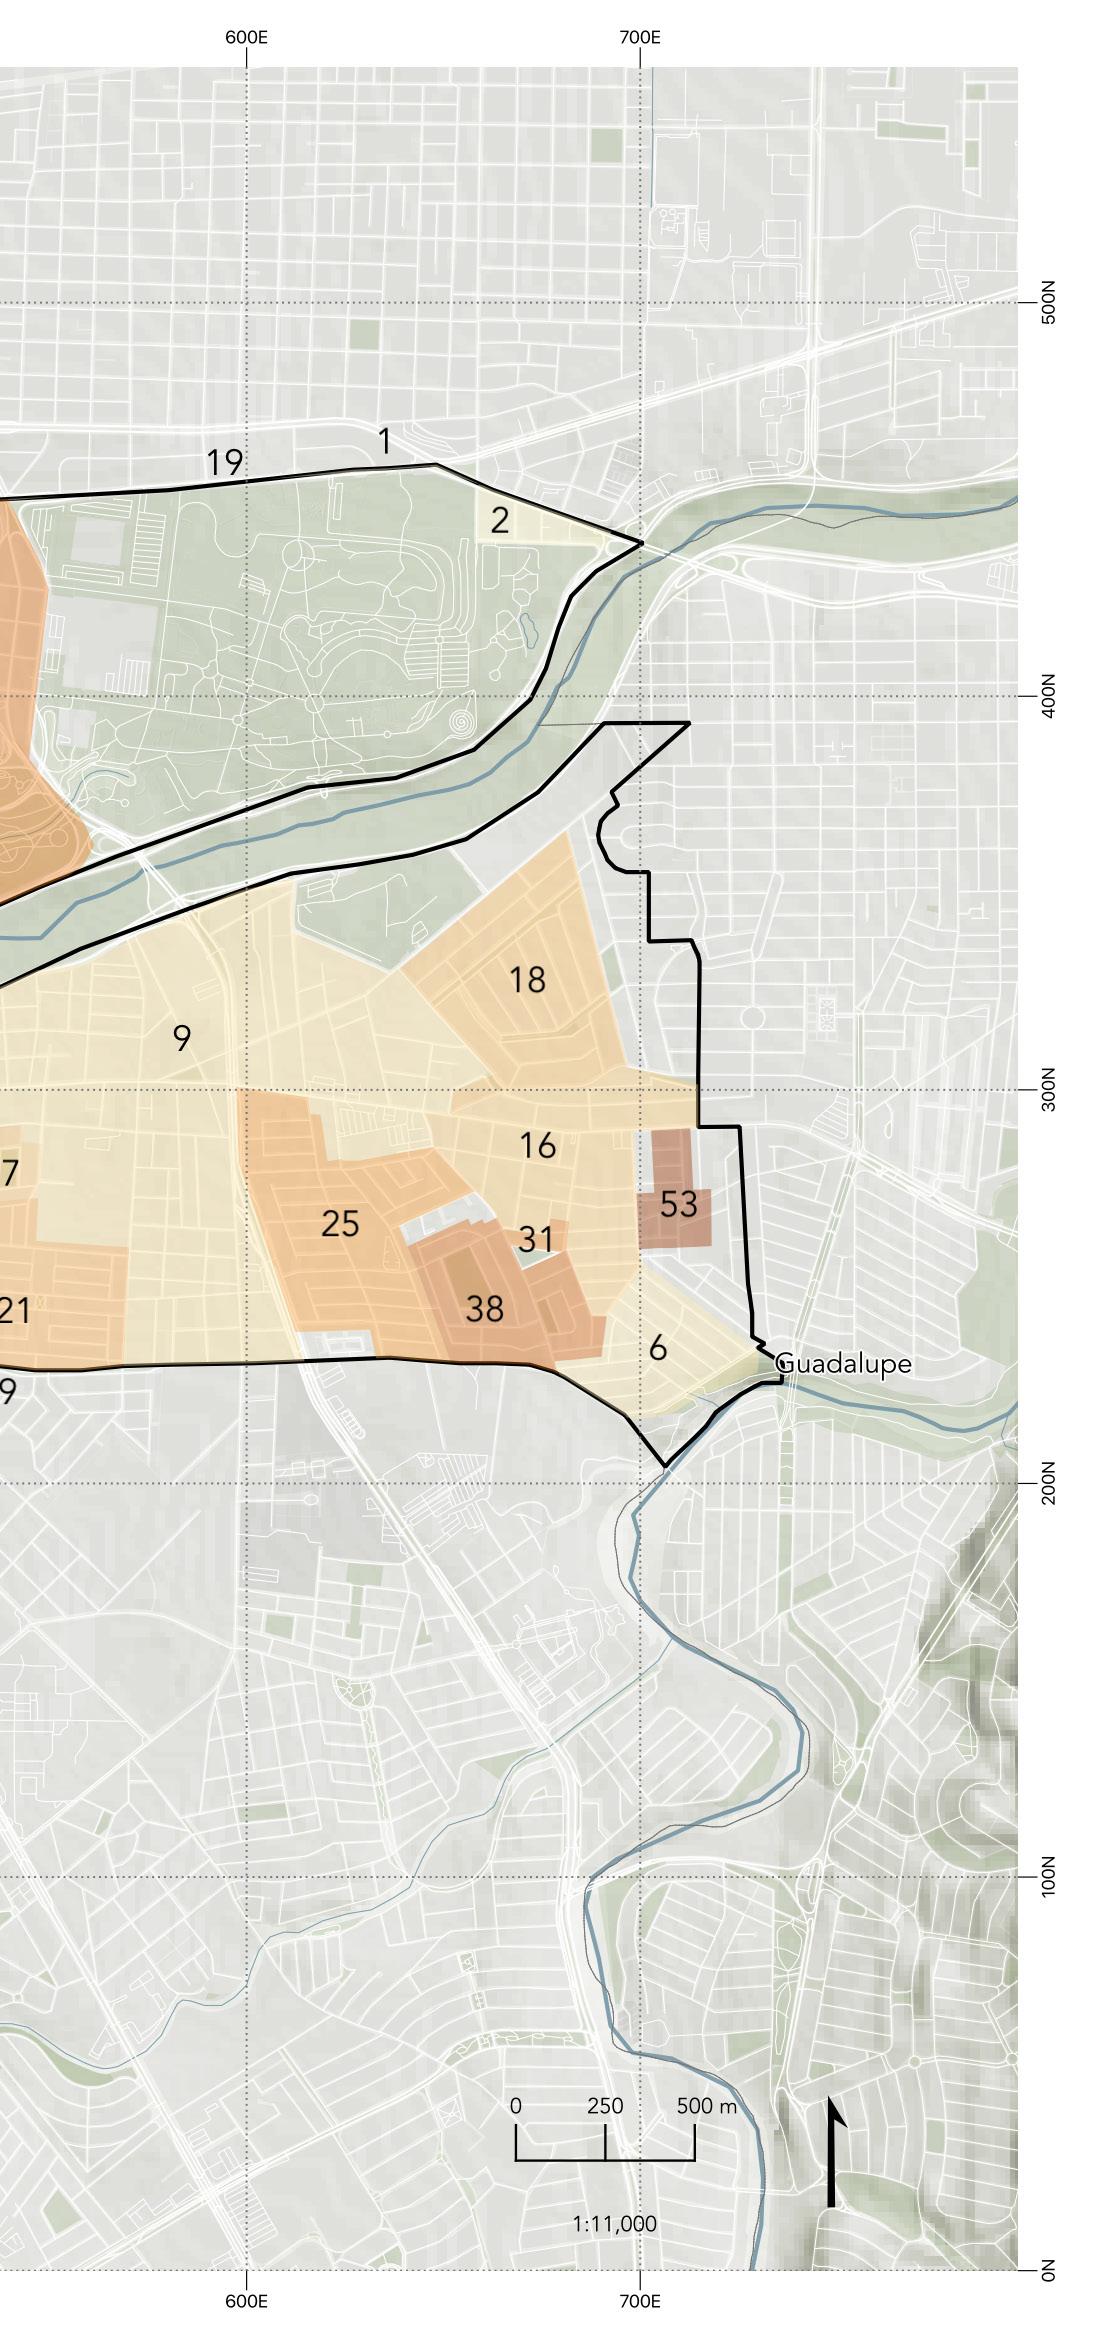
POLITICAL LIMITS
18
“The study zone is part of the Federal District 3 and 9, and Electoral District 4 and 6.”
Federal Districts
Cartographer:Paulina Ramirez Leal.
Source: INEGI (2020) CEENL (2020)
Electoral Districts
Cartographer:Paulina Ramirez Leal. Source: INEGI (2020) CEENL (2020)
In Mexico, there are 300 territorial units denominated Federal Districts and in Nuevo León, there are 12. The main purpose of these districts is mainly for the elections.
On the contrary, the electoral district is a territorial demarcation that resulted from the division of the state between the numbers of delegations of the relative majority indicated in the Political Constitution of each state. In Nuevo Leon, there are 26 electoral districts.
The study zone is part of Federal Districts 3 and 9, and Electoral Districts 4 and 6.
19
GEO-STATISTICAL LIMITS
20
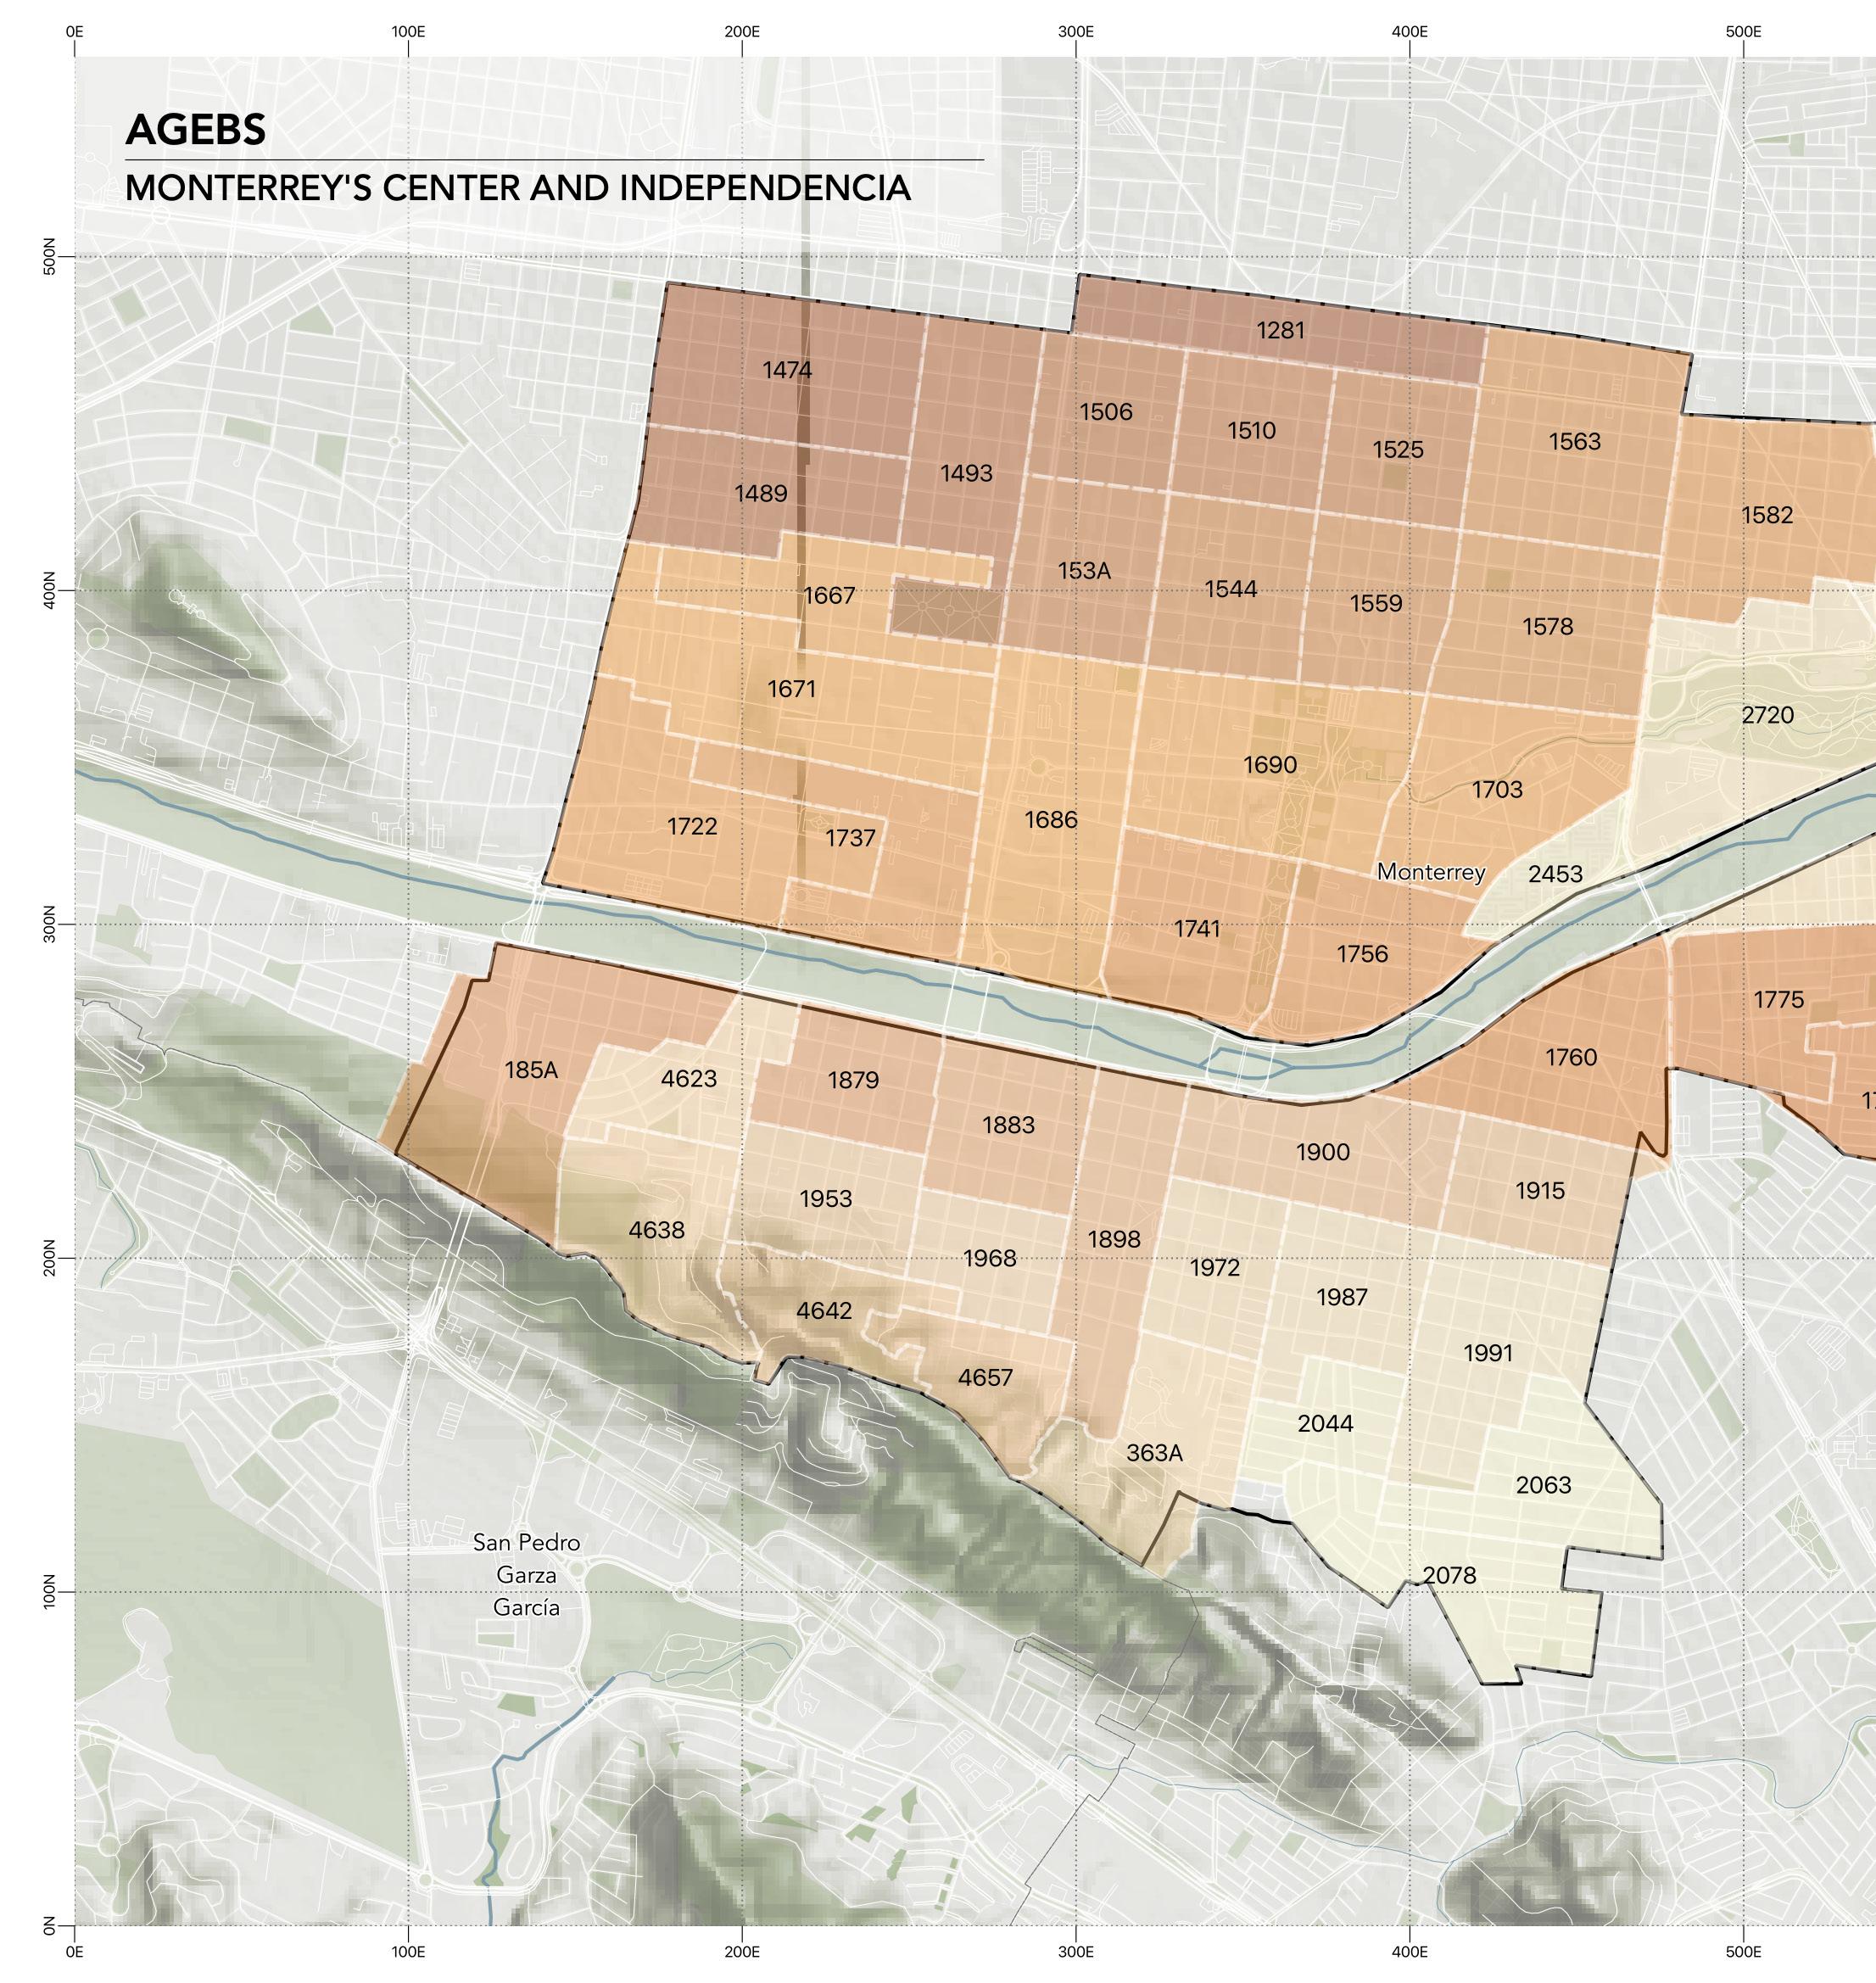
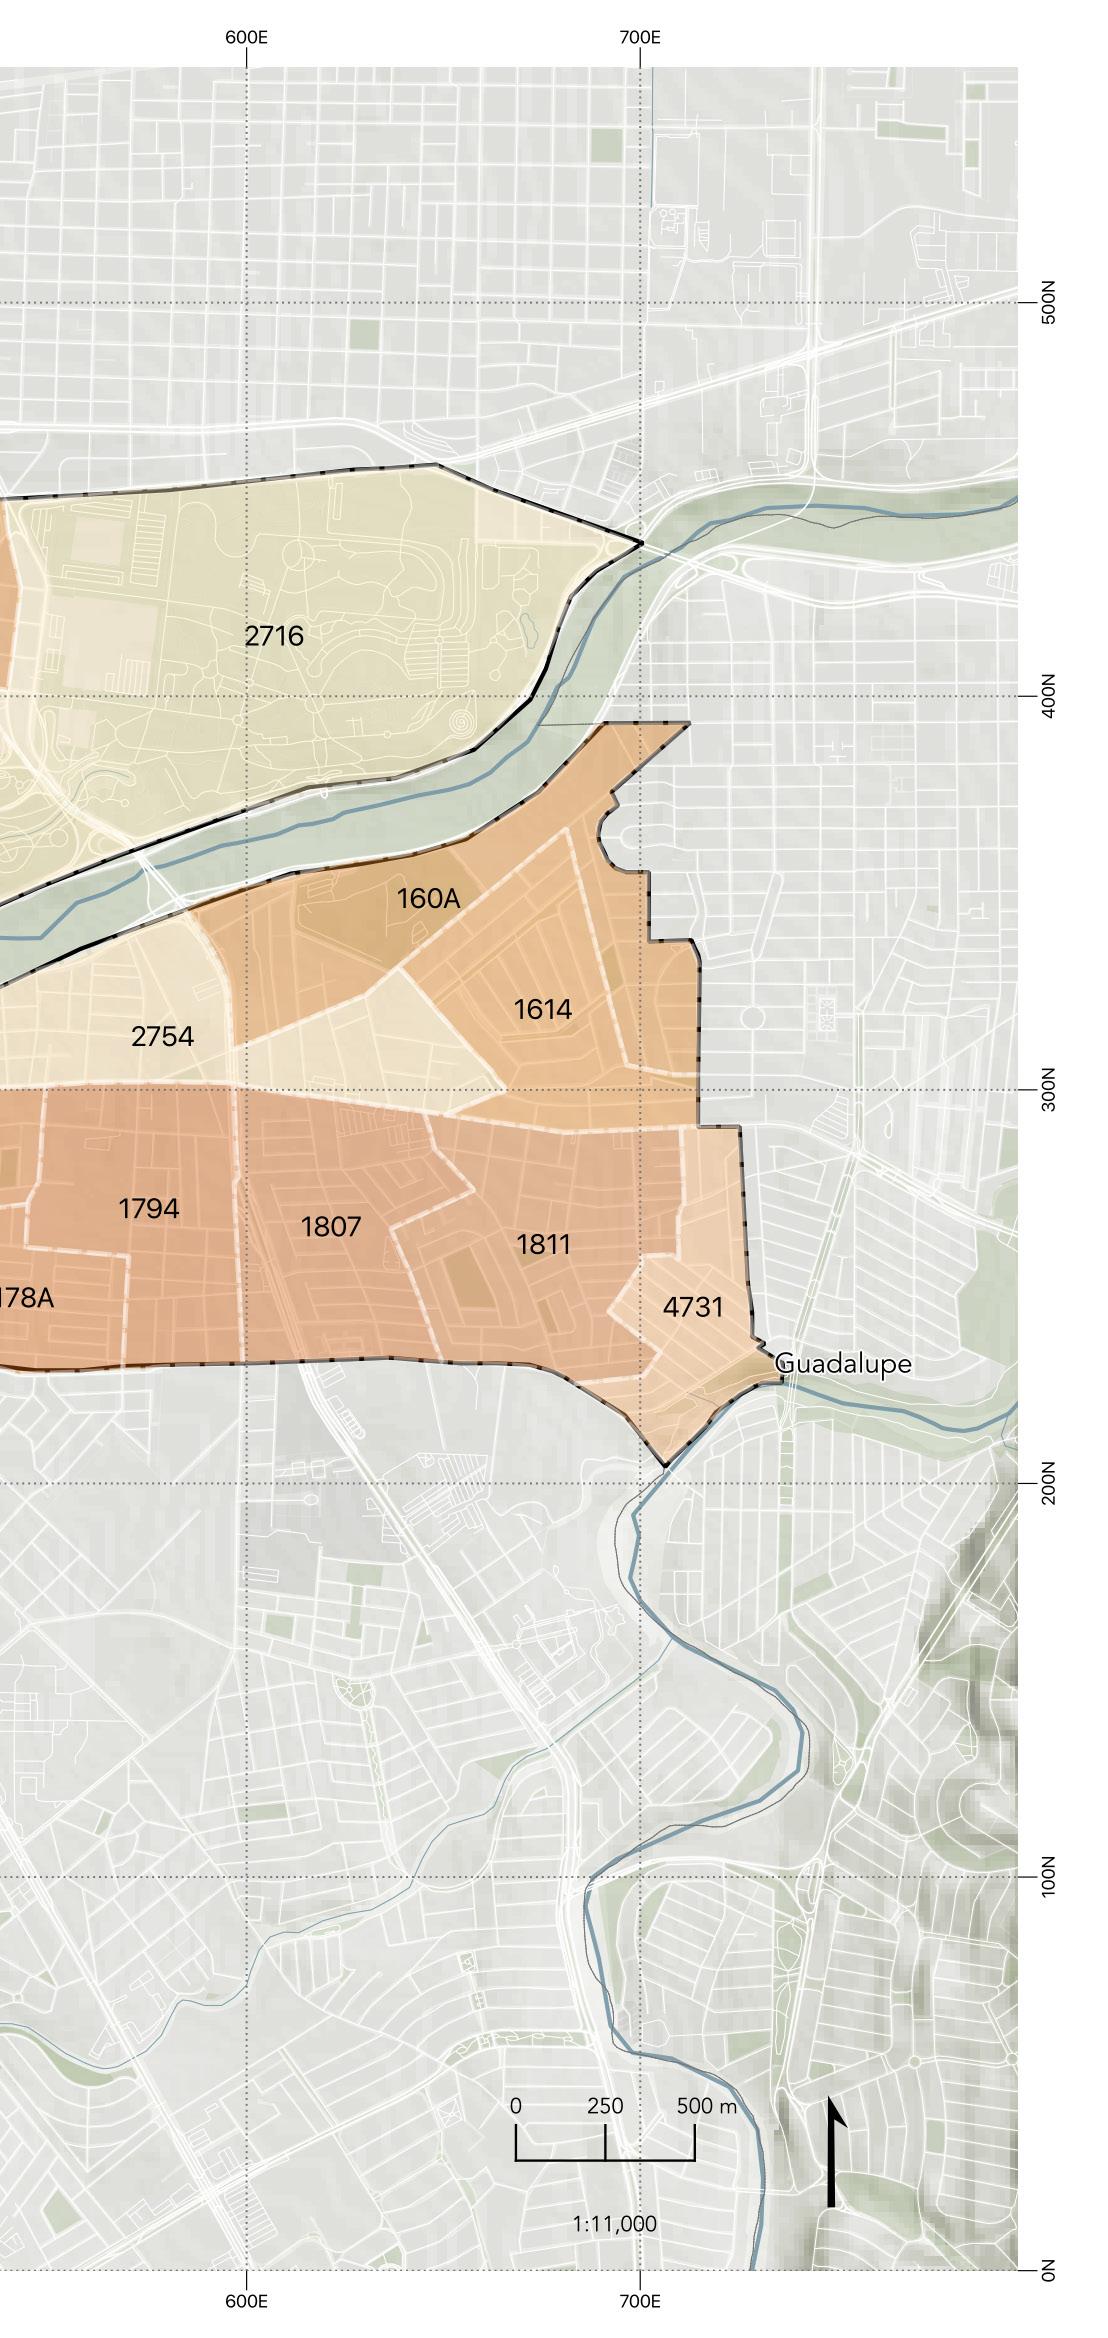
AGEBS
Cartographer:Paulina Ramirez Leal.
Source: INEGI (2020) CEENL (2020)
AGEBS is the acronym for Áreas Geoestadísticas Básicas Urbanas or basic geo-statistical urban areas. This is a classification of a geographical area by blocks, these can range from 1 to 50. These are mainly used for the identification of geographical data.
21
OTHER LIMITS
“In Mexico there are 32,258 postal codes. In the study zone 23 postal codes were identificated.”
22
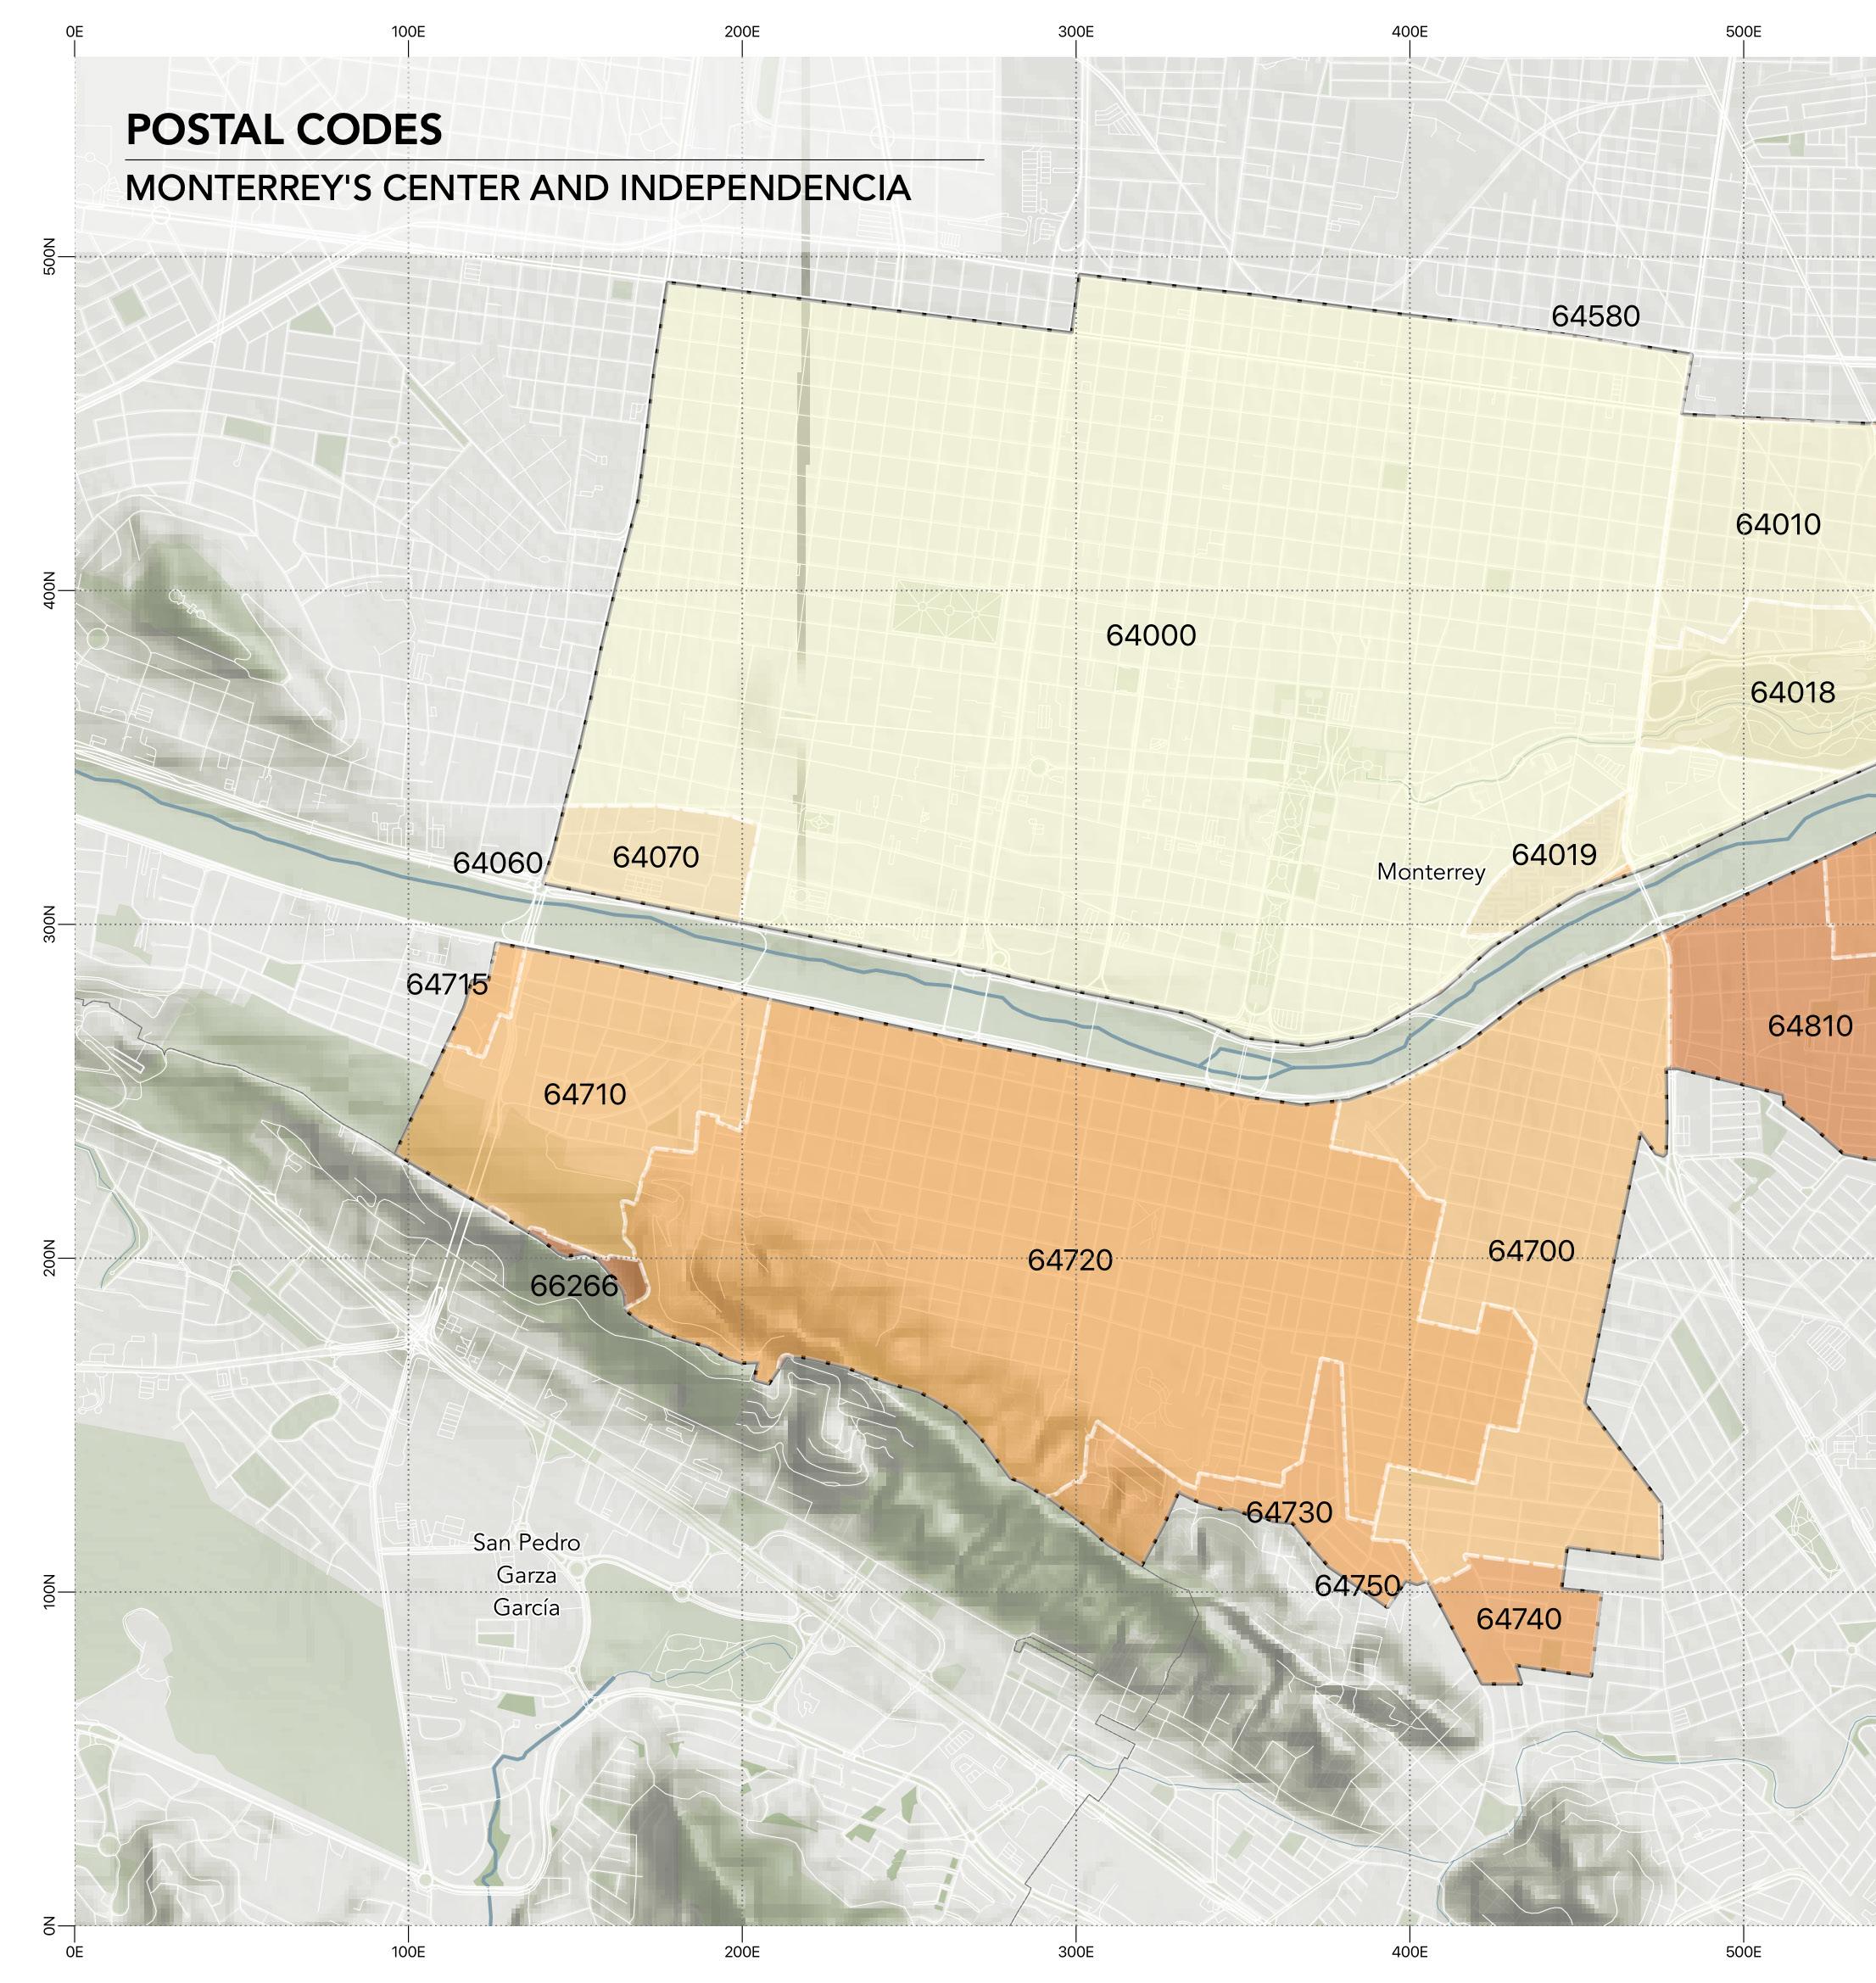
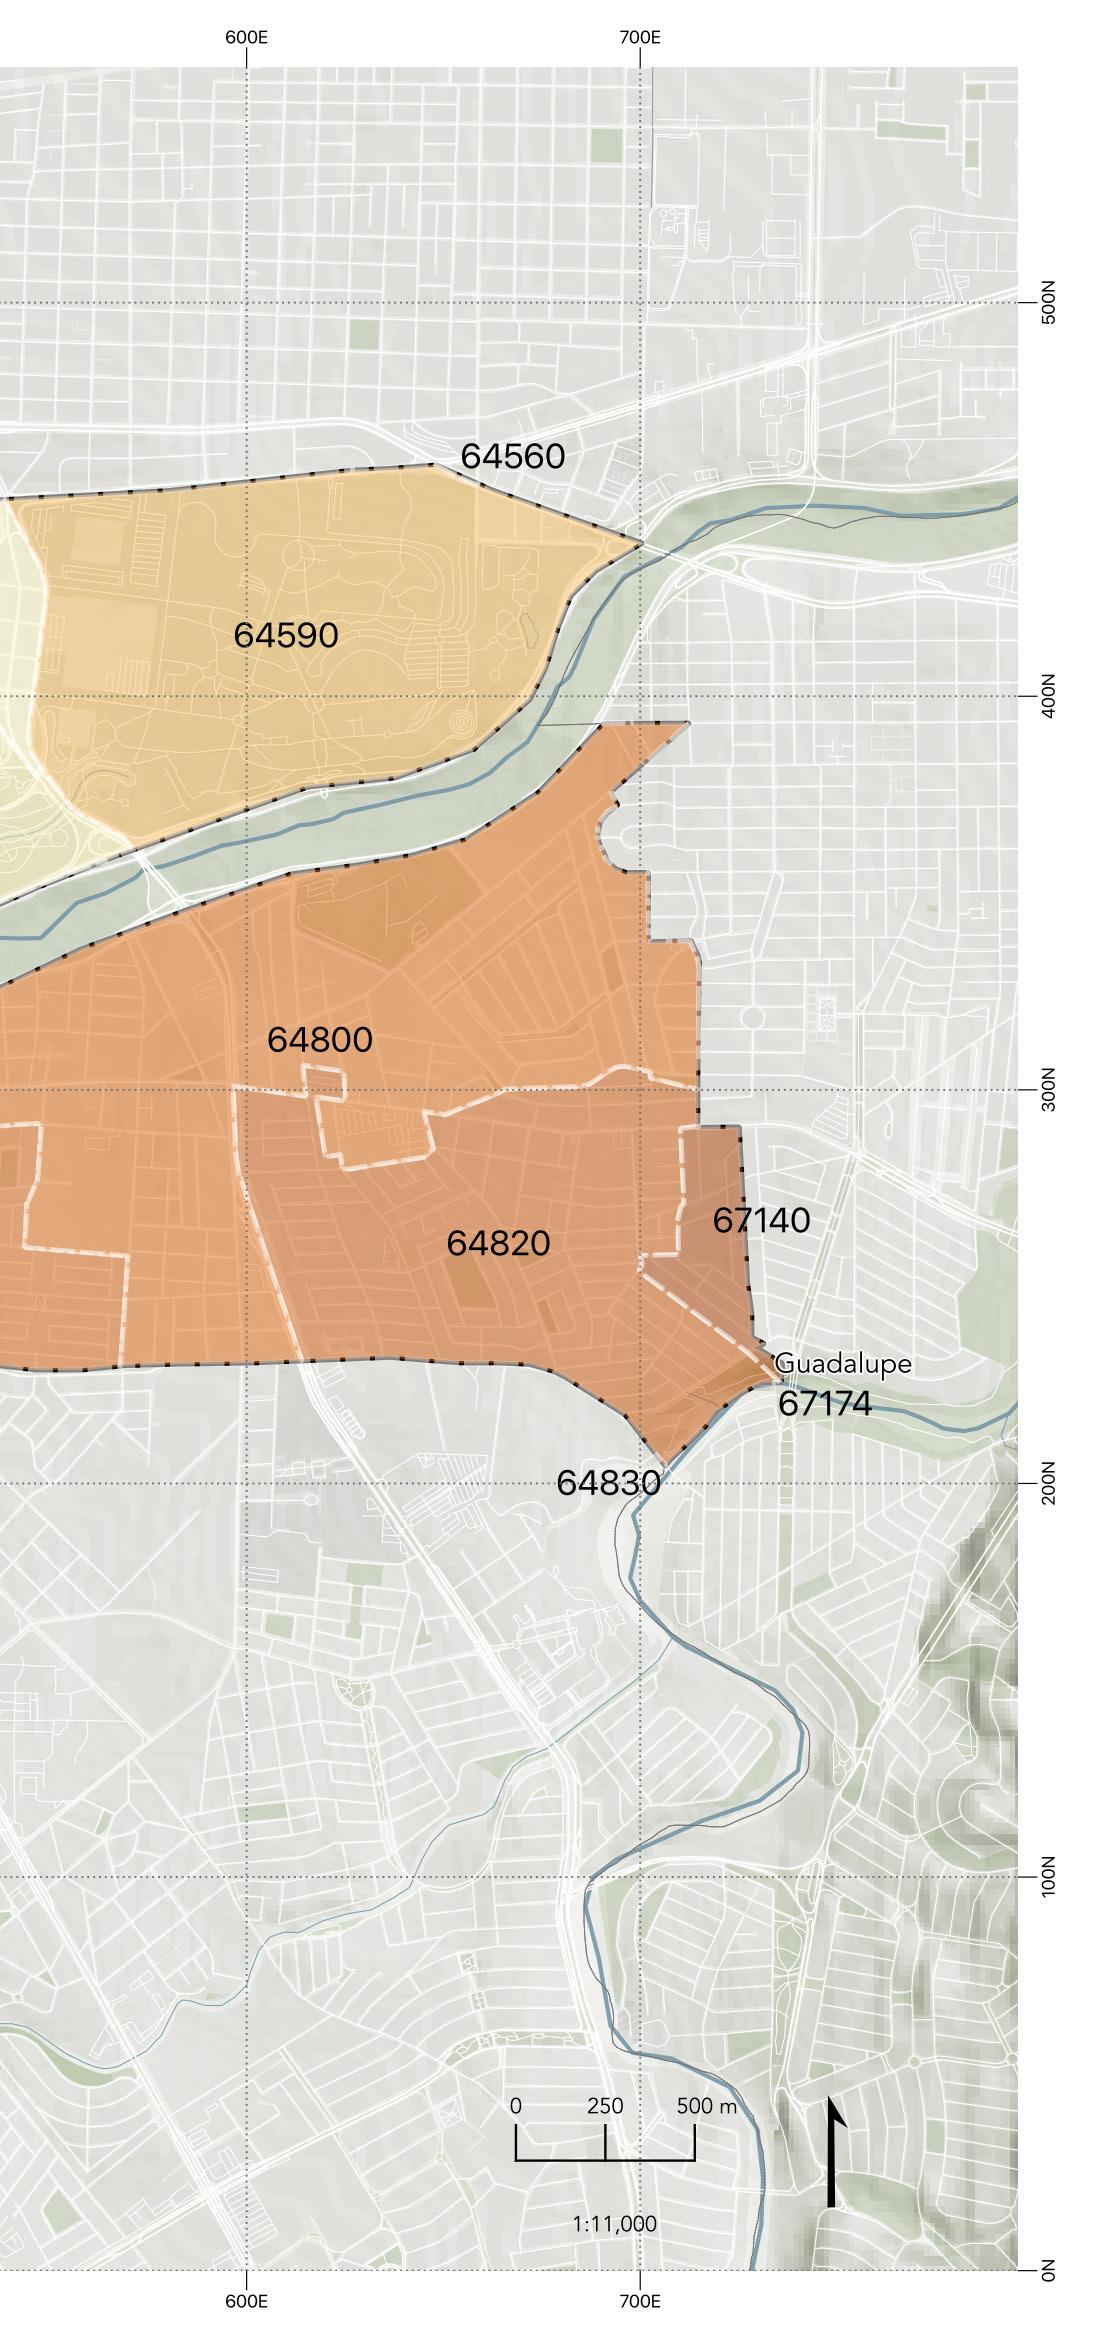
Postal Codes
Cartographer:Paulina Ramirez Leal.
Source: INEGI (2020) CEENL (2020)
Postal Codes are another kind of intangible limit in an area, it was mainly created for facilitating deliveries and easily locating addresses. In Mexico, there are 32,258 postal codes.
In the study zone, 23 postal codes were identified. The one with the biggest extension is 64000, which contributes to the city center mainly, and the second one is 64720 which mainly stands for the Independencia neighborhood.
There can be a lot of similarities between the geographical division of postal codes and neighborhoods found in the study zone.
23
OBJECTIVE OF DOCUMENT
Presenting the results of a diagnosis of the zone in different topics that are part of the Rapid Resilience Review has the objective to illustrate the actual conditions of the site in terms of resilience and conclude in each one with the elements that can or be in risk.
The objective of this investigation is determine strategies to develop a masterplan to increase resilience, the capacity to cope and take action in case of a hazard event, that, as we read, the climate change can make those hazards occur more often.
24
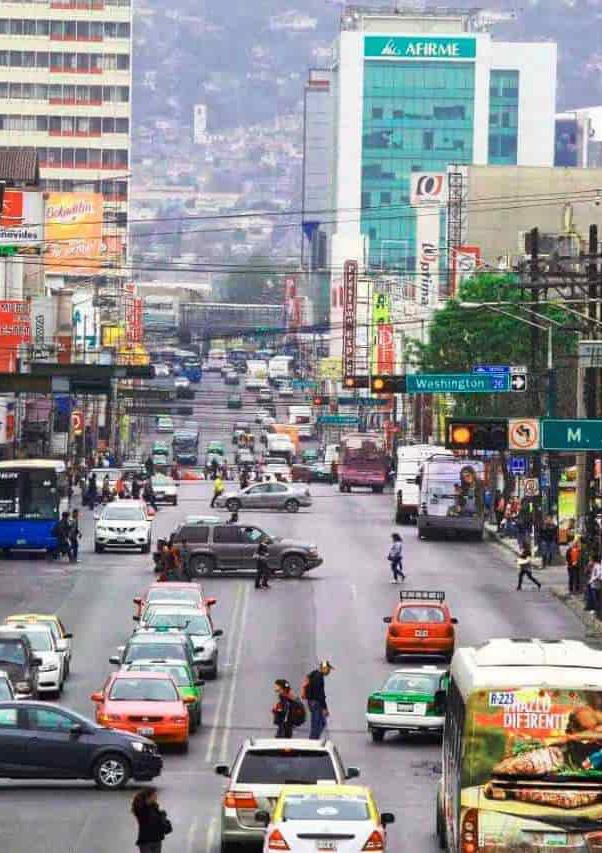
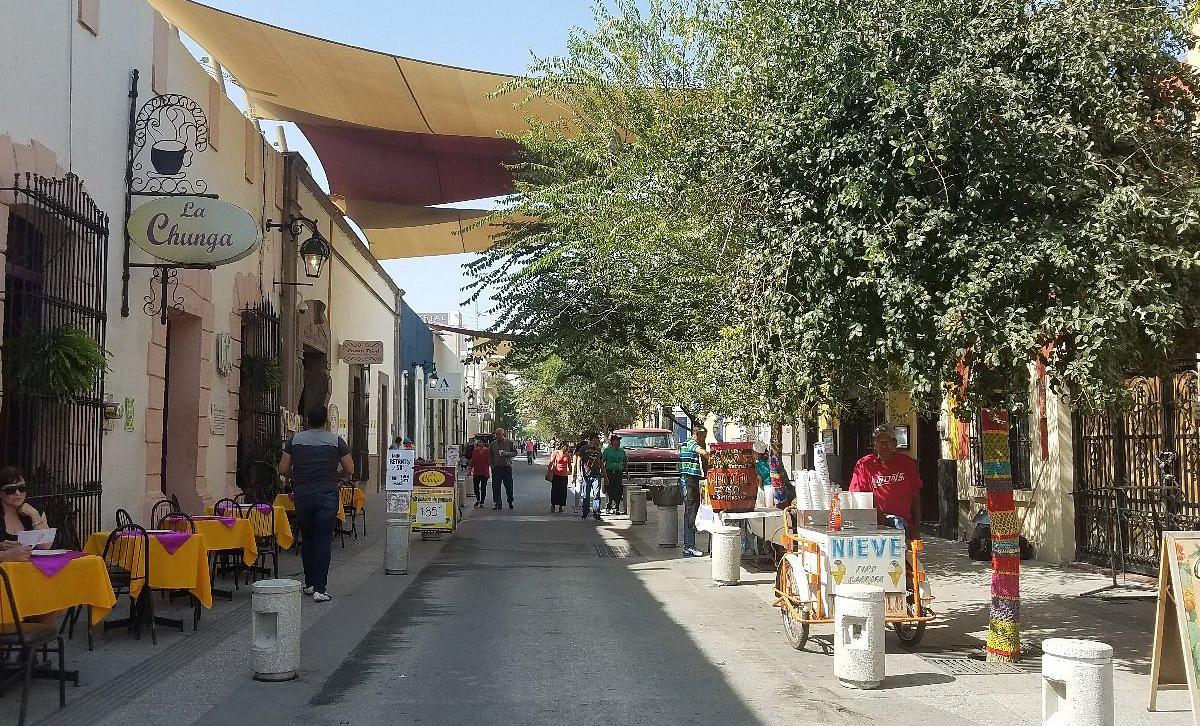
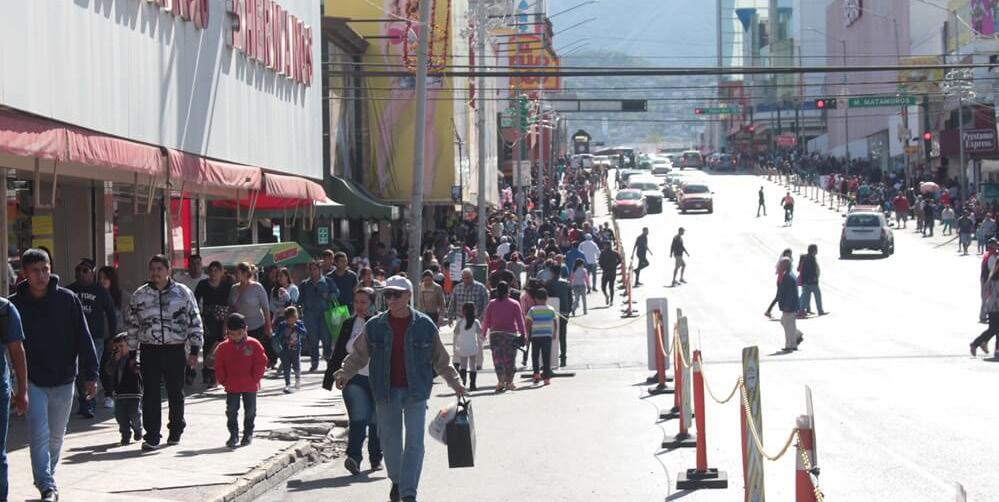
Right: Av. Benito Juarez. Source: Enfoque Monterrey
25
26
27 SECTION 02: DIAGNOSIS
Historical Context
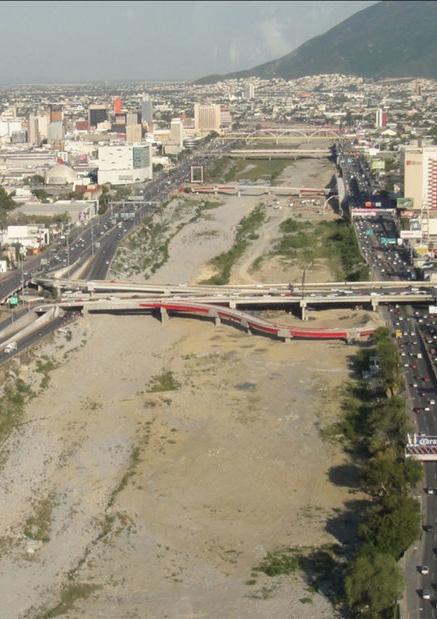
“...there are two key pieces to the shape that said city center has today: the canalization of Río Santa Catarina in 1950 and the replacement of some of the oldest edifications in the city with Macroplaza in 1982.”
28
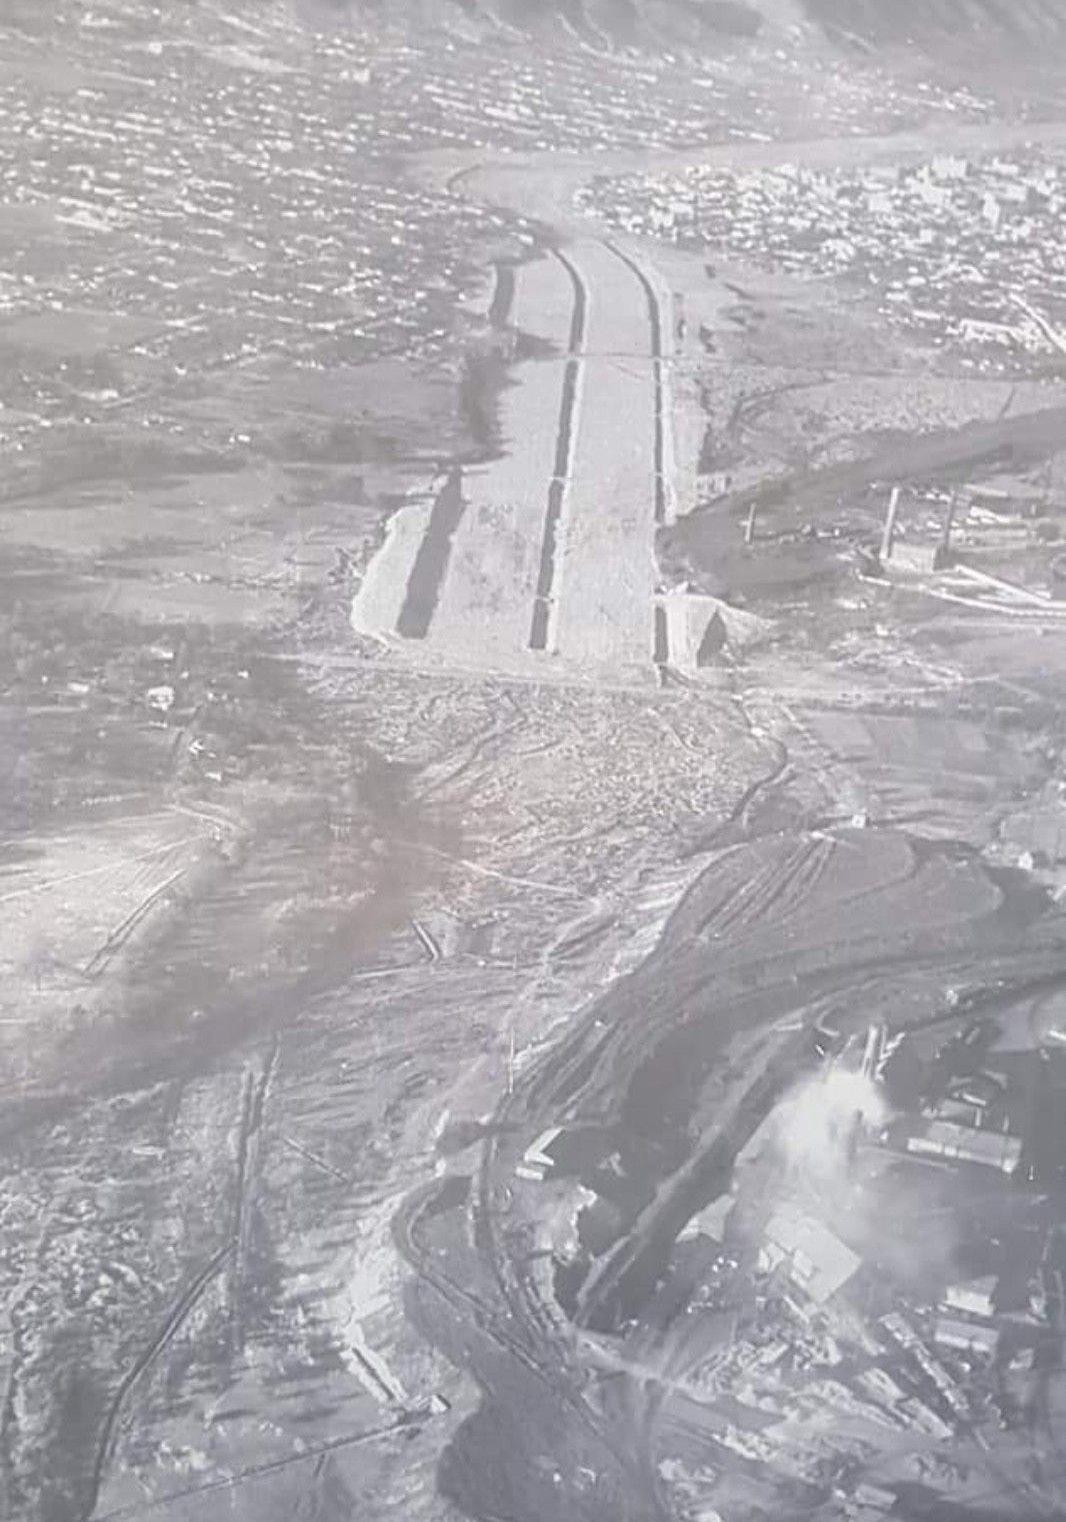
Left:Canalization work in Río Santa Catarina, 1938.
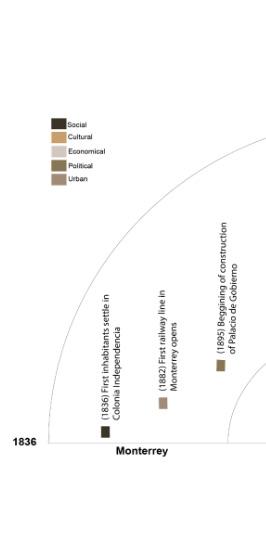
The emergence and growth of the city center of Monterrey represents the beginning of the urban and industrial society in the city. As seen in the map of Monterrey from the year 1769, which is the first recorded map of the city, the first edifications and composition of urban layout were located in the north of Río Santa Catarina; and as seen in the map of Monterrey from 1894, which presents a more structured and organized urban layout, the other inhabitants whose settlement precedes the XIX century were located in what is now Colonia Independencia. After this period, in 1895, it’s important to acknowledge the construction of Palacio de Gobierno between city centre and Colonia Independencia as a catalyst for more people moving into the city; this catalyzation will be continued by the foundation of Fundidora de Fierro y Acero de Monterrey and therefore the beginning of Monterrey as an industrial city.
Regarding the modern context of the city center of Monterrey, there are two key pieces to the shape that said city center has today: the canalization of Río Santa Catarina in 1950 and the replacement of some of the oldest edifications in the city with Macroplaza in 1982.
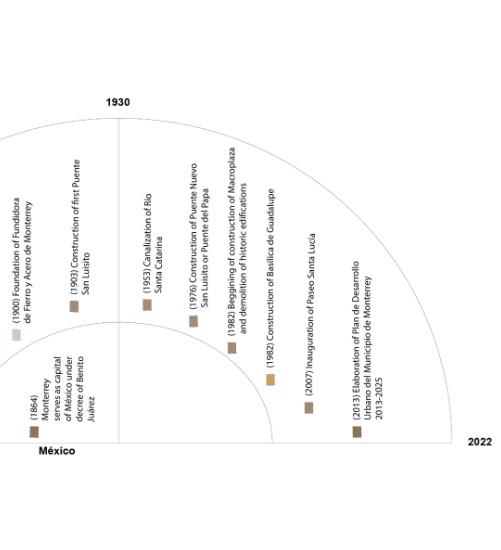 Historical context timeline
Elaborated by Fernando Rodríguez
Historical context timeline
Elaborated by Fernando Rodríguez
29
30
Infrastructure and Environment
Infrastructure is those works that give functionality and aesthetic support to cities, that seek to satisfy the needs and functions of the community, and are a fundamental part of the resilience of cities.
According to the City Resilience Framework of The Rockefeller Foundation and ARUP, the infrastructure dimension is responsible for reducing the exposure and vulnerability of cities to hazards and risks that may occur naturally or artificially. In addition, they provide the necessary tools for the use and efficiency of types of transportation and information and communication technologies for the work performance of the inhabitants and better social coexistence.
It is important to mention that without effective maintenance of urban infrastructure, cities cannot be resilient, since it would not be a long-term, robust, and flexible infrastructure management in the face of any condition.
For this project, we will focus our analysis on 2 sections, natural and physical infrastructure and environment. For the natural environment, categories such as topography, hydrology, vegetation, and climate. For the physical built environment, analyze categories such as housing, urban image, information and communication technology, road structure, mobility, and zoning.
31
Vegetation

32
“...Independencia neighborhood has a greater number of green lines that represent the availability of trees and palm trees.”
Elaborated by Luis Moniet with information from INEGI (2021)
As we can see on the map, compared to the green areas and parks in the polygon, Independencia neighborhood has a greater number of green lines that represent the availability of trees and palm trees. This shows us that having trees and palms is not synonymous with having green areas or parks and that there must be a balance that allows people to have accessibility to green areas and vegetation that allows them to have an enjoyable walk on the sidewalks and help with air quality and thermal sensation.
33
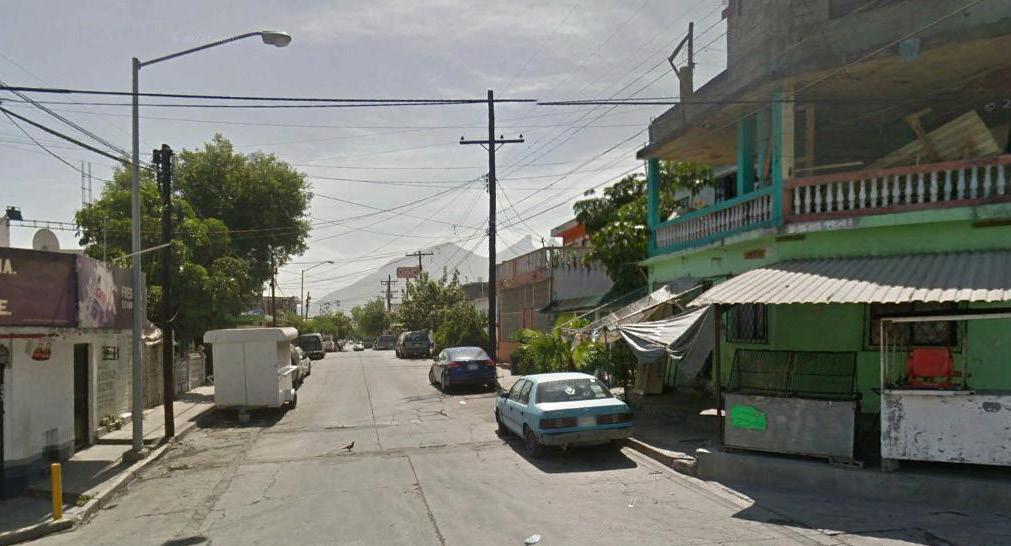
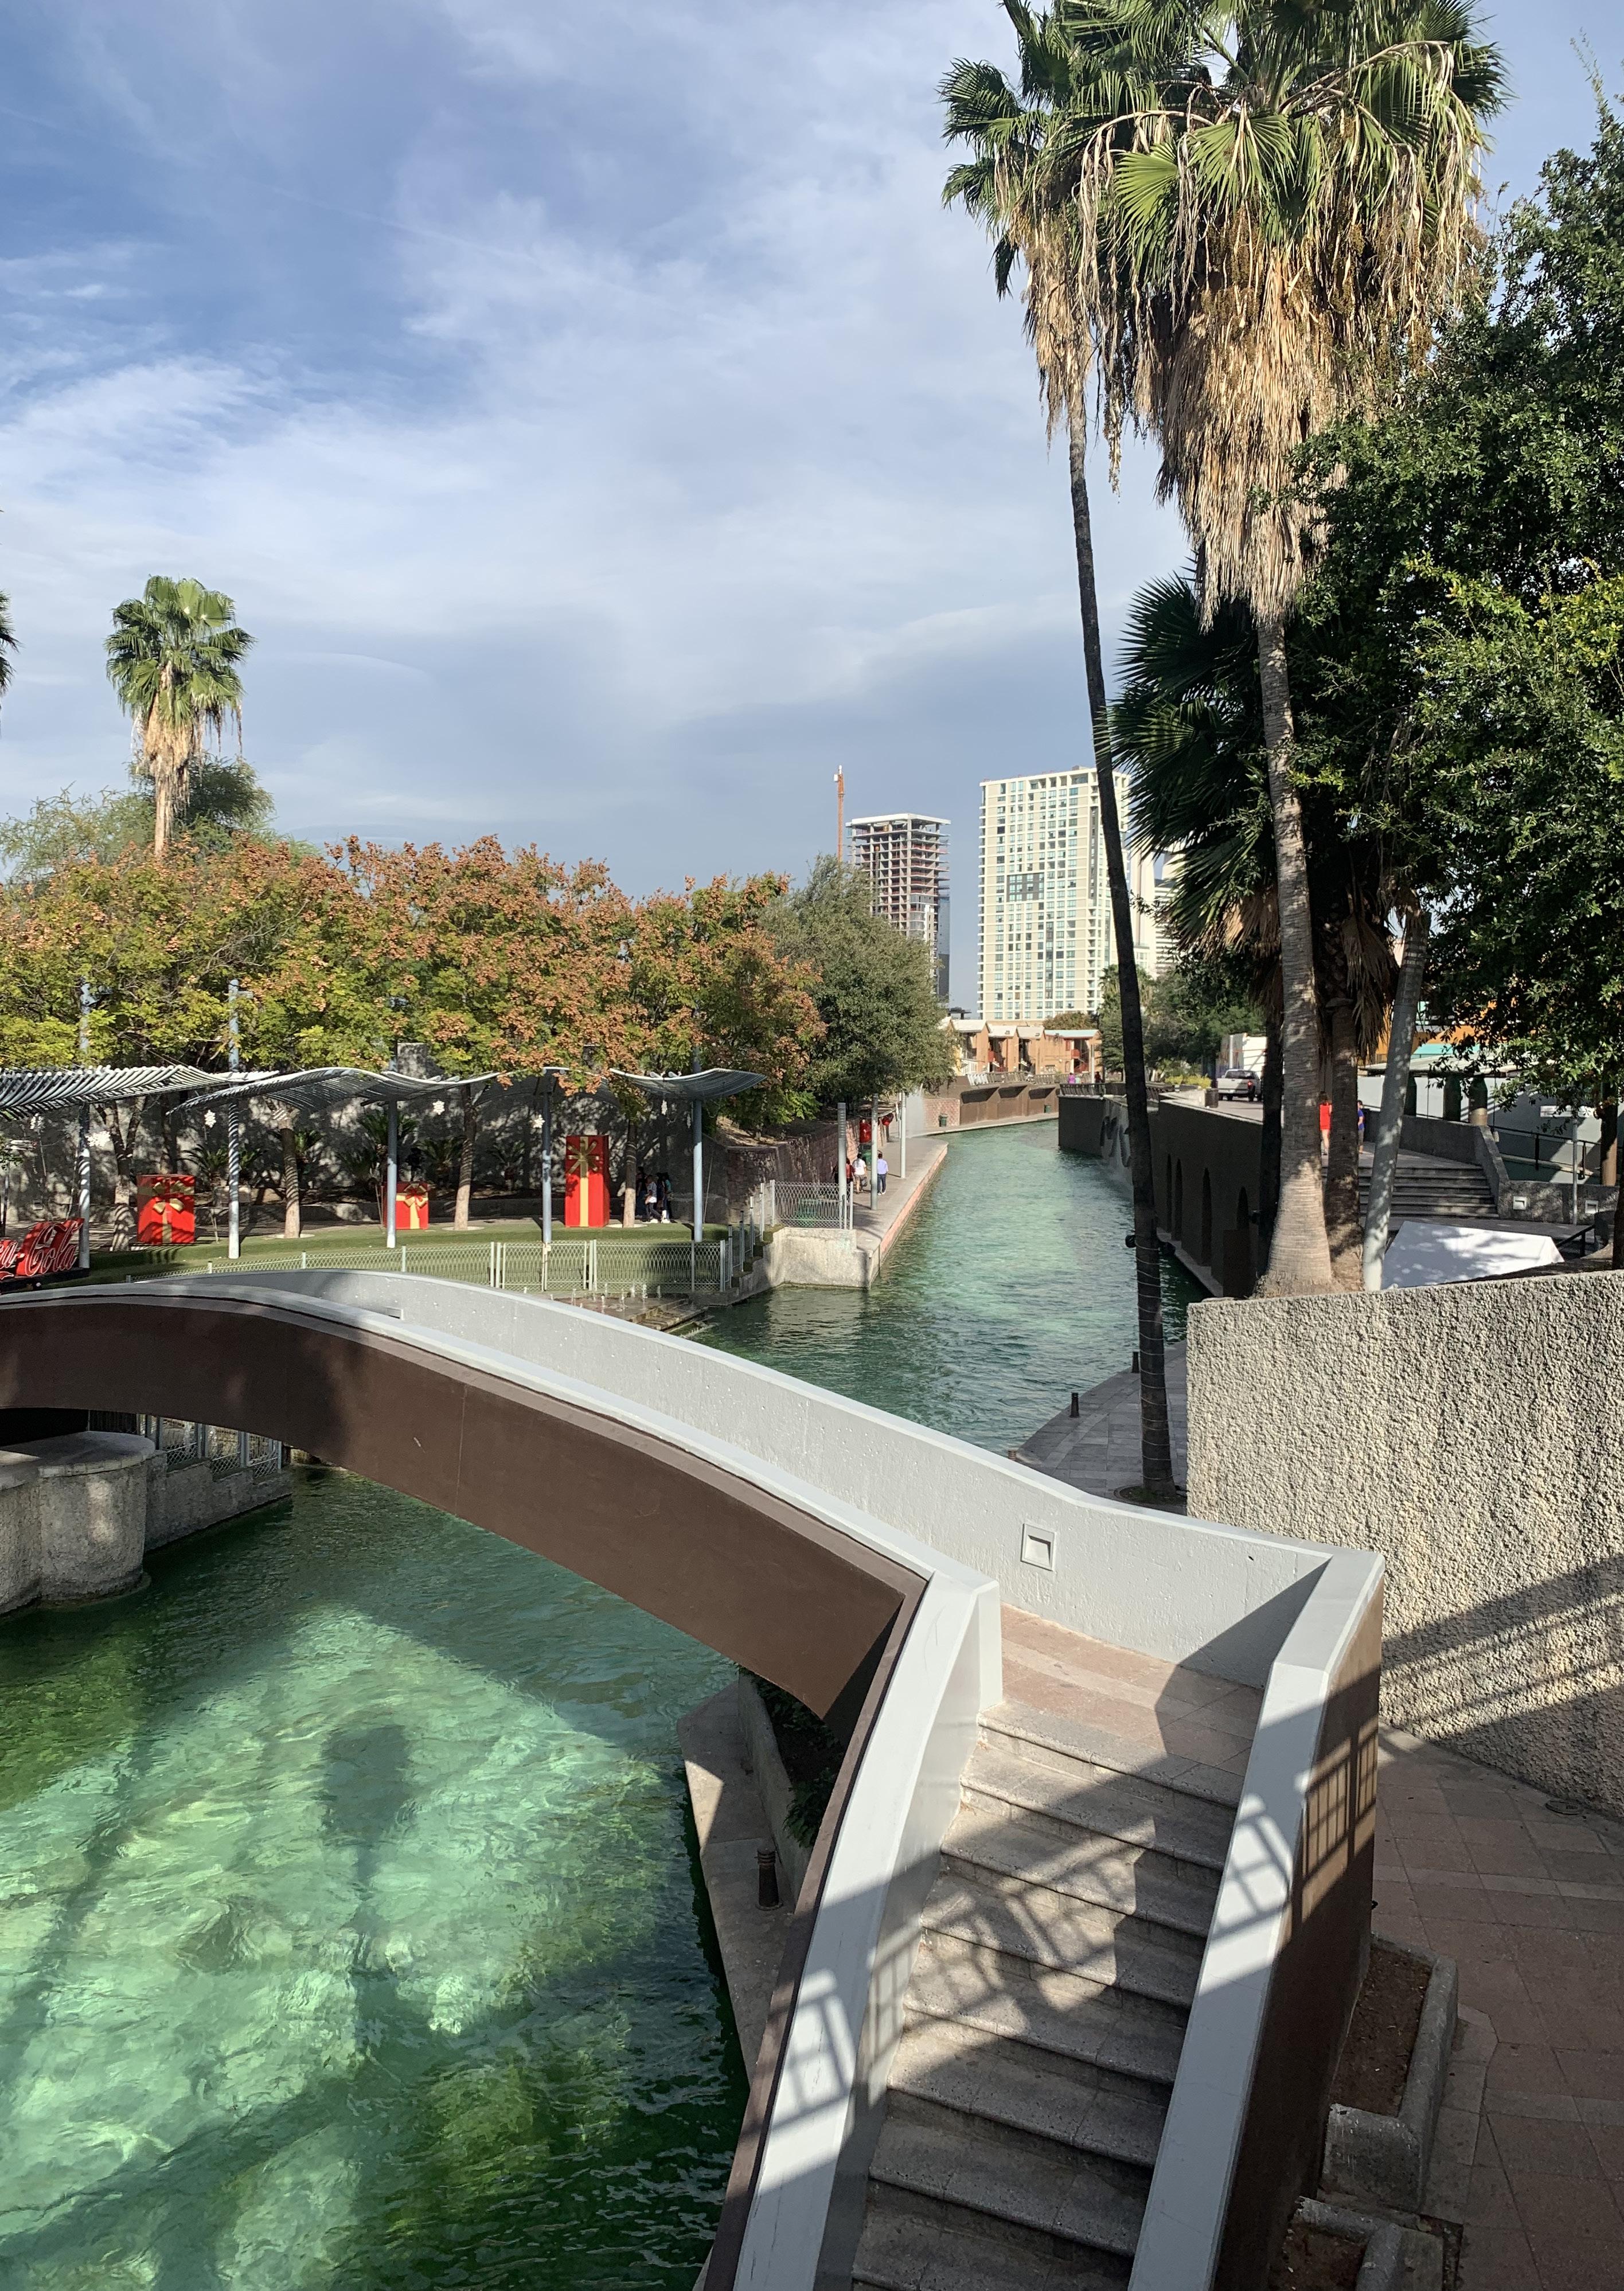
Urban Image
As we can see in the images, we cannot identify our study polygon with a single urban image. The urban image of our polygon is diversified thanks to all the different landmarks, nodes, edges, etc., that complement it. The Santa Catarina River is a great border that limits the downtown area of Monterrey with the Independencia neighborhood and thanks to the border we can see different types of construction, inhabitants, traffic, economic and human activity. As we have mentioned before, the Independencia does not have green areas and/or parks, this creates a series of vulnerabilities for the inhabitants such as the level of stress, psychiatric diseases, chronic diseases. Contrary to the houses and neighborhoods in the downtown area of Monterrey, where there are more possibilities to go out and see some place or open space for coexistence and enjoyment. Reiterating
what was mentioned in previous paragraphs, the downtown area of Monterrey and the Independencia neighborhood are different places. However, within the downtown area of Monterrey, various feelings and ways of living coexist within downtown Monterrey. It is very different to live in Monterrey city center, in Barrio Antiguo where most of its entity is at night, where the inhabitants of the ZMM go partying, walking, and giving preference to pedestrians, compared to the Macroplaza where there is a greater human movement during the day, is located next to the government palace and there is a much greater sense of belonging. Not to mention Fundidora Park, which borders the edges of our polygon and is another sensation and image of Monterrey, which like the Macroplaza seeks to improve the social fabric, the park has a larger and safer green area.
34
Elaborated by Luis Moniet (2022)
Elaborated byFernando Rodriguez (2022)
Elaborated by Luis Moniet (2022)
Elaborated by Luis Moniet with Google (2022)
Elaborated by Luis Moniet with Google (2022)
Elaborated by Luis Moniet with Google (2022)
“...we cannot identify our study polygon with a single urban image.”
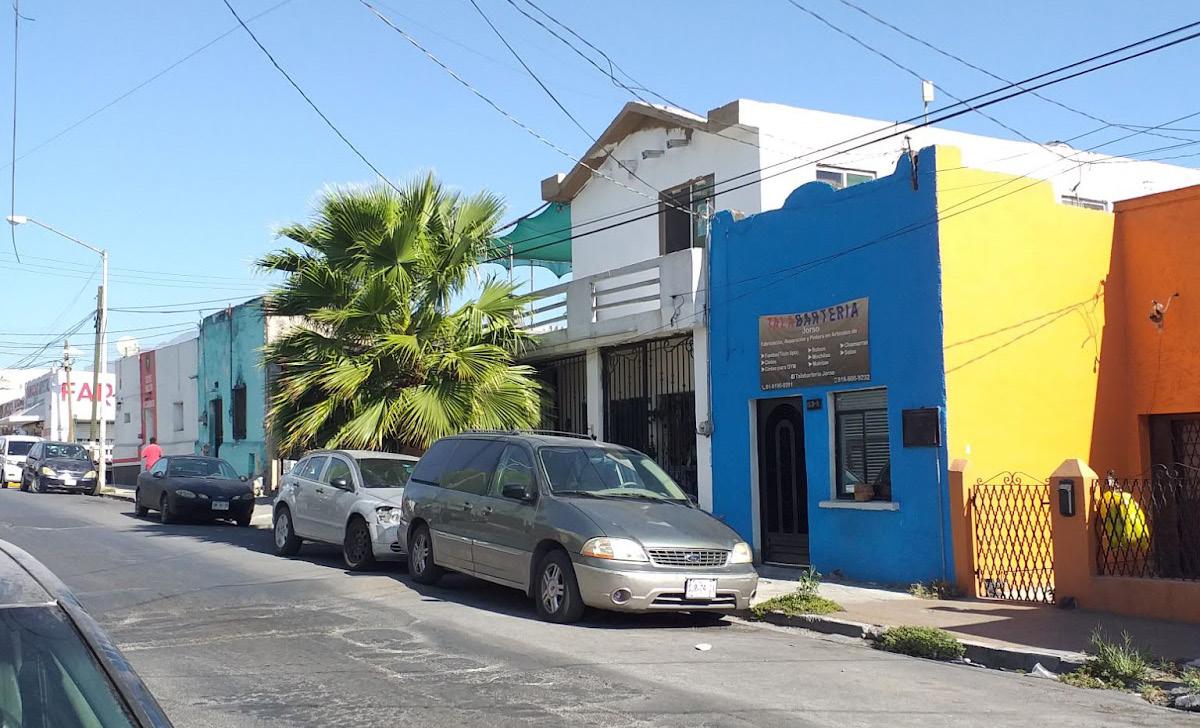
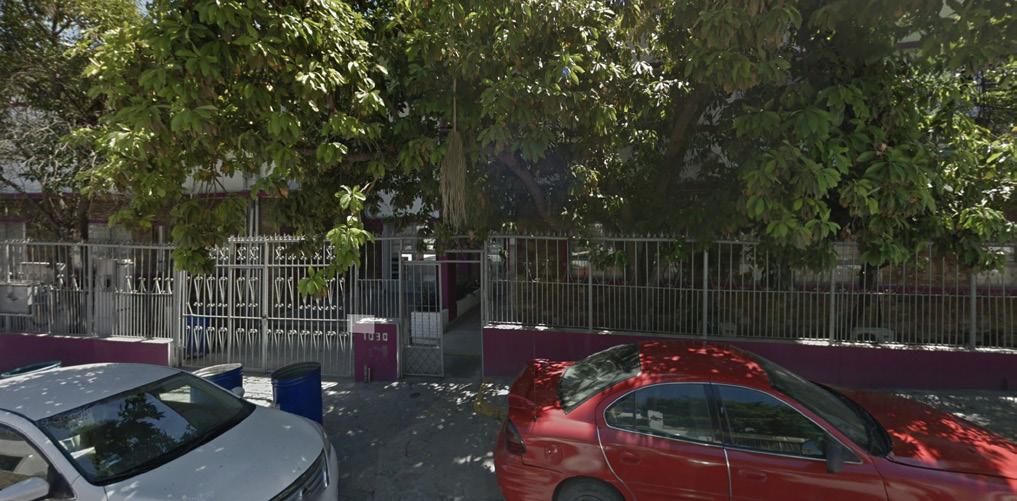
Housing
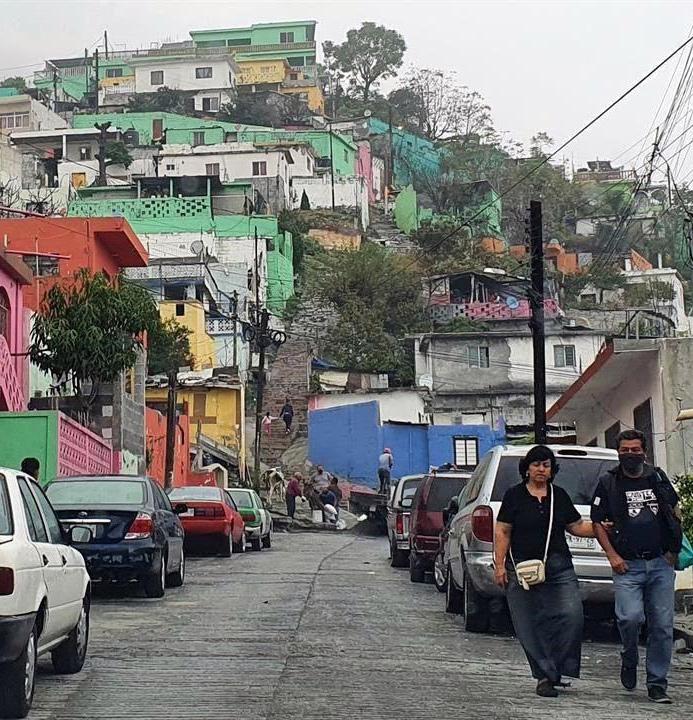
Independencia
In Independencia neighborhood, we can see a typology of houses very different from those built in the downtown area of Monterrey. The first difference between them is the form of construction and soil in which they are made. The houses in the Independence neighborhood, we can see that they are built with materials of the same inhabitants, without any pattern or planning to follow that gives continuity to several houses of the same. Another difference that can be found between the two areas of Monterrey is the level of the houses. There are some exceptions, but in the Independencia neighborhood, the housing tend to be 1 floor higher than those found in the downtown area. In addition, if we walk around the houses in Independencia, we can observe in the entrances to these houses, the highest steps to enter the homes, and this may be for several reasons such as the topography of the area itself, flooding, but it is also mentioned that for economic aspects the doors of these houses were built from a certain height to be considered windows and have to pay fewer
taxes for it.
Another characteristic that we can see in the houses in Independencia, is that many of them share space with the businesses of the same inhabitants. These businesses can offer different services such as carpentry, plumbing, etc., or be grocery stores, greengrocers, health clinics, restaurants, etc., in other words, not all people need to move to get to their jobs, however for there to be movement and production within their businesses, they need a great road infrastructure.
Centro de Monterrey
On the other side, the houses in Centro de Monterrey are made of concrete and cement and don’t have to deal with the same topographic consequences as the Colonia Independencia, for example, slopes, droughts, etc. Also, most of the houses in Centro de Monterrey only have 1 floor, contrary to the ones in Colonia Independencia that have 2 floors.
As the image shown, most of the houses in Centro de Monterrey share some particularities such as the design outside the house, they are characterized by the fence in the windows and
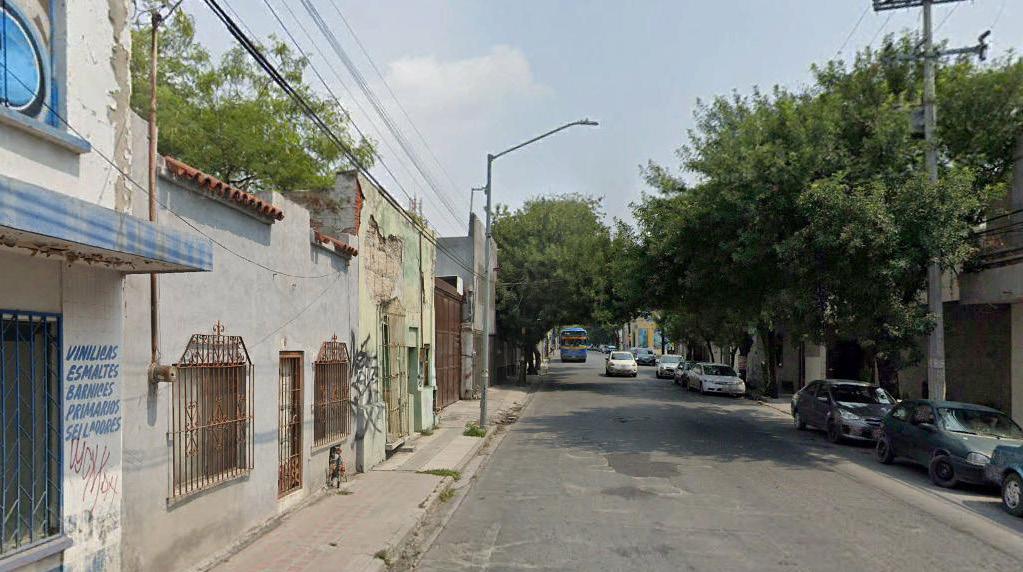
door as probable security mechanism. Another characteristic of the houses is that they look like they were built and designed a long time ago, they look very aged and neglected. But, one of the similarities that share these two areas is that the houses are not planned to have a garage to keep the cars inside, having problems with a street full of automobiles that obstruct sidewalks or the transit for vehicules.
35
Elaborated by Luis Moniet with Google EarthI (2022)
Elaborated by Luis Moniet with Google EarthI (2022)
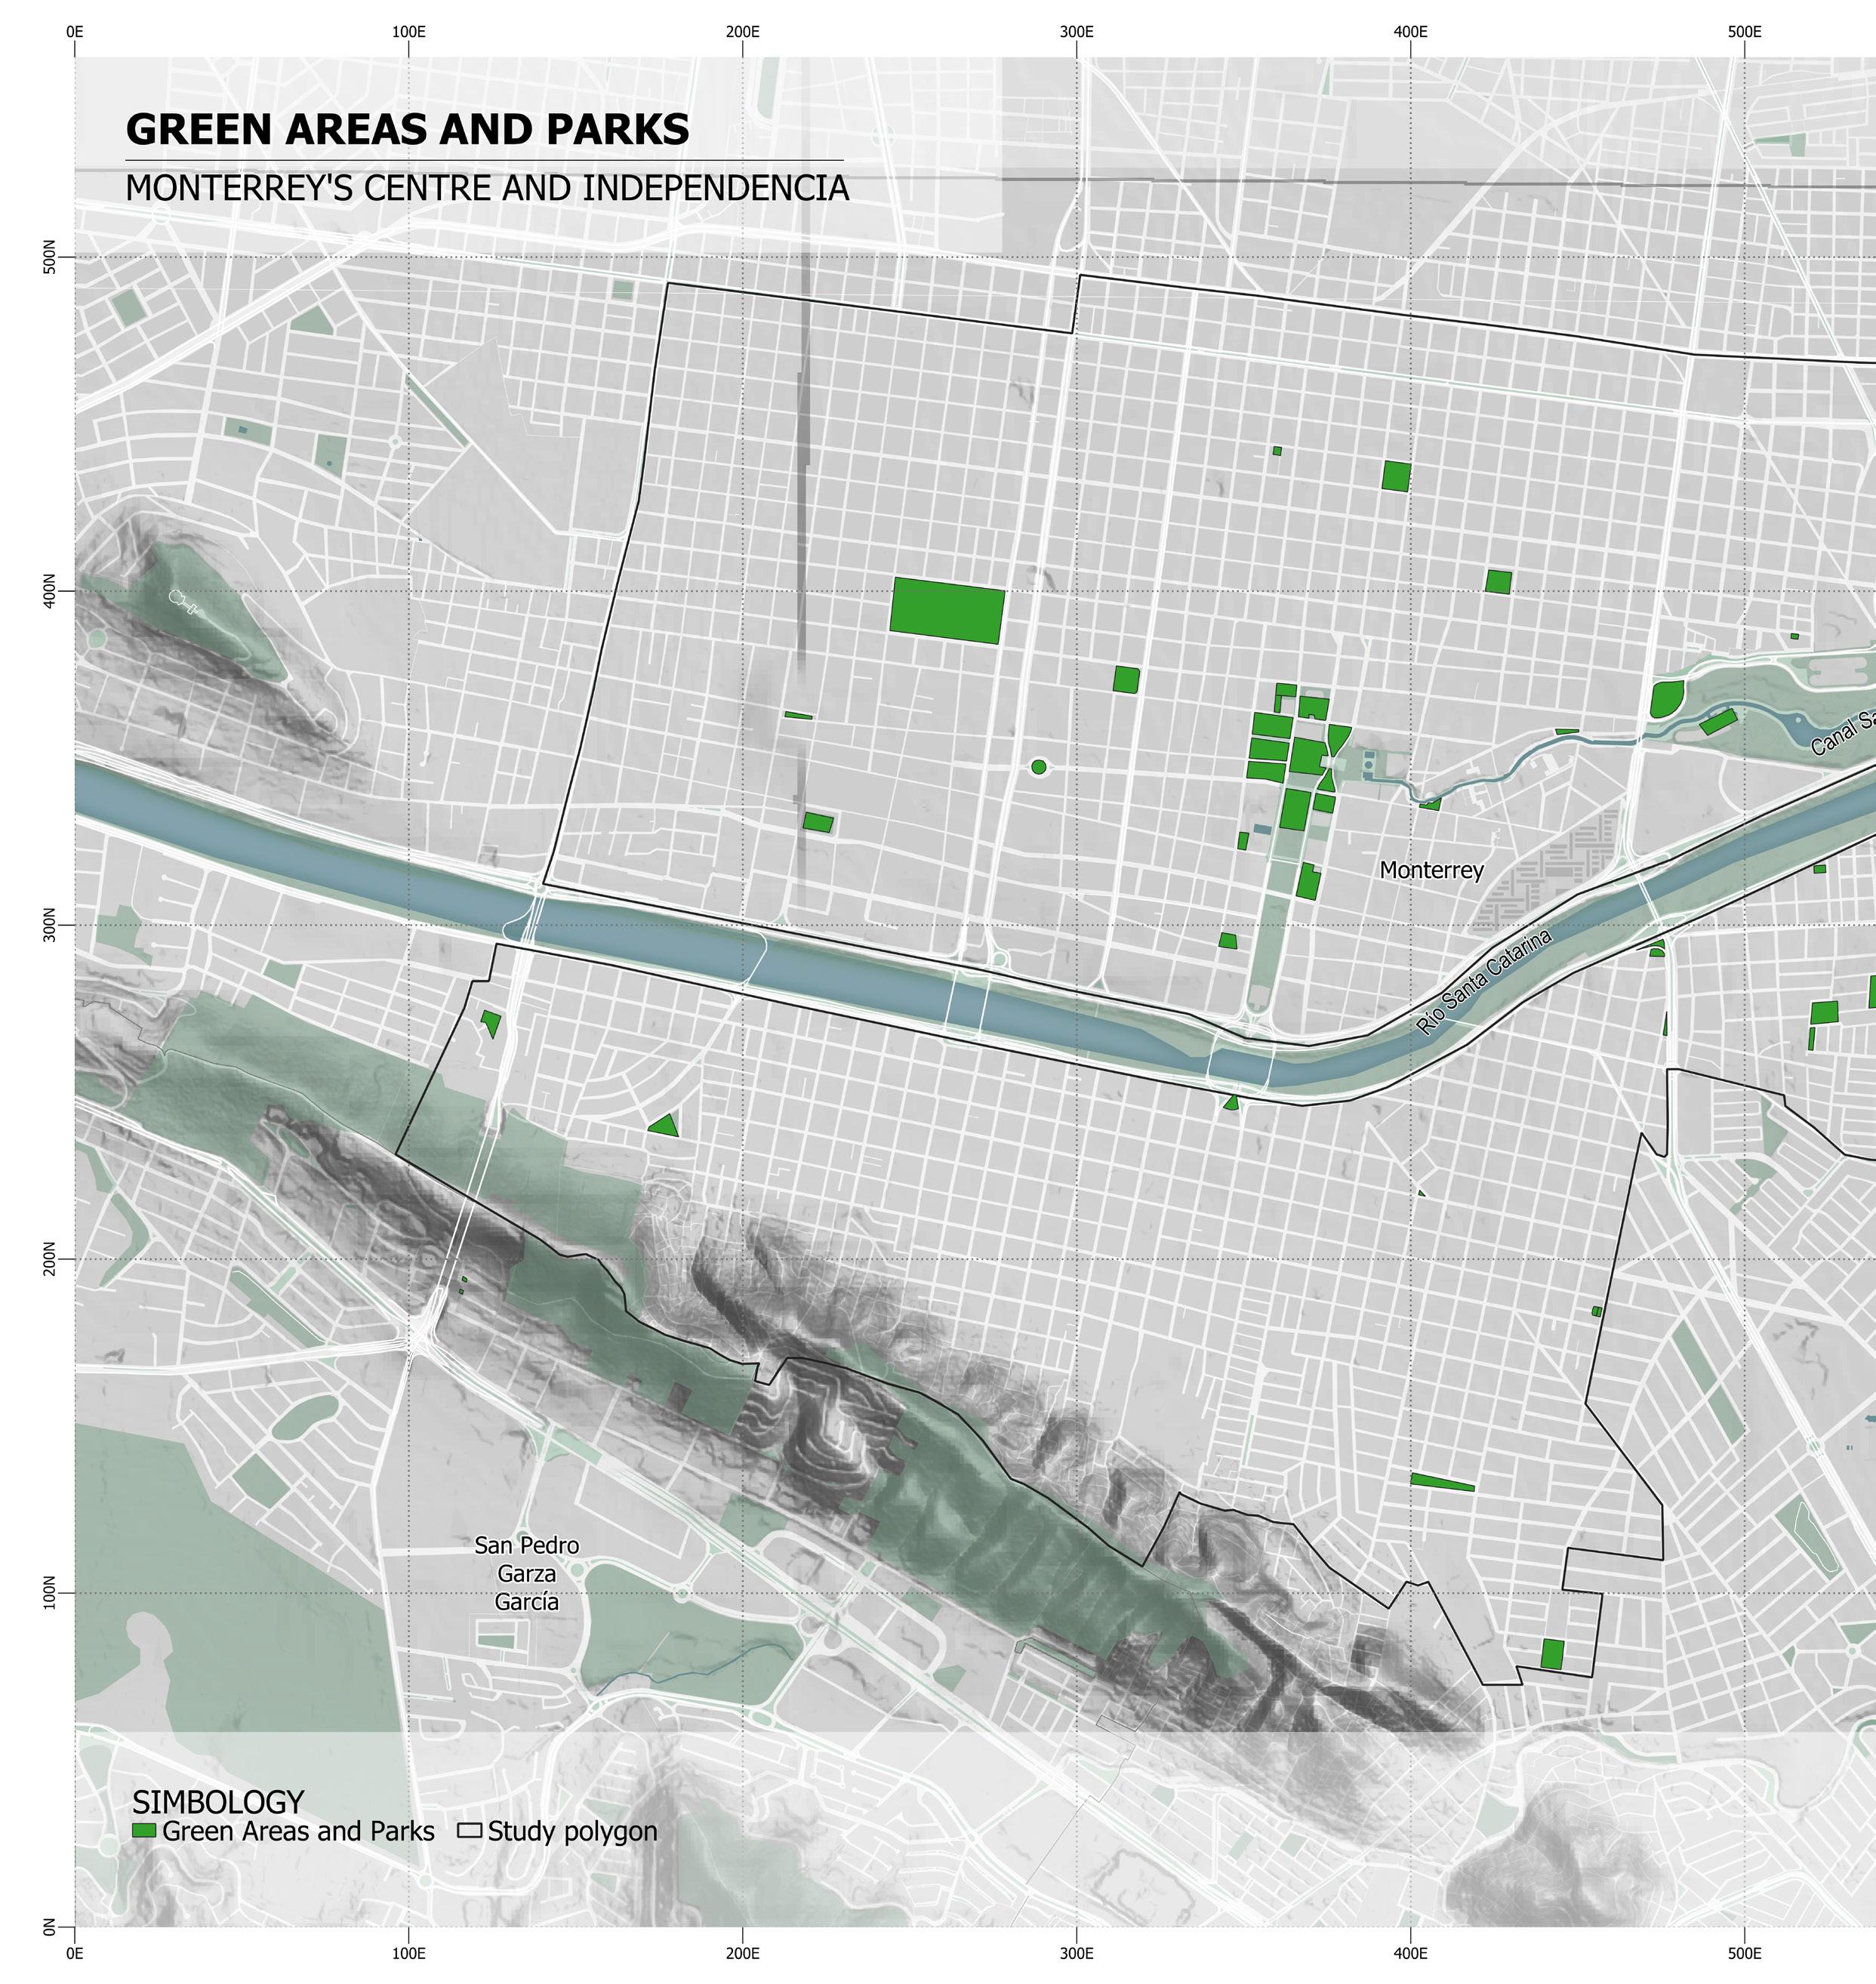
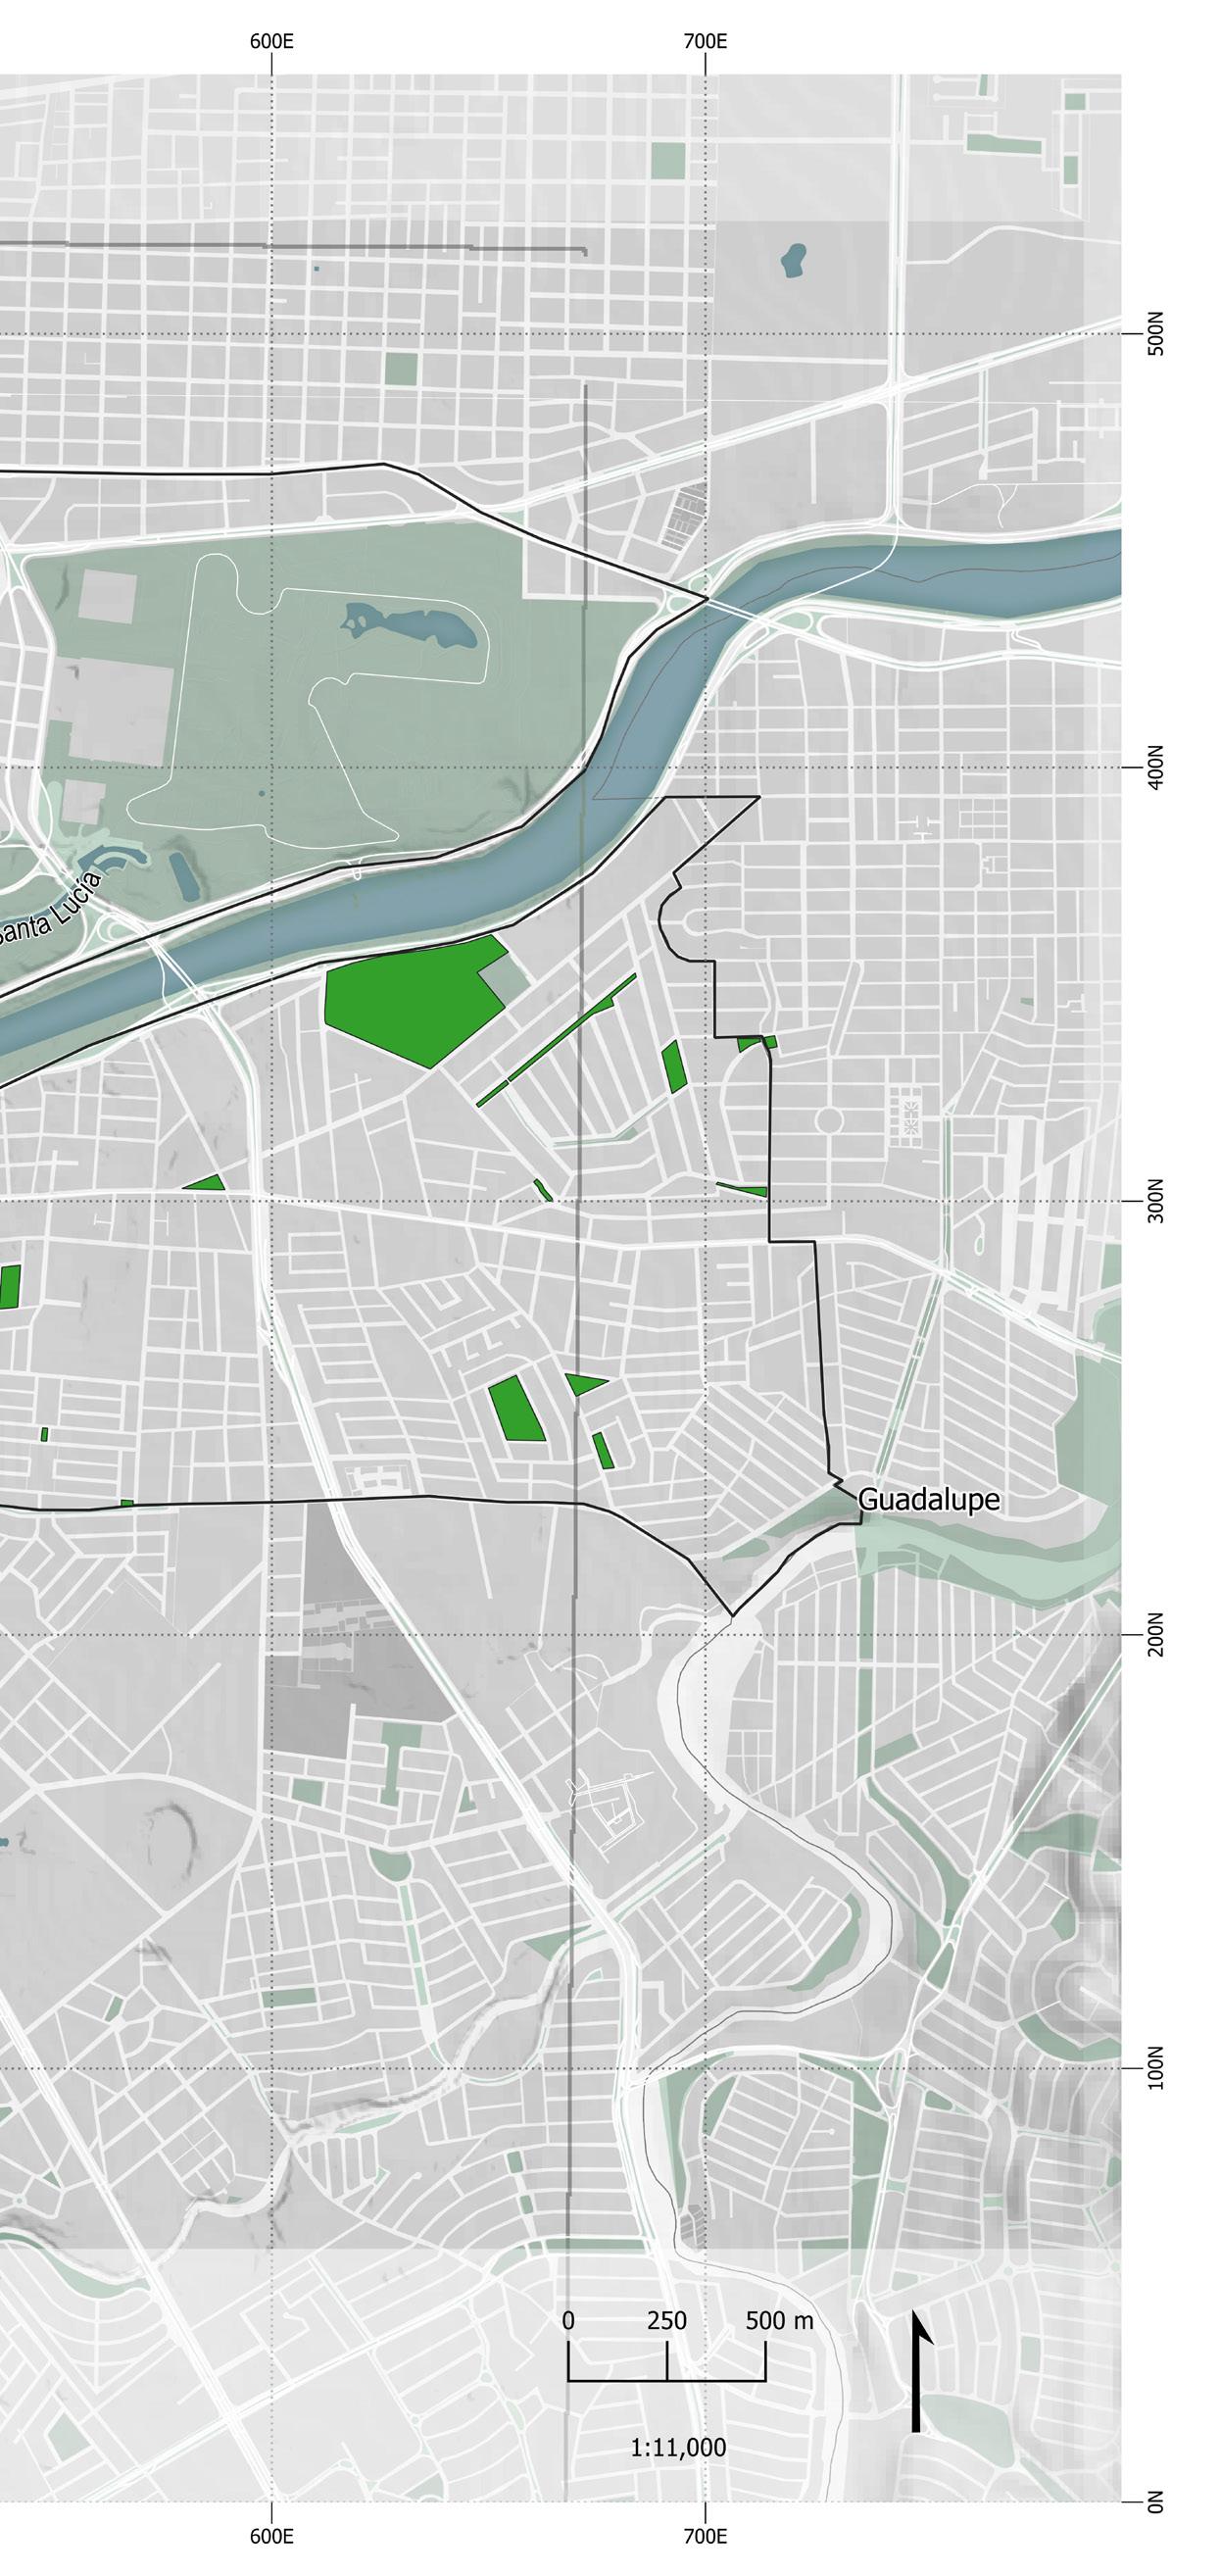
Green spaces
36
“the recommendation of the World Health Organization to have at least 9m2 of green space per inhabitant at a distance considerably close to homes.”
The map shows the green areas and parks that exist within our study polygon, and thanks to this we can observe the imbalance that exists between the downtown area of Monterrey and Independencia neighborhood, despite having a greater number of houses in the Independence neighborhood. This makes evident the non-compliance with the recommendation of the World Health Organization to have at least 9m2 of green space per inhabitant at a distance considerably close to homes.
Not to mention that all these parks are not green areas full of vegetation, for example, the Flores Magon park/plaza that is contemplated on the map; however, it is a park made of pure cement and little trees without any maintenance and serves as a recreational area for children but that only allows its enjoyment during the evenings.
37
Elaborated by Luis Moniet with information from INEGI (2021)
Climate, quality of air, sun direction and wind
The table above is composed of climatological data on Monterrey from 1991 to 2021, analyzing and averaging according to each category individually based on each month.
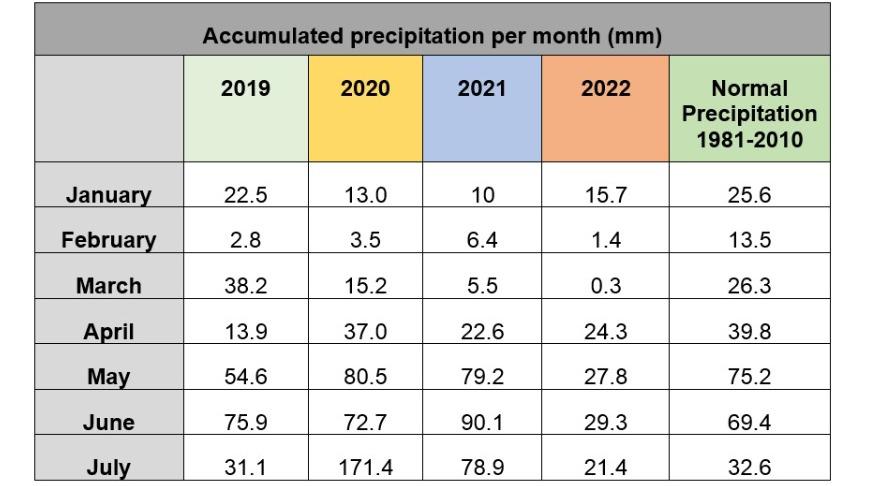
As we can see in the table, August is the hottest month of the year, having the highest average, minimum and maximum temperature compared to the other months, and due to the high temperatures, can be reflected in the levels of precipitation and humidity which are the lowest averages of all. However, the thermal sensation, through the streets of downtown and the Independencia neighborhood is much higher than the predicted temperature. This can be due to several factors such as the lack of trees and/or green areas that can absorb solar radiation from the paving of streets and avenues.
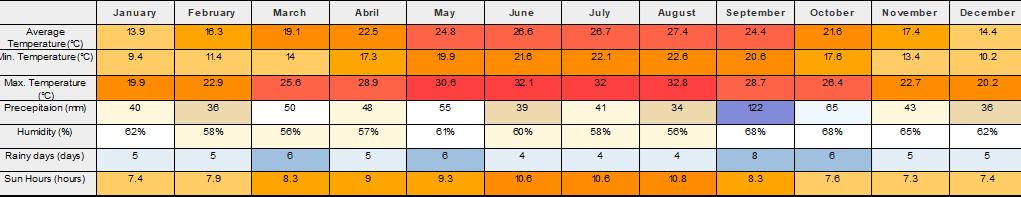
From the pedestrian’s perspective, having adequate vegetation and trees on the sidewalks makes a walk much more pedestrian-friendly, because the trees, apart from producing shade and counteracting air pollution, can reduce the temperature by 8-10 °C and thus, the thermal sensation of pedestrians.
However, Monterrey, being a city with a changing climate, can have these extremes in its climatic situations, from snowfall in winter seasons to intense heat islands and extreme droughts like the current one.
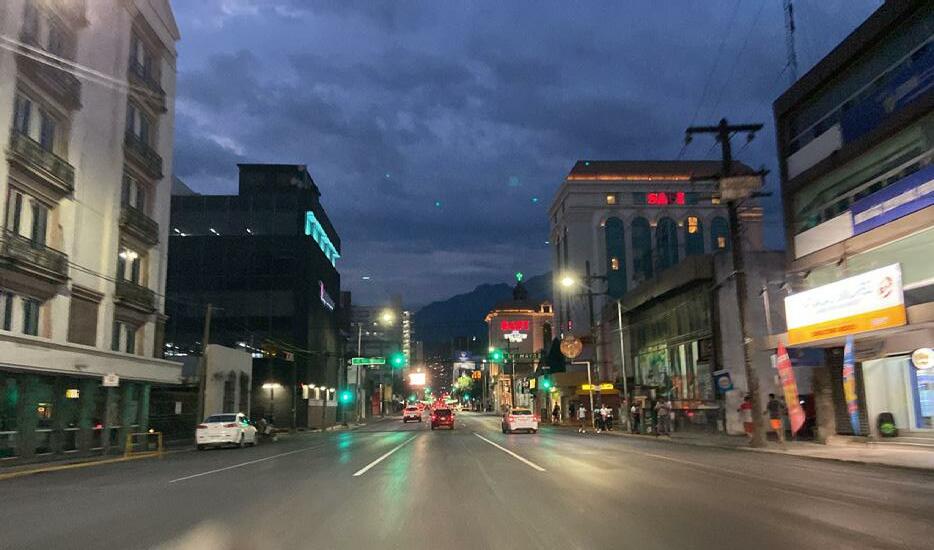
On average there are months of the year that count with more hours of daylight, such as May, June, July, and August. Even though this could mean more heat during the day it offsets the lack of light infrastructure in some streets of the area as shown in the picture. Now imagine a day in the other months, when the sun goes out earlier and the pedestrians need to walk on these streets to come back to their houses.
According to INEGI statistics, the average annual rainfall in the area is approximately 600-650 mm, with August and September being the months in which this atmospheric phenomenon has the greatest incidence; however, throughout this year there has been a drought that has caused the monthly accumulated rainfall to be much lower than in previous years.
38
Elaborated by Luis Moniet with information from Sun Earth Tools, Semaforo de Nuevo León, aire Nuevo León and Climate.org
39
TOPOGRAPHY
40
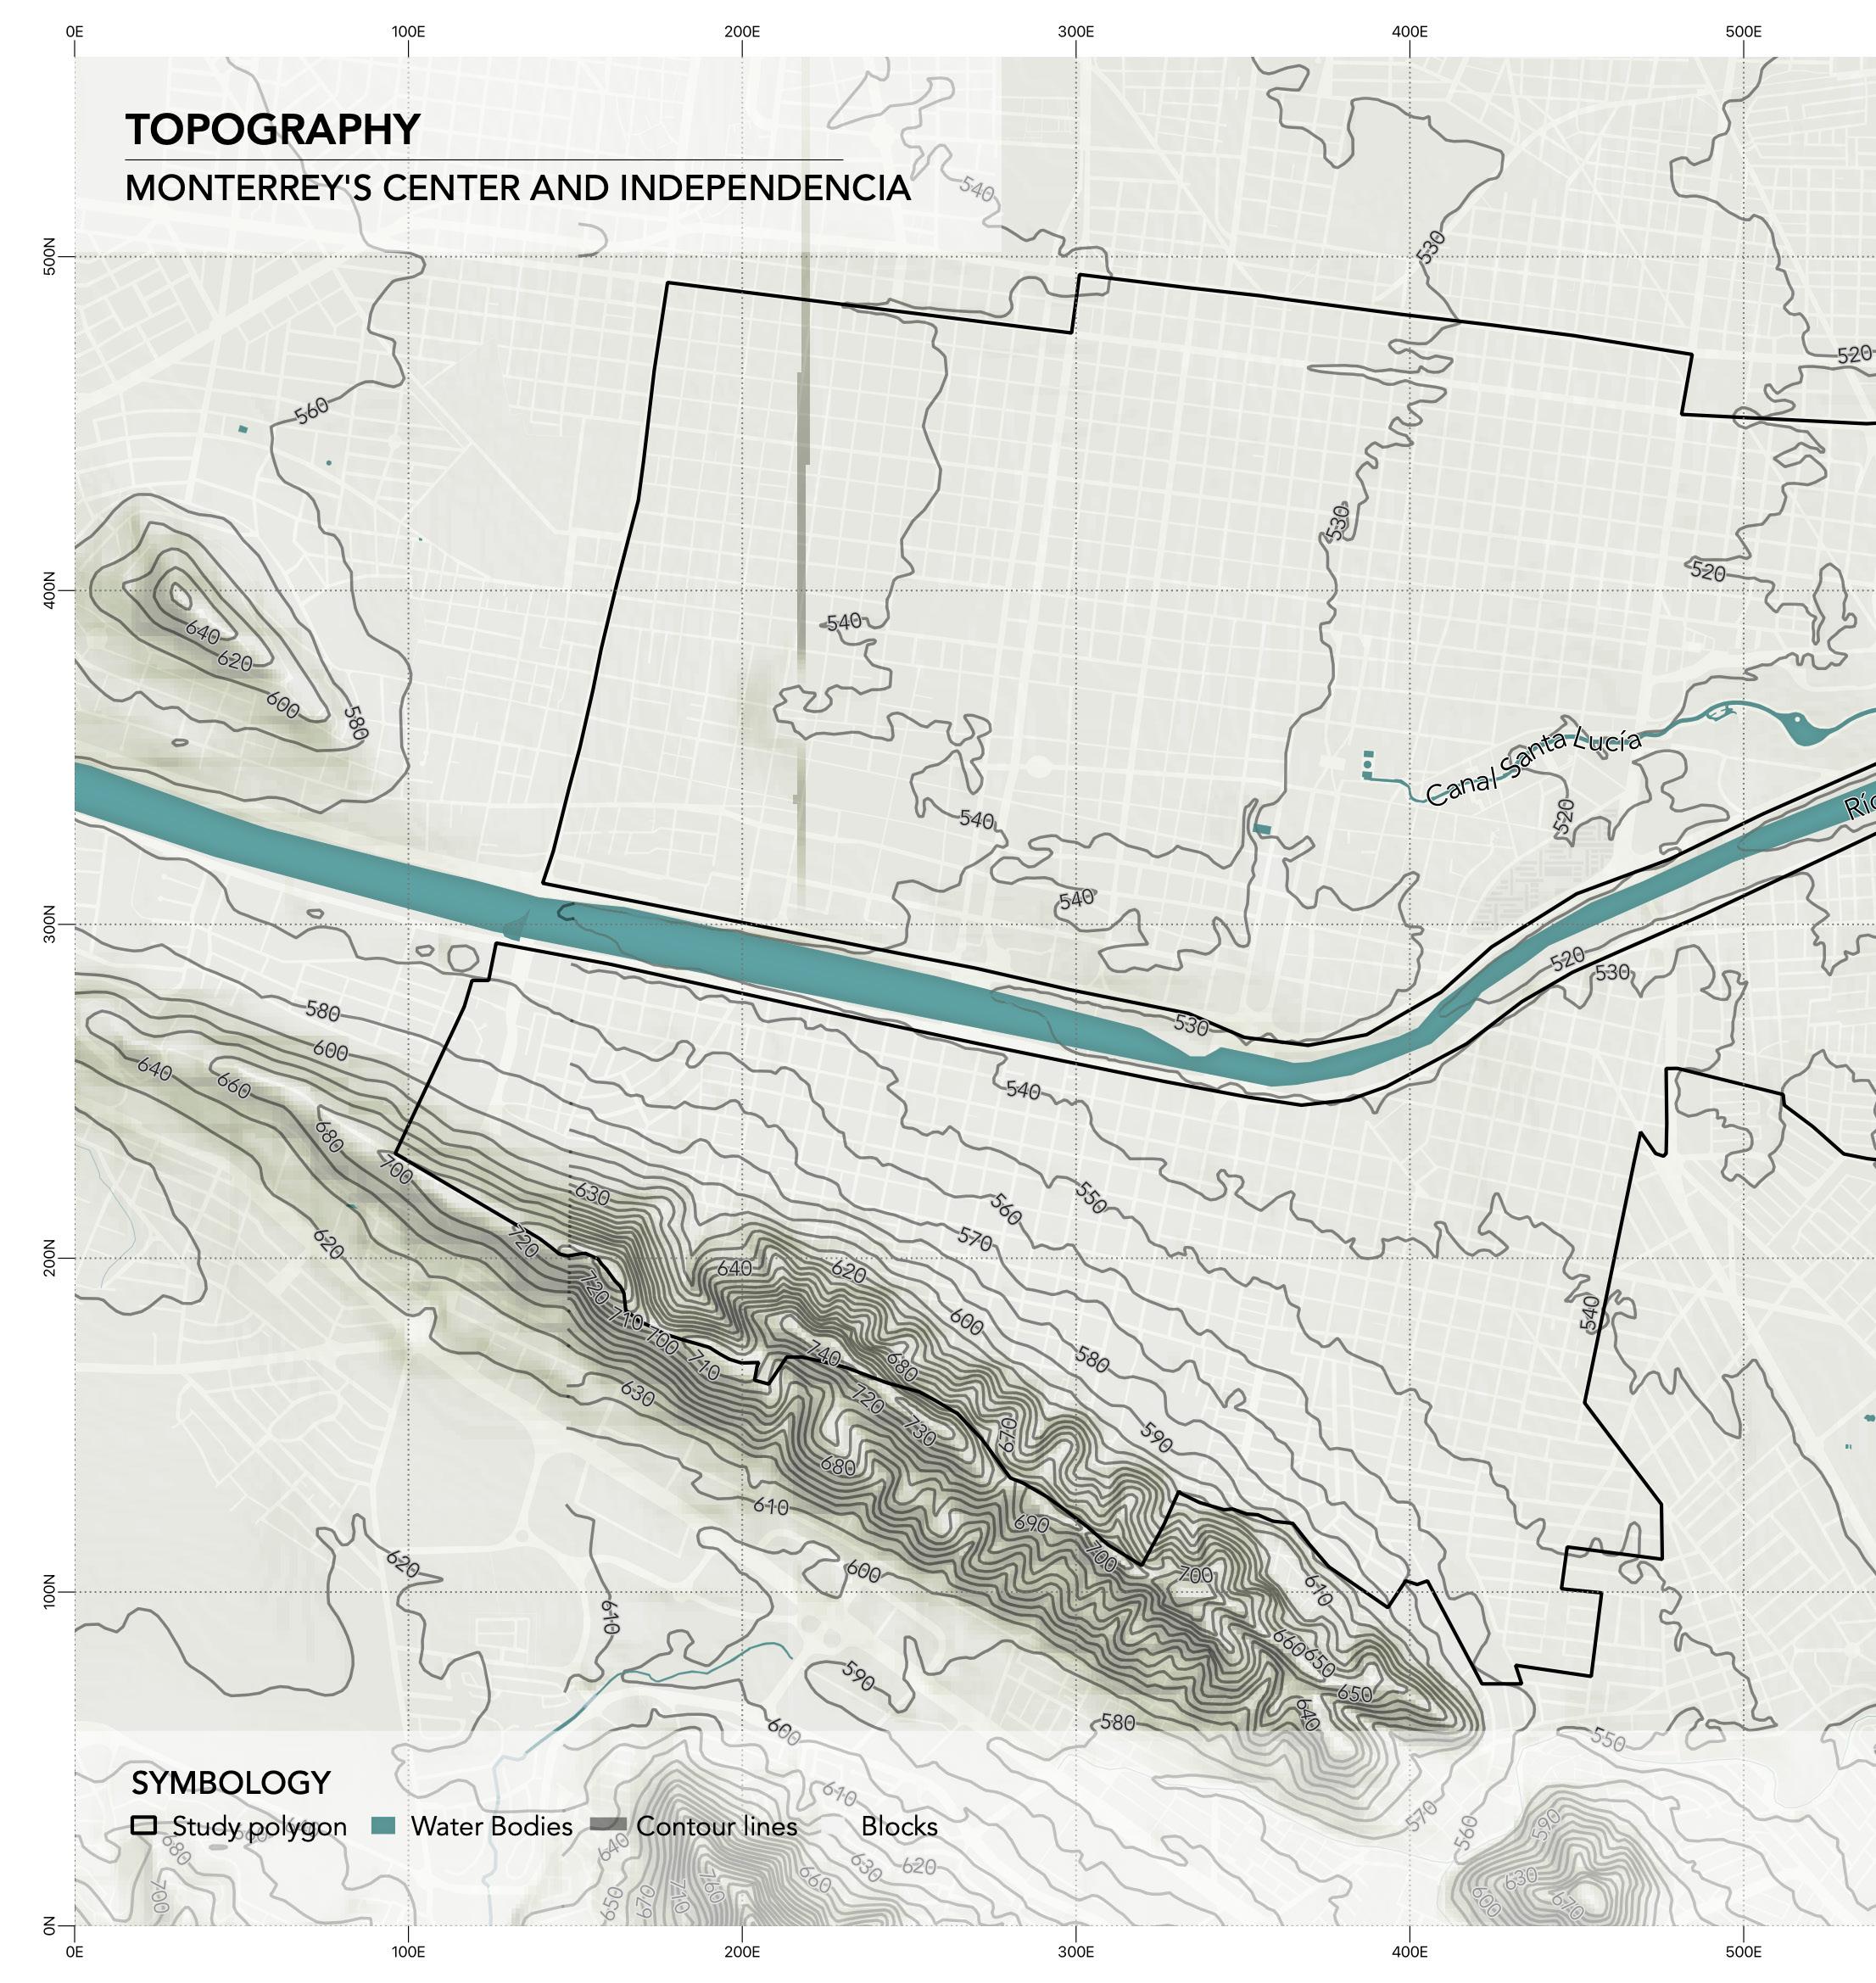
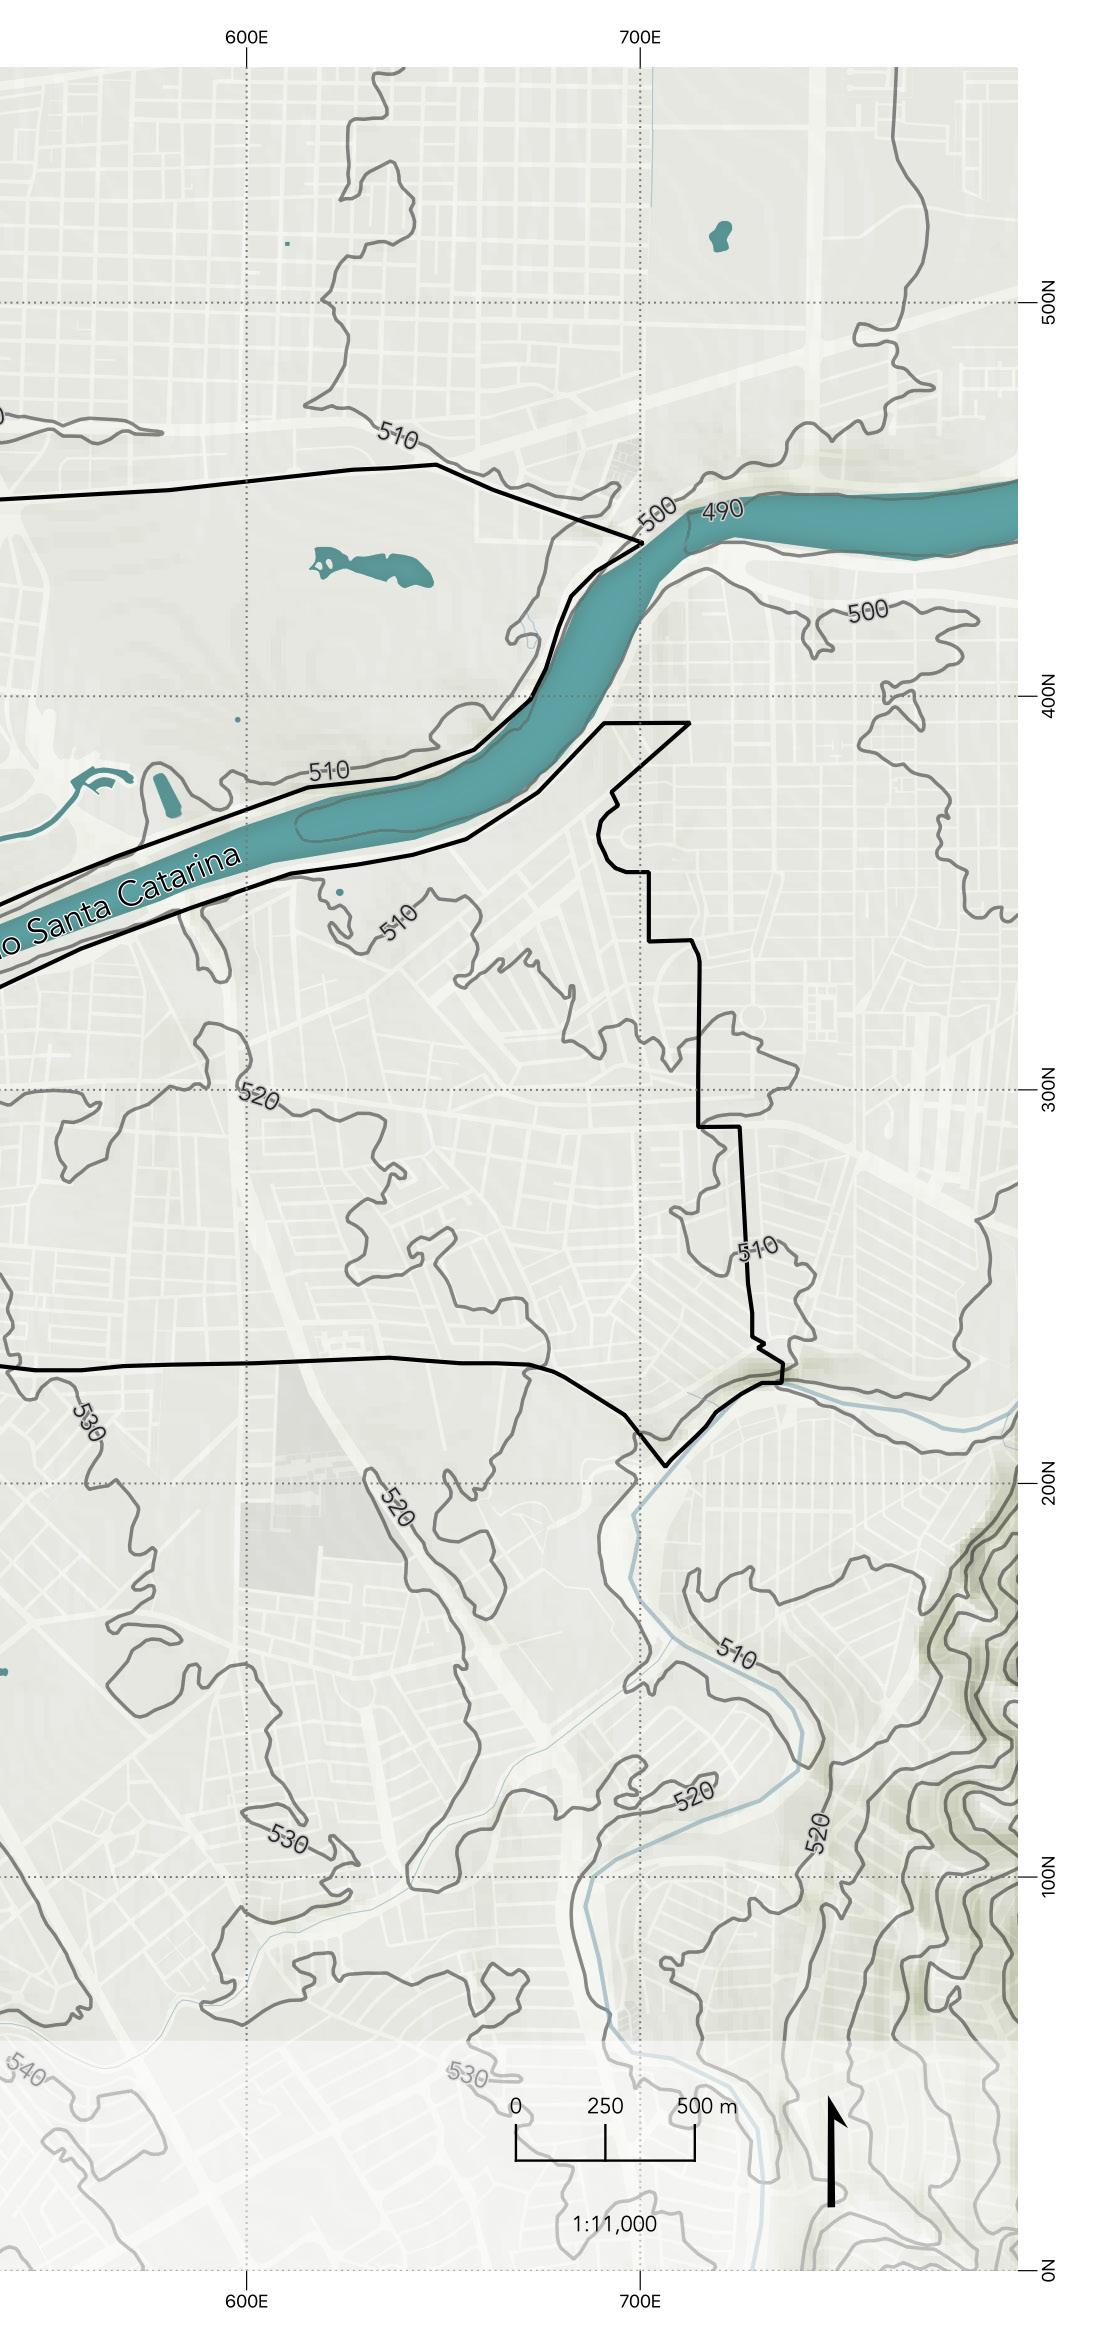
“Cerro de la Loma Larga divides Monterrey and San Pedro Garza García, more specifically Independencia and Distrito Valle Oriente.”
Elaborated by Ana Cepeda with information from INEGI (2021)
As we can see on the map, the maximum height in our study polygon is 740 mm on Cerro de La Loma Larga being a characteristic of Independencia. The minimum height is 510mm in the Center of Monterrey. Cerro de la Loma Larga divides Monterrey and San Pedro Garza García, more specifically Independencia and Distrito Valle Oriente.
As we can see by the blocks that divide the zone, there are settlements in Cerro de la Loma Larga that are irregular. This urban development started to happen between the ’60s and ’80s with Independencia included. (Garza Andonie, 2020) In those times, they didn’t consider the possible risks that represent living on a mountain, so now we can see that landslides could happen, and there are water courses that provoke floods or waterlogging as we will see on the next topic.
41
HYDROLOGY
42
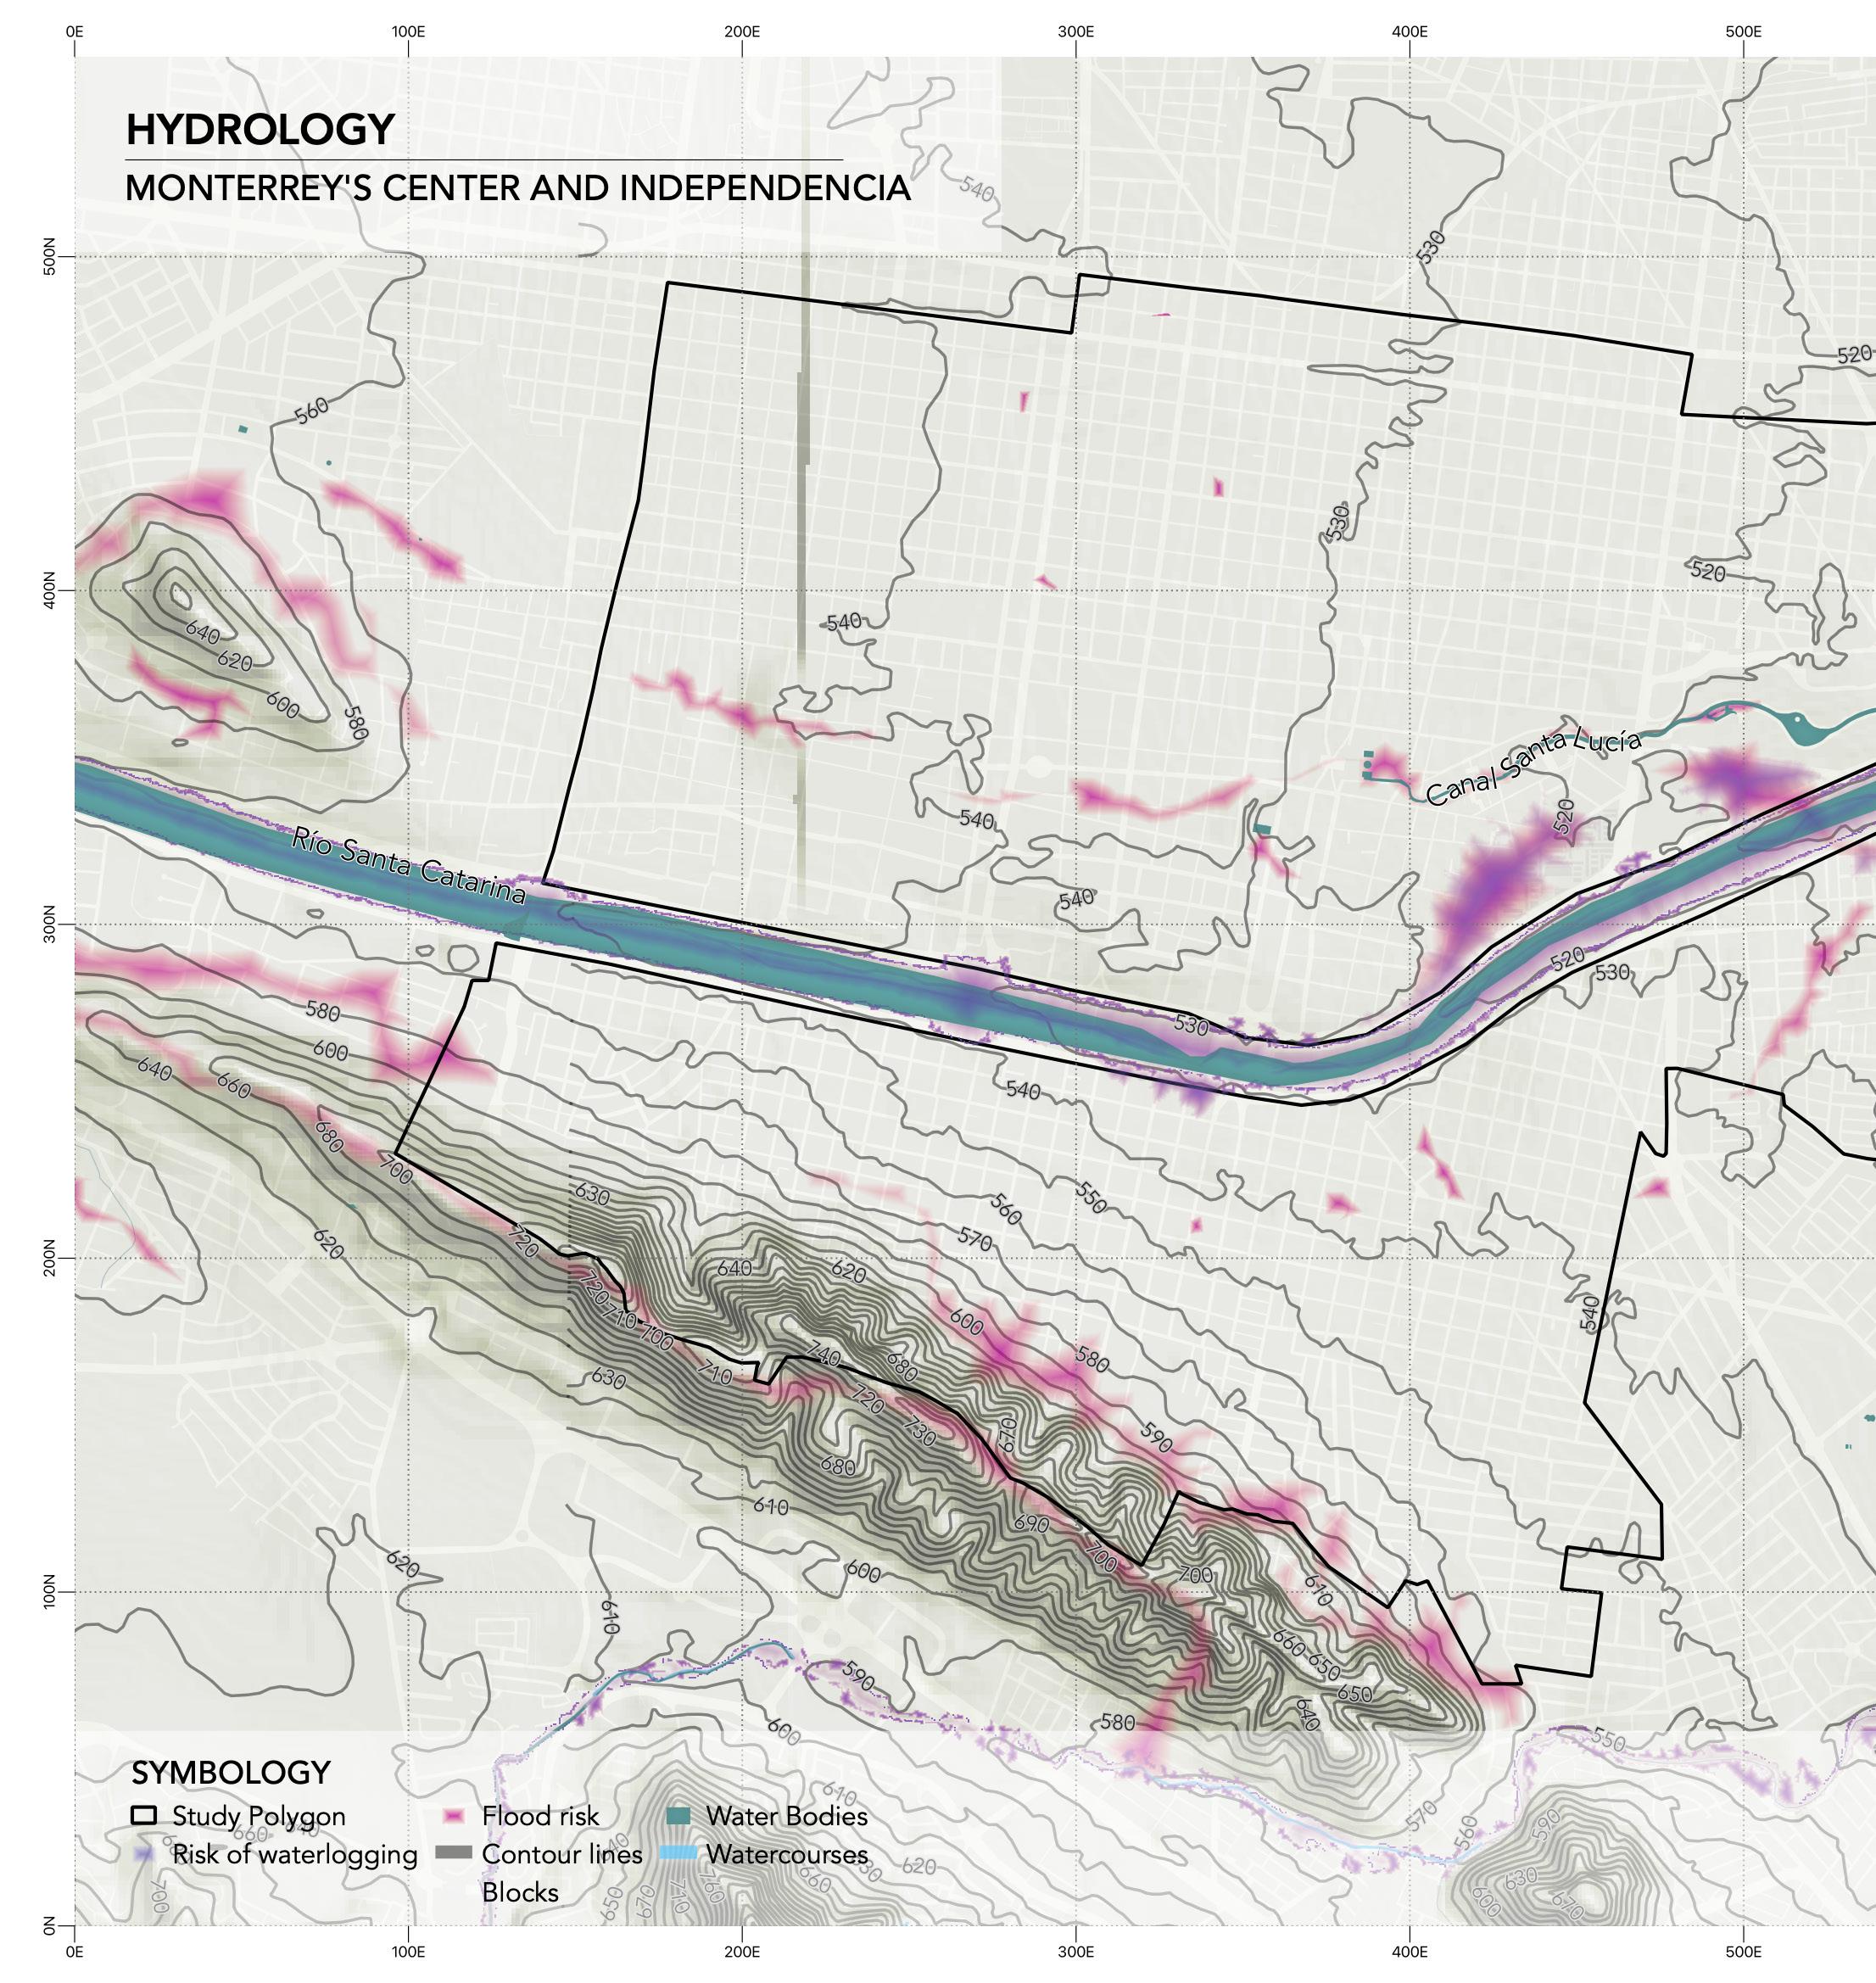
“Río Santa Catarina is an element that helps to mitigate a risk when there’s hurricanes, as in the Alex (2010).“
Elaborated by Ana Cepeda with information from INEGI (2021)
Into the polygon, we can see there are two water bodies: Río Santa Catarina and Canal Santa Lucía of which, Canal Santa Lucía it’s not a natural one. Río Santa Catarina is an element that helps to mitigate a risk when there are hurricanes, as in Alex (2010). With the vegetation that it’s in there, it helps to stop the velocity of the water.
We can see that there are risks of waterlogging and flood risk mainly in Condominios Constitución and Independencia. This happens for two reasons: condominios Constitución is on the riverbank of Río Santa Catarina, which means that on a rainy day, this zone could suffer the consequences; Independencia is located in Cerro de La Loma Larga, as we saw before, it represents that the possibles watercourses that go down the mountain, provoke floods and waterlogging.
43
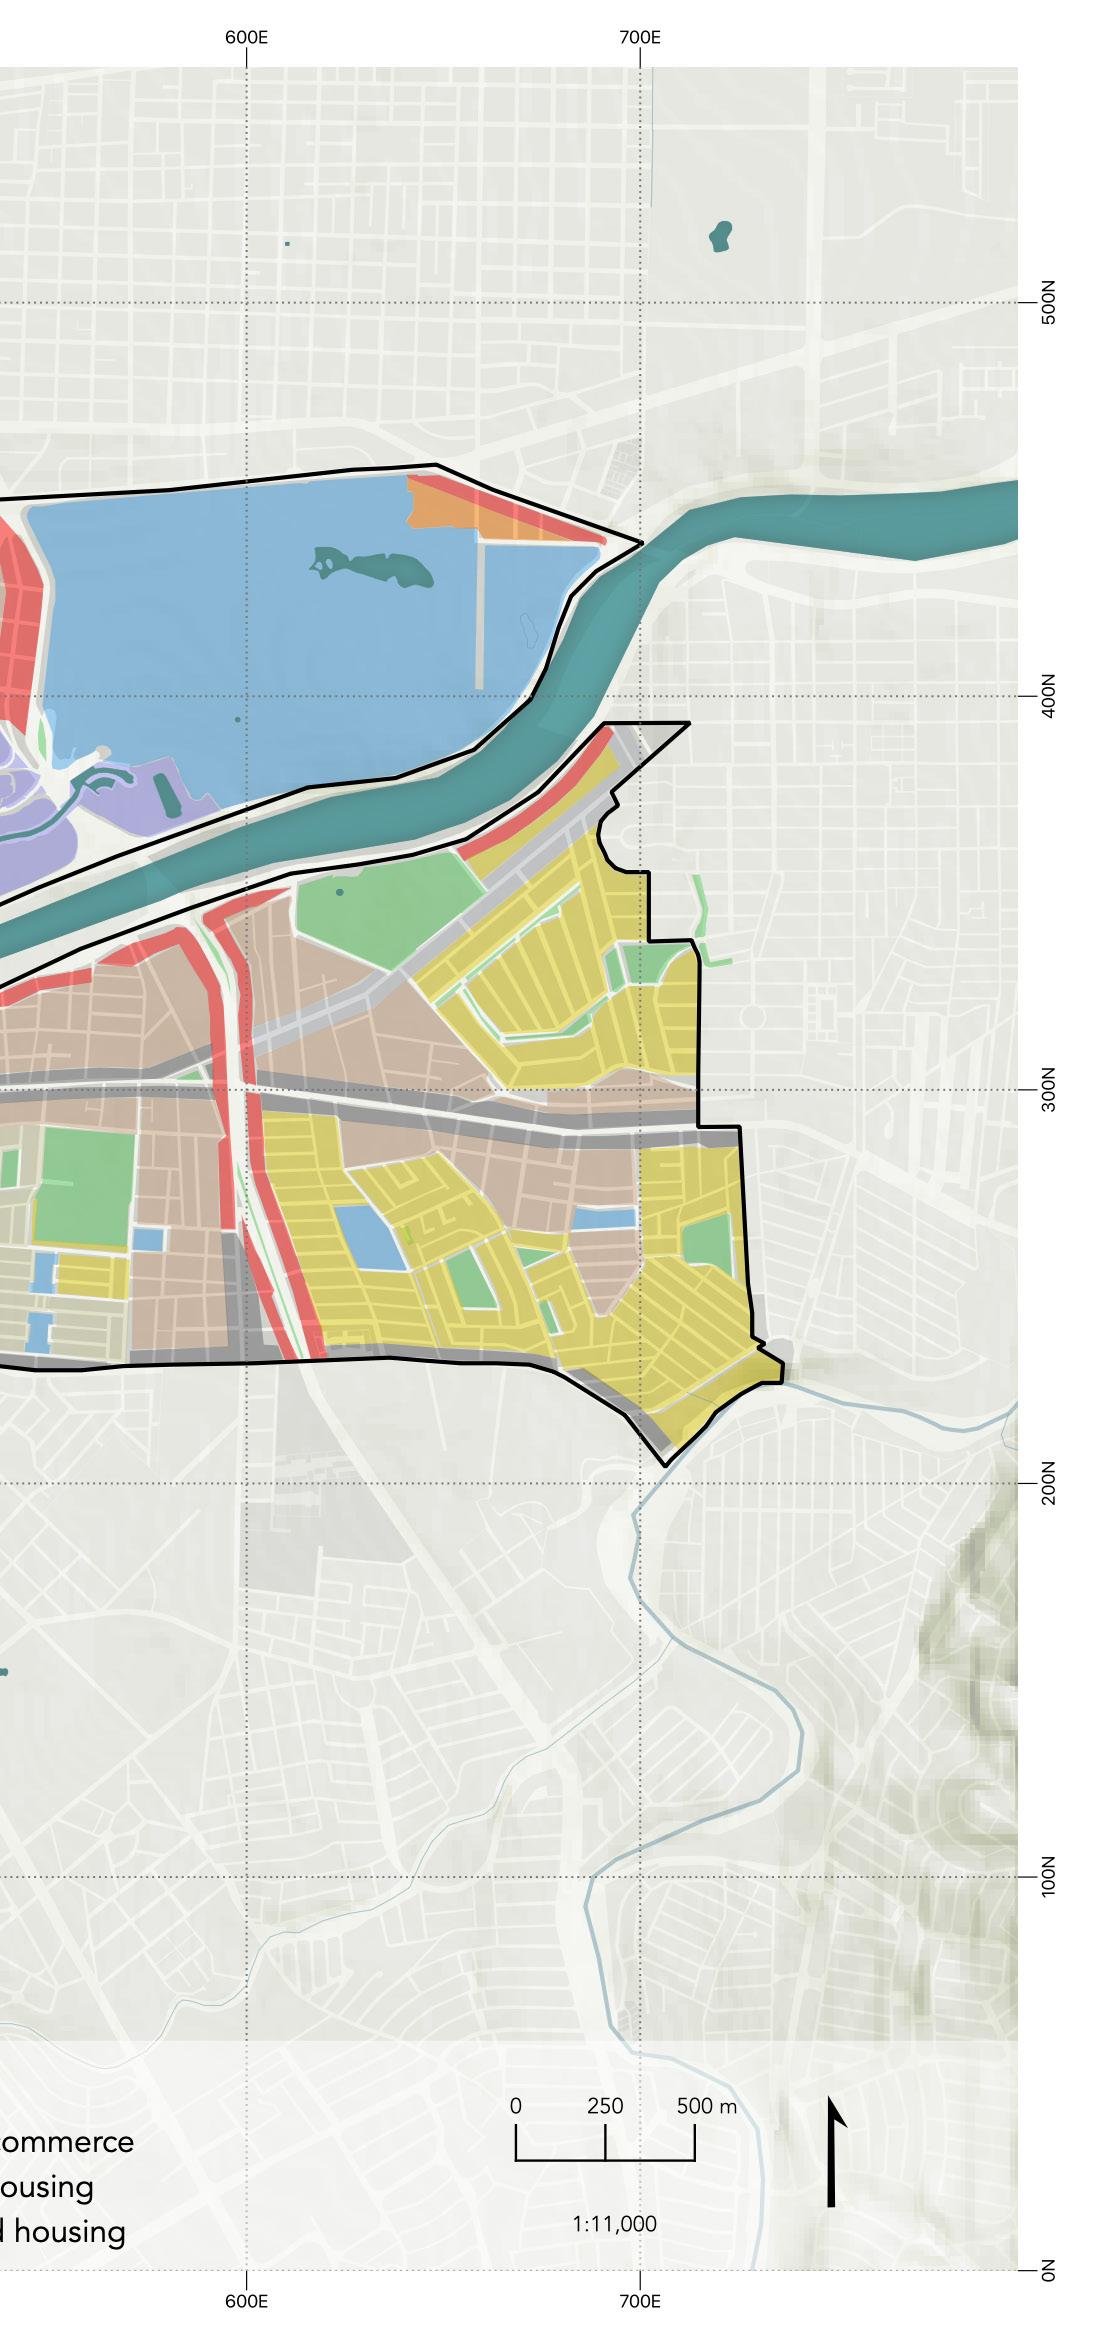
ZONING
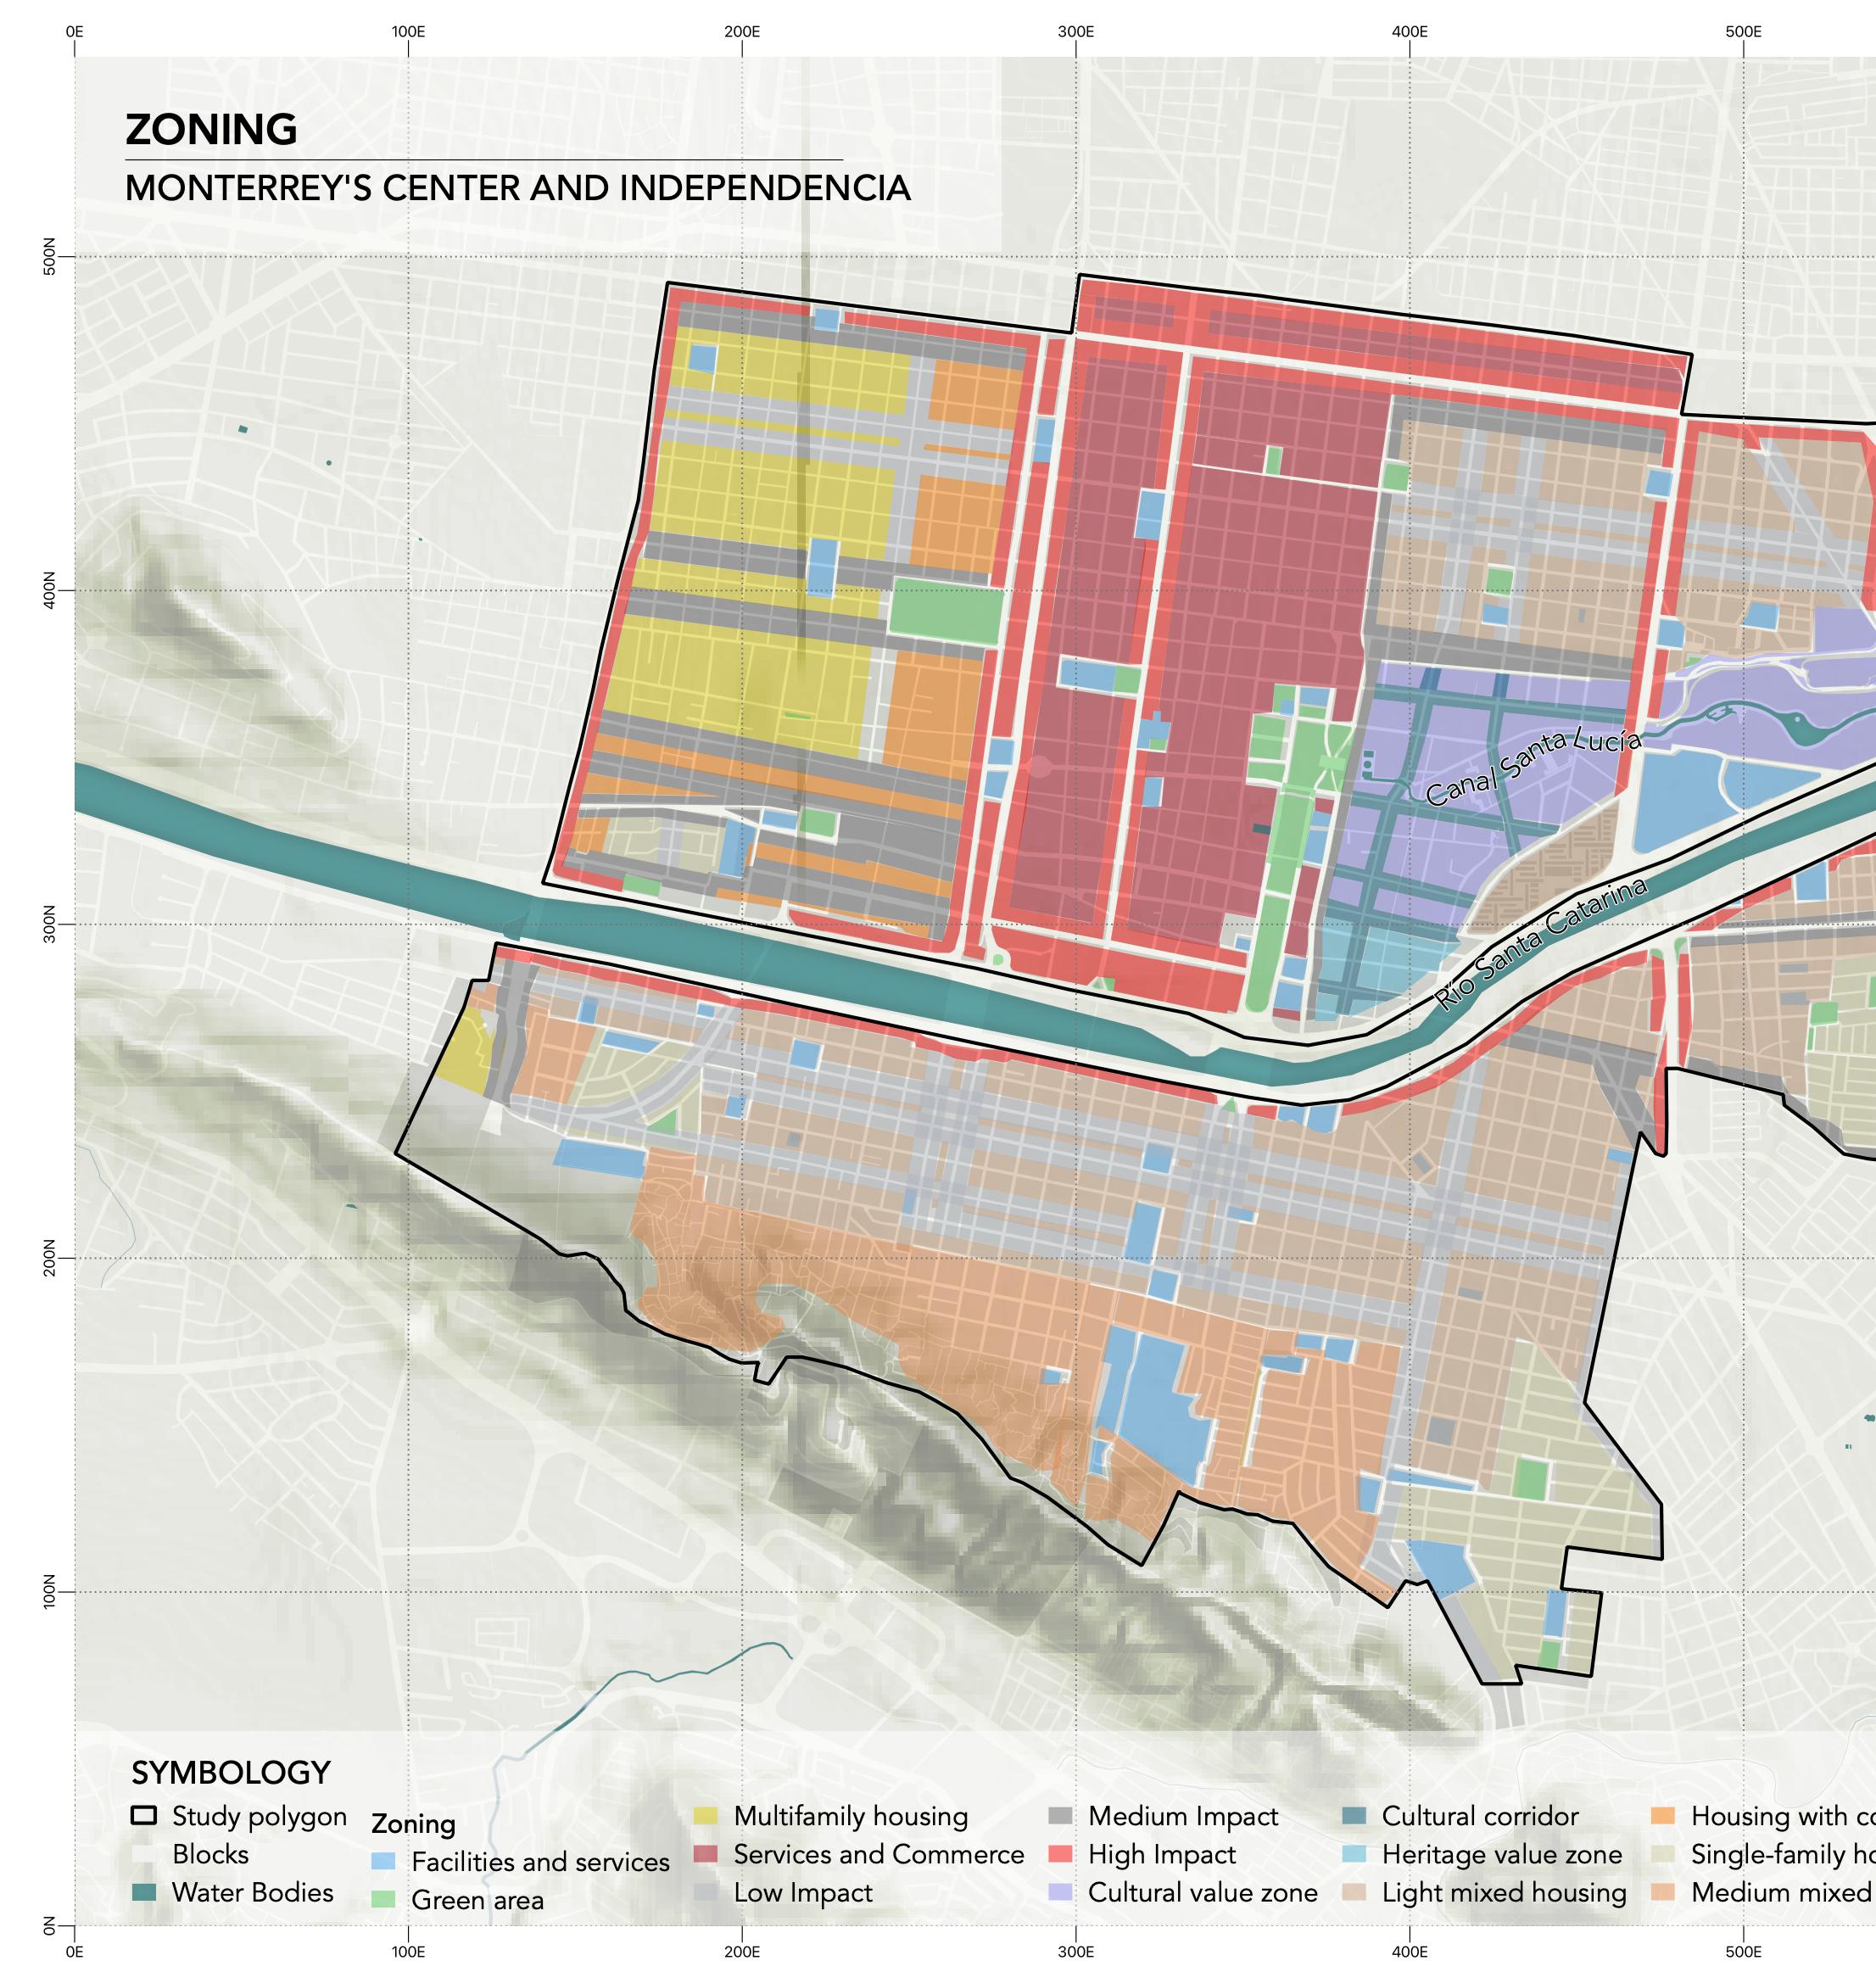
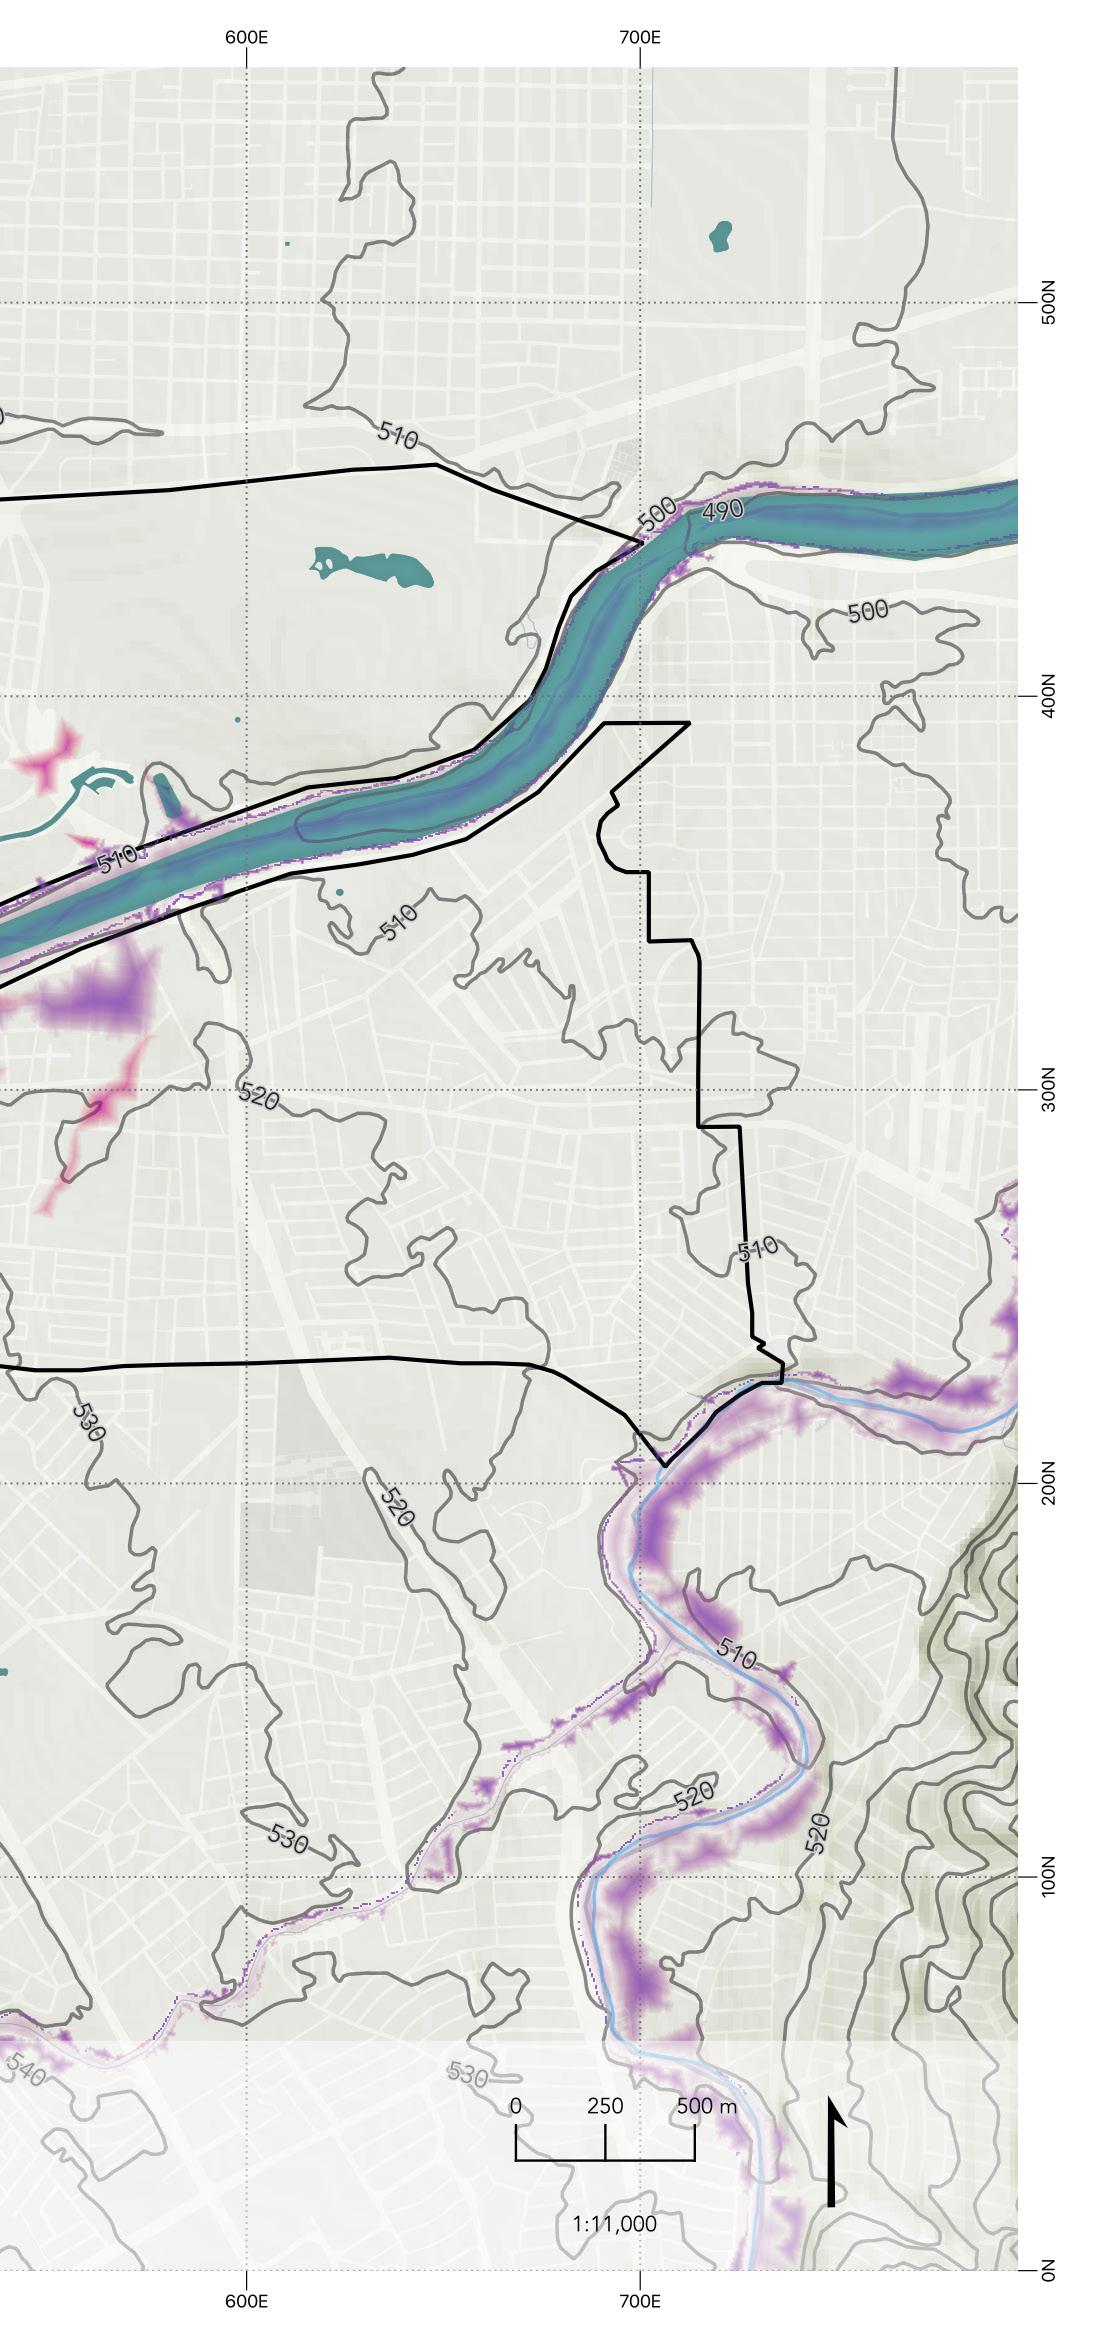
44
“The blocks are divided into different land uses, which makes the housing zones have facilities and services nearby.”
Elaborated by Ana Cepeda with information from INEGI (2021)
About zoning, we can say that it is diverse. The map to the left shows that the blocks are divided into different land uses, which makes the housing zones have facilities and services nearby.
The different predominant zones are surrounded by high, medium, and low impact corridors, which means that walking is an important method of transportation that needs to be classified.
45
46 1 2 3
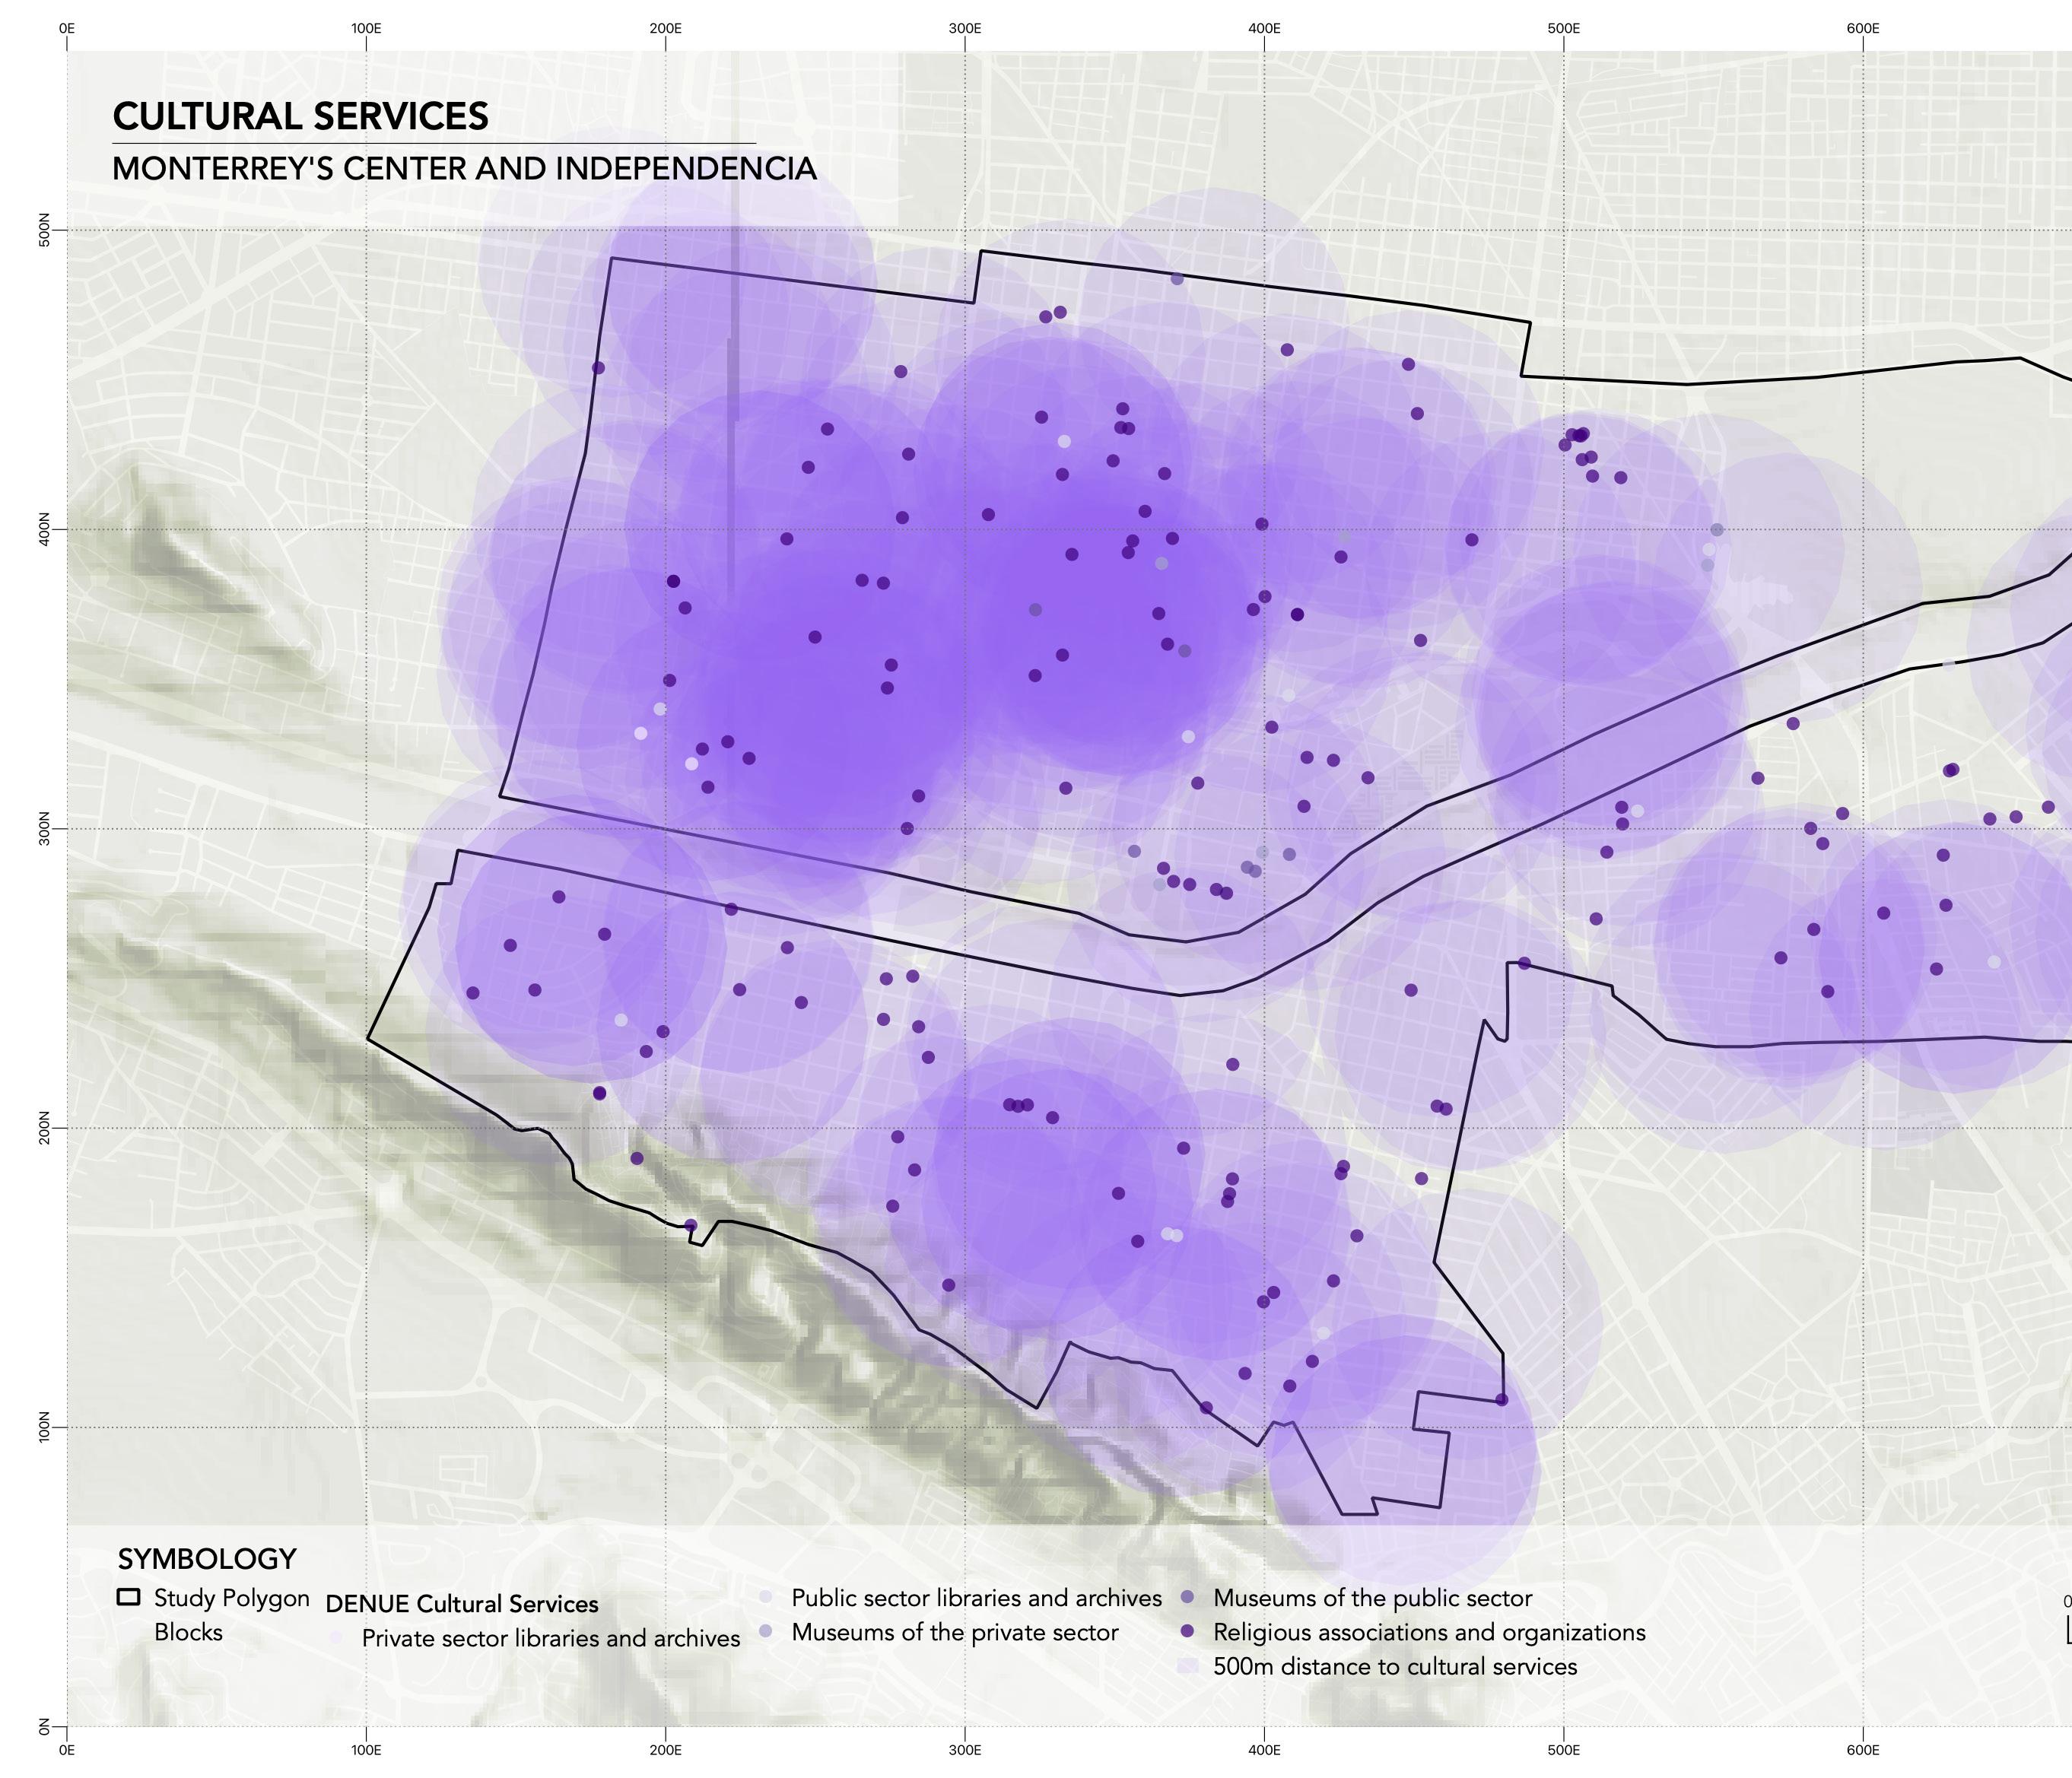
Map elaborated by Ana Cepeda with data from DENUE (2020)
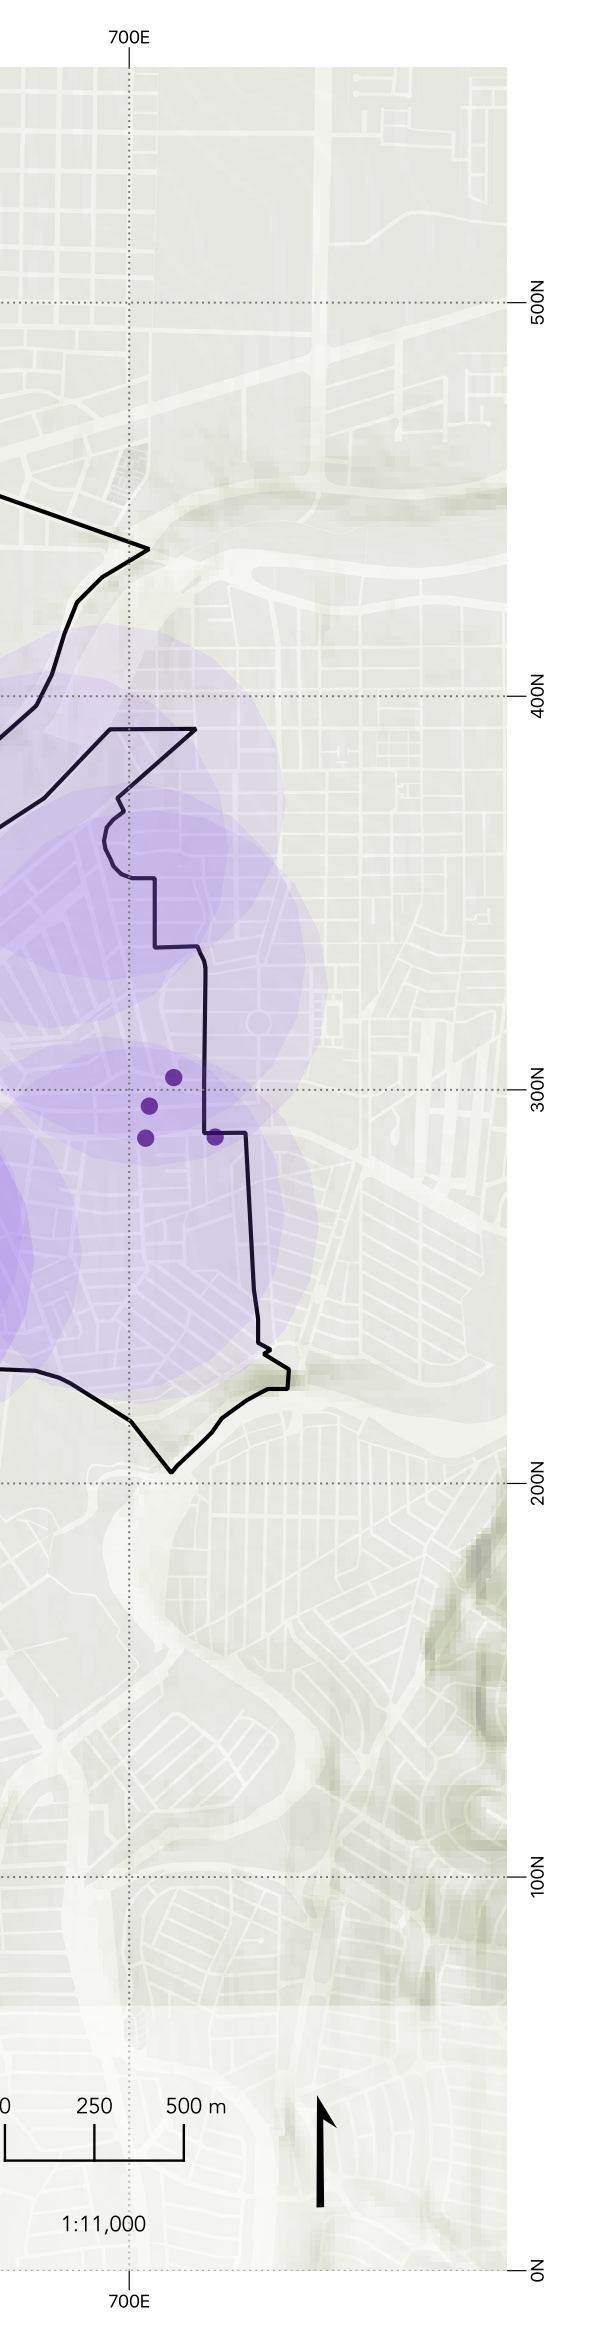
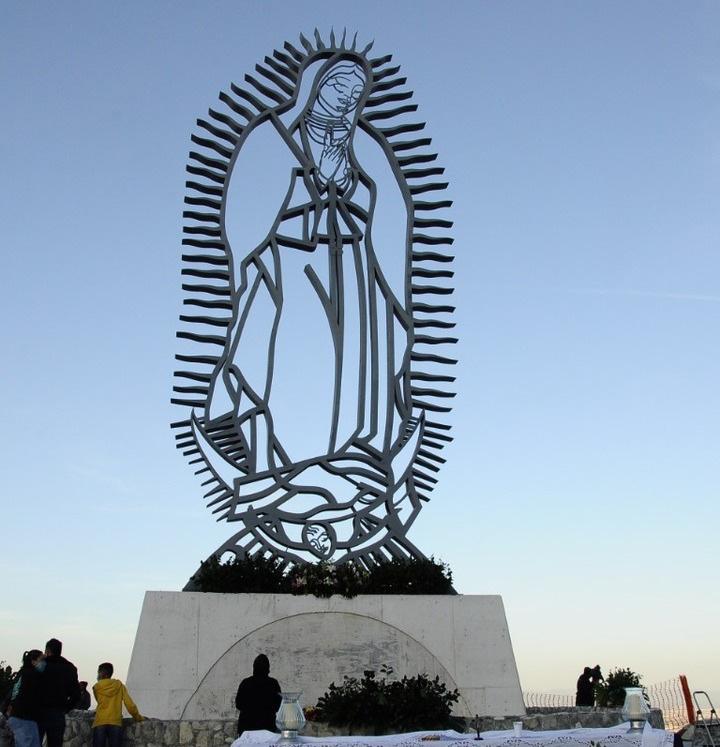
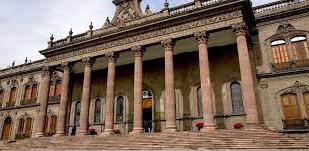
Presenting libraries, museums, and religious associations and organizations. The major concentration of these services is in the Center of Monterrey. For both, north and south of the Santa Catarina river, there’s a predominance of religious associations and organizations, and museums in the public sector. There is a lack of libraries in both sectors, private and public. These cultural services represent the main reason that makes nonhabitants plan to visit Monterrey’s Center.
facilities and services
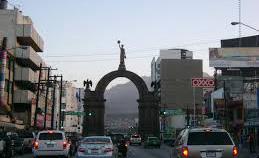
1. Virgen de Guadalupe’s Monument. Source: El Horizonte
2. Government Palace. Source: 3museos.mx
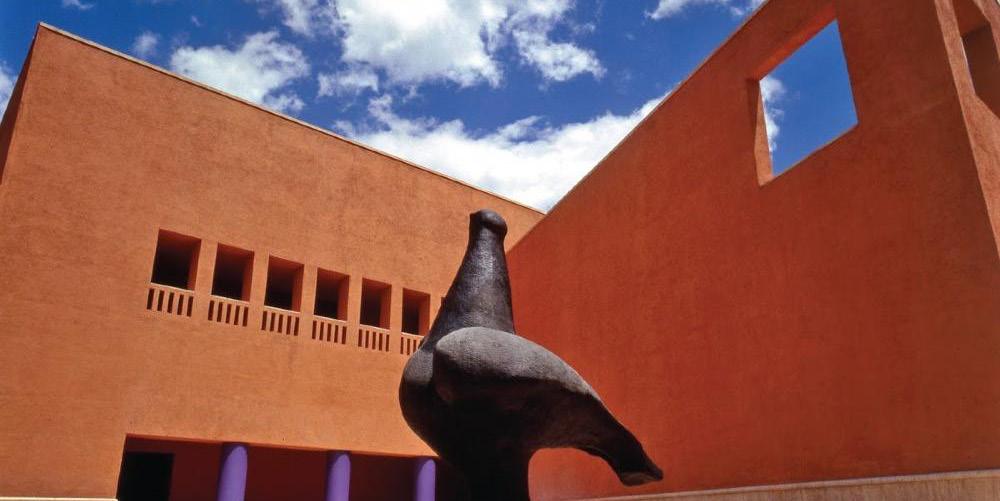
3. Museo de Arte Contemporáneo. Source: Legorreta.mx
47
“This cultural services represents the main reason that makes non habitants plan to visit Monterrey’s Center.”
48 Office
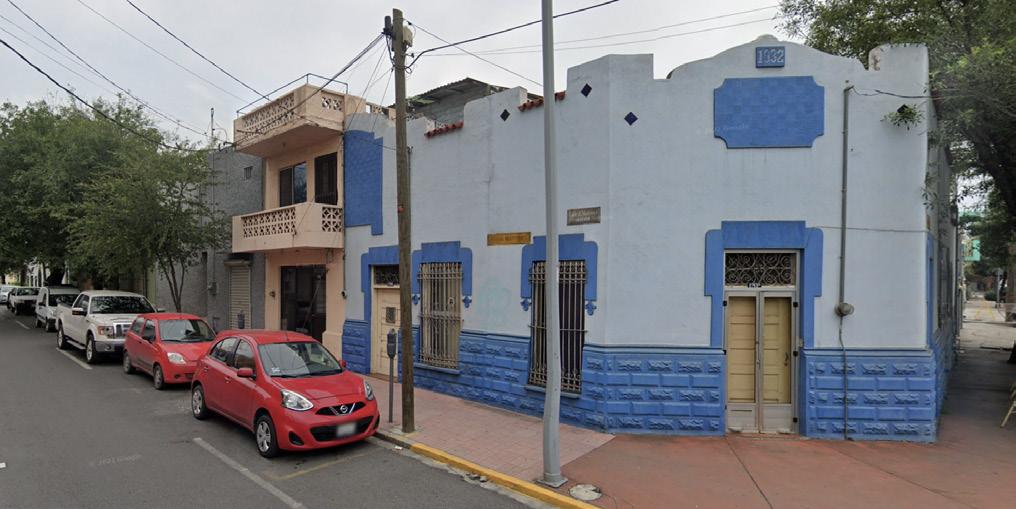
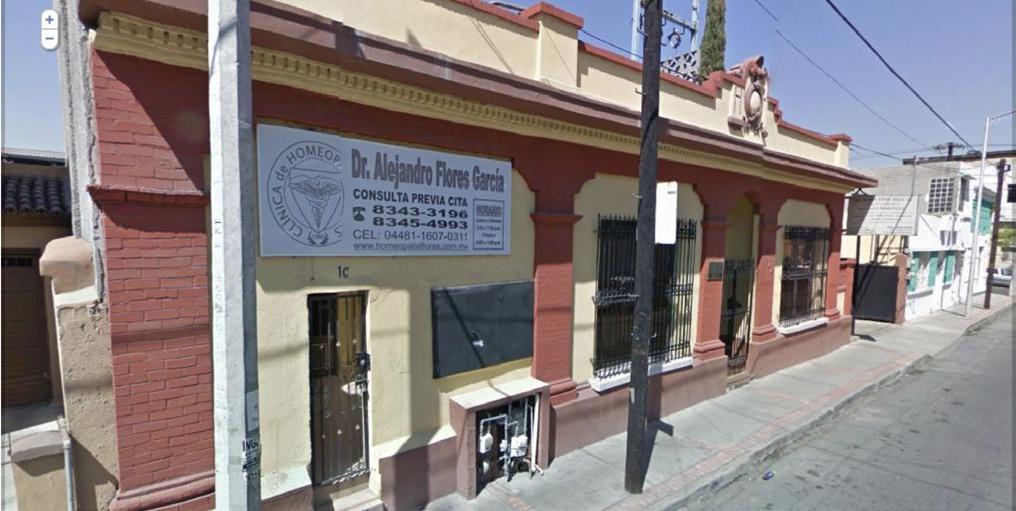
clinic Alejandro Flores.
Source:
Google Maps
Office
Clinic Dr. Eliud
Gerardo
Alcalá Gámez, Internista.
Source:
Google Maps
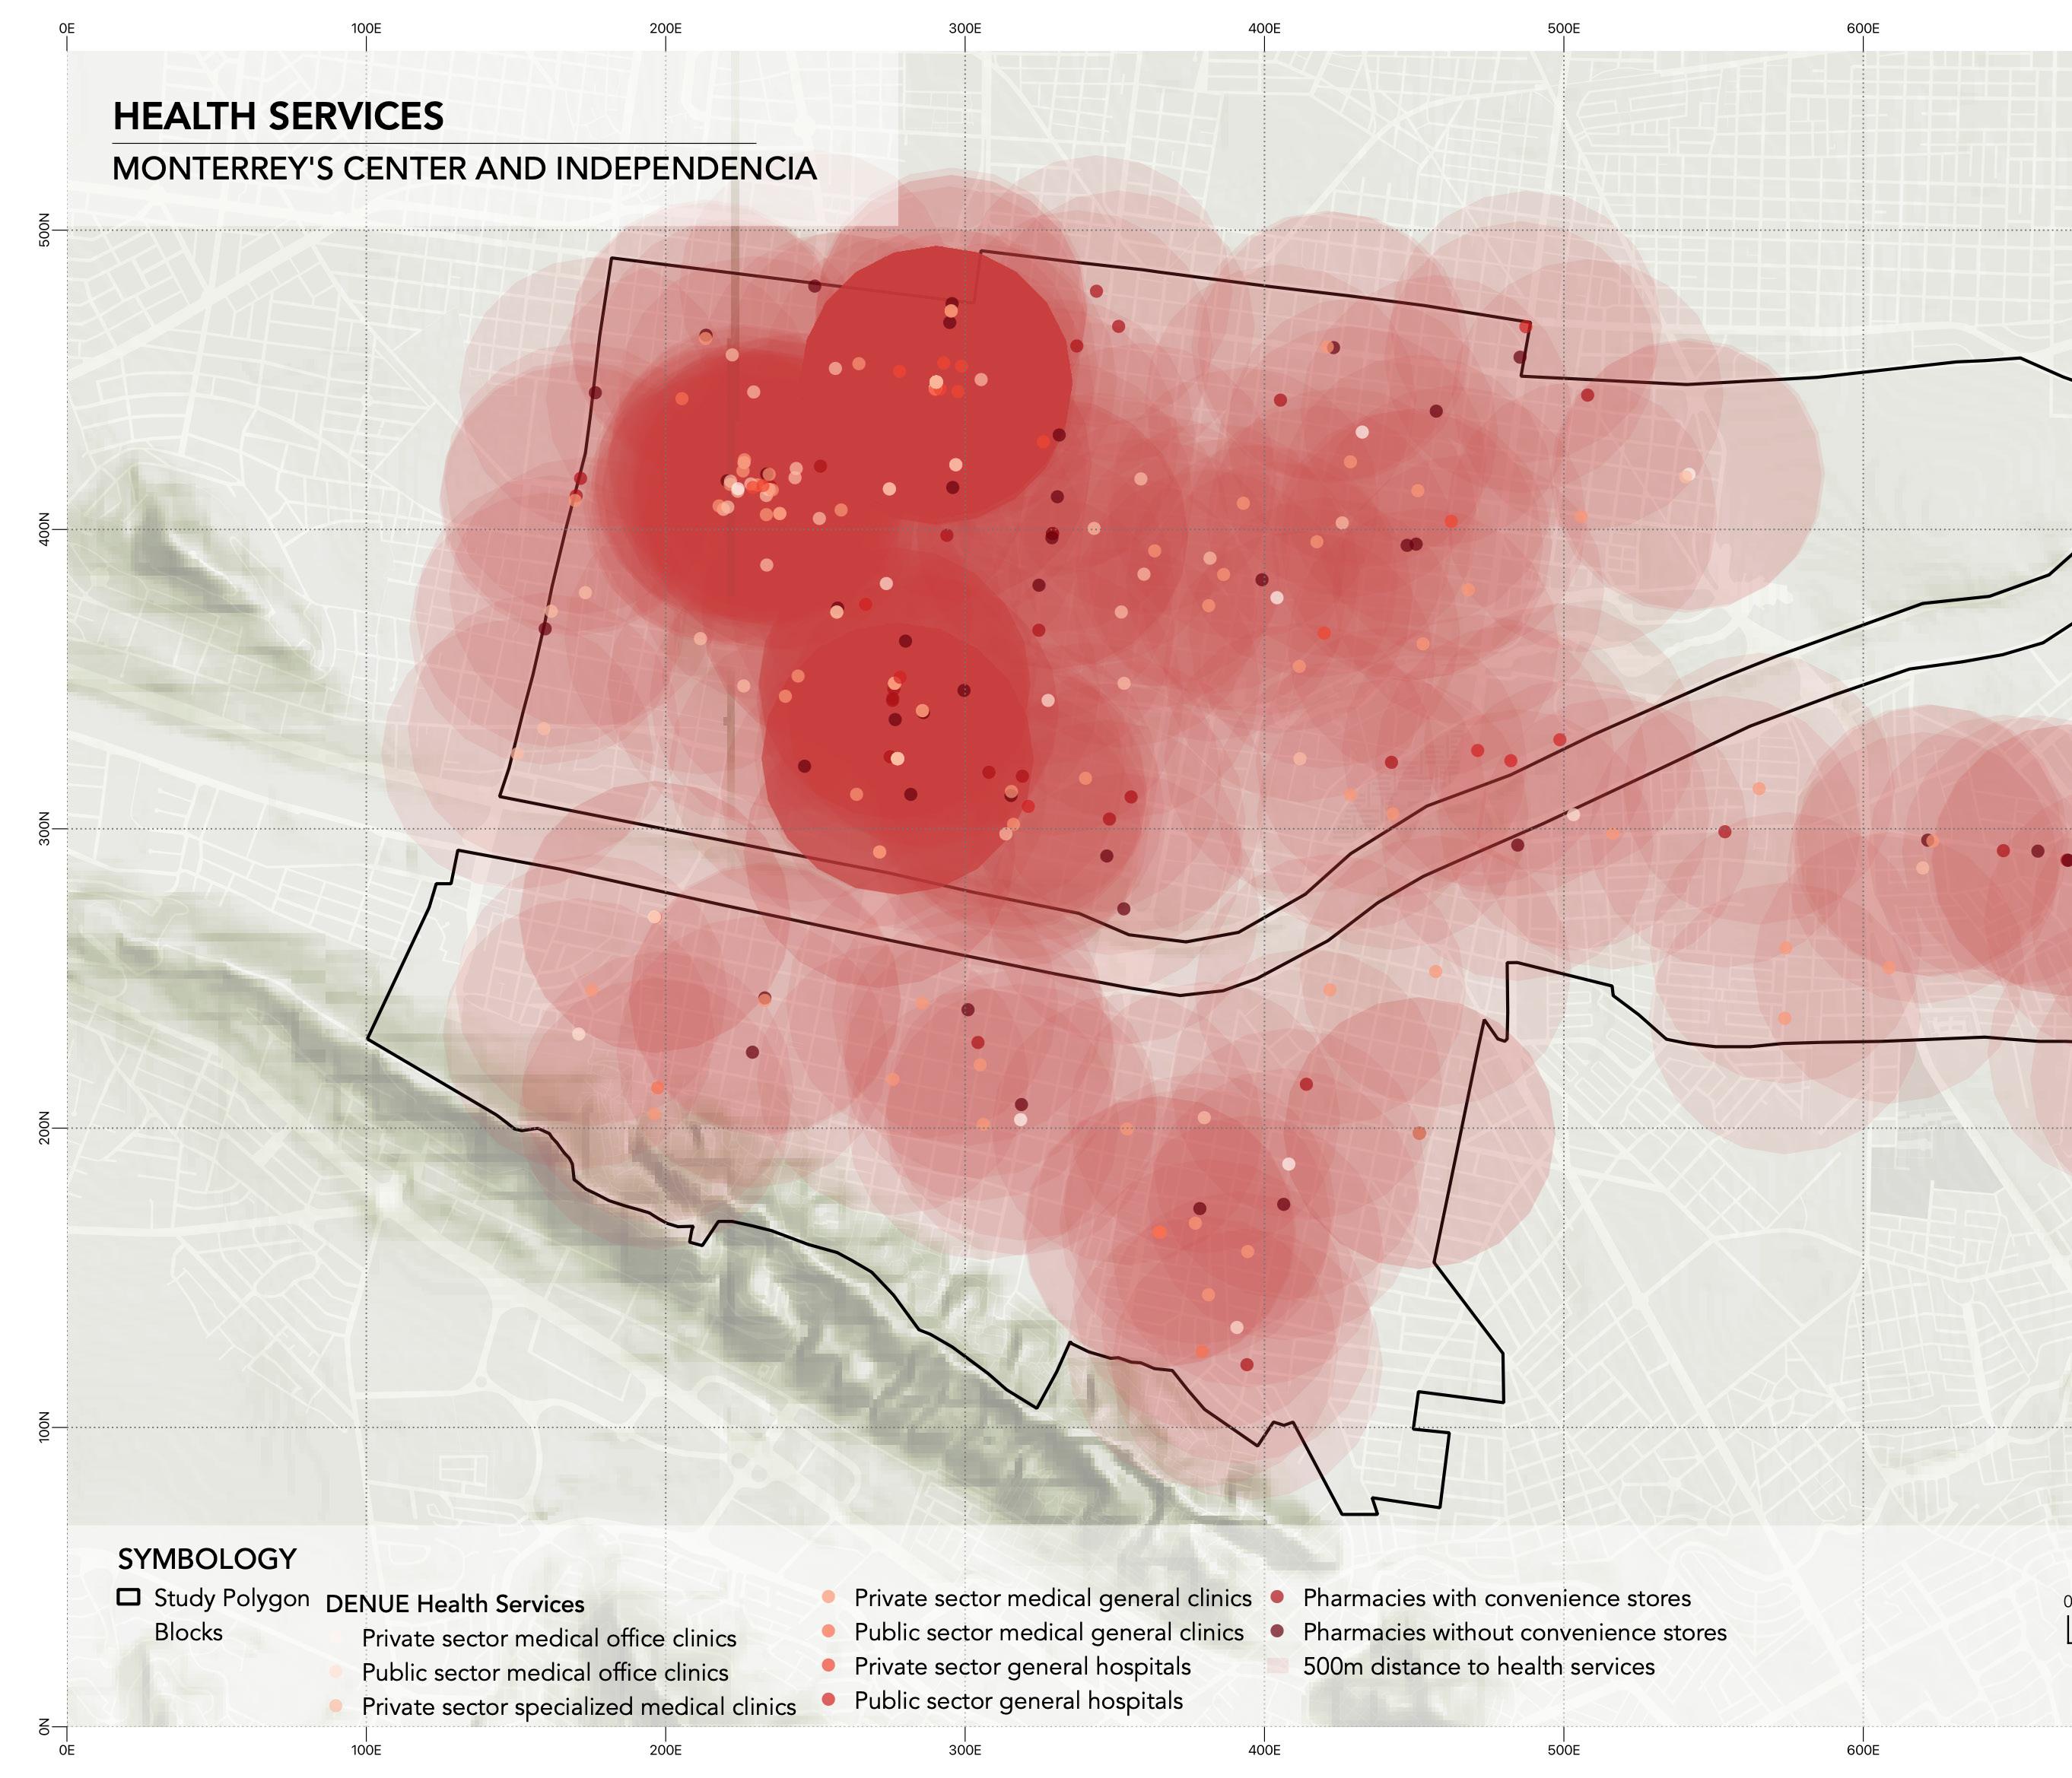
About Health Services we can see a variety of them such as clinics with a specialization or general attention, hospitals, and pharmacies with or without convenience stores. The concentration of services is mainly in Monterrey’s Center, and there’s a lack of them in Independencia.
Regarding office clinics, in Monterrey’s Center, there are so many that were opened in past generations, and we can see it in the architecture of the buildings.
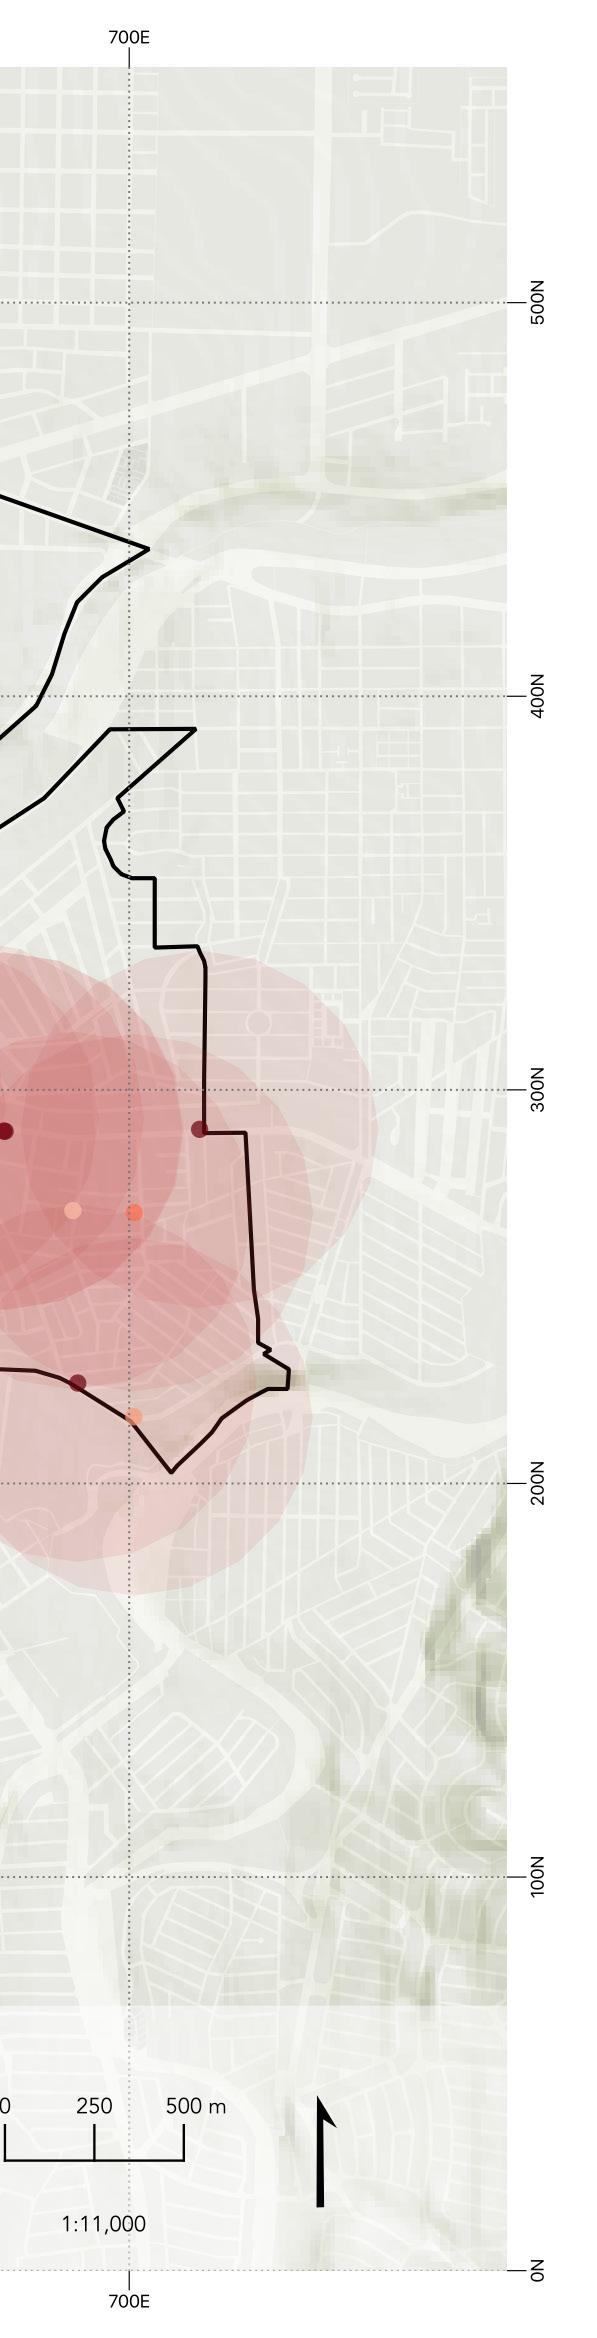
FACILITIES AND SERVICES
49
Map elaborated by Ana Cepeda with data from DENUE
50
Secondary School Num. 4 Miguel Alemán. Source: Google Maps.
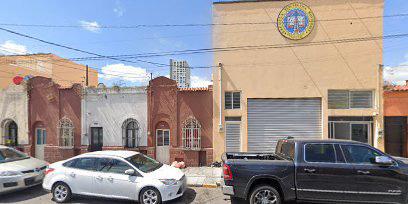
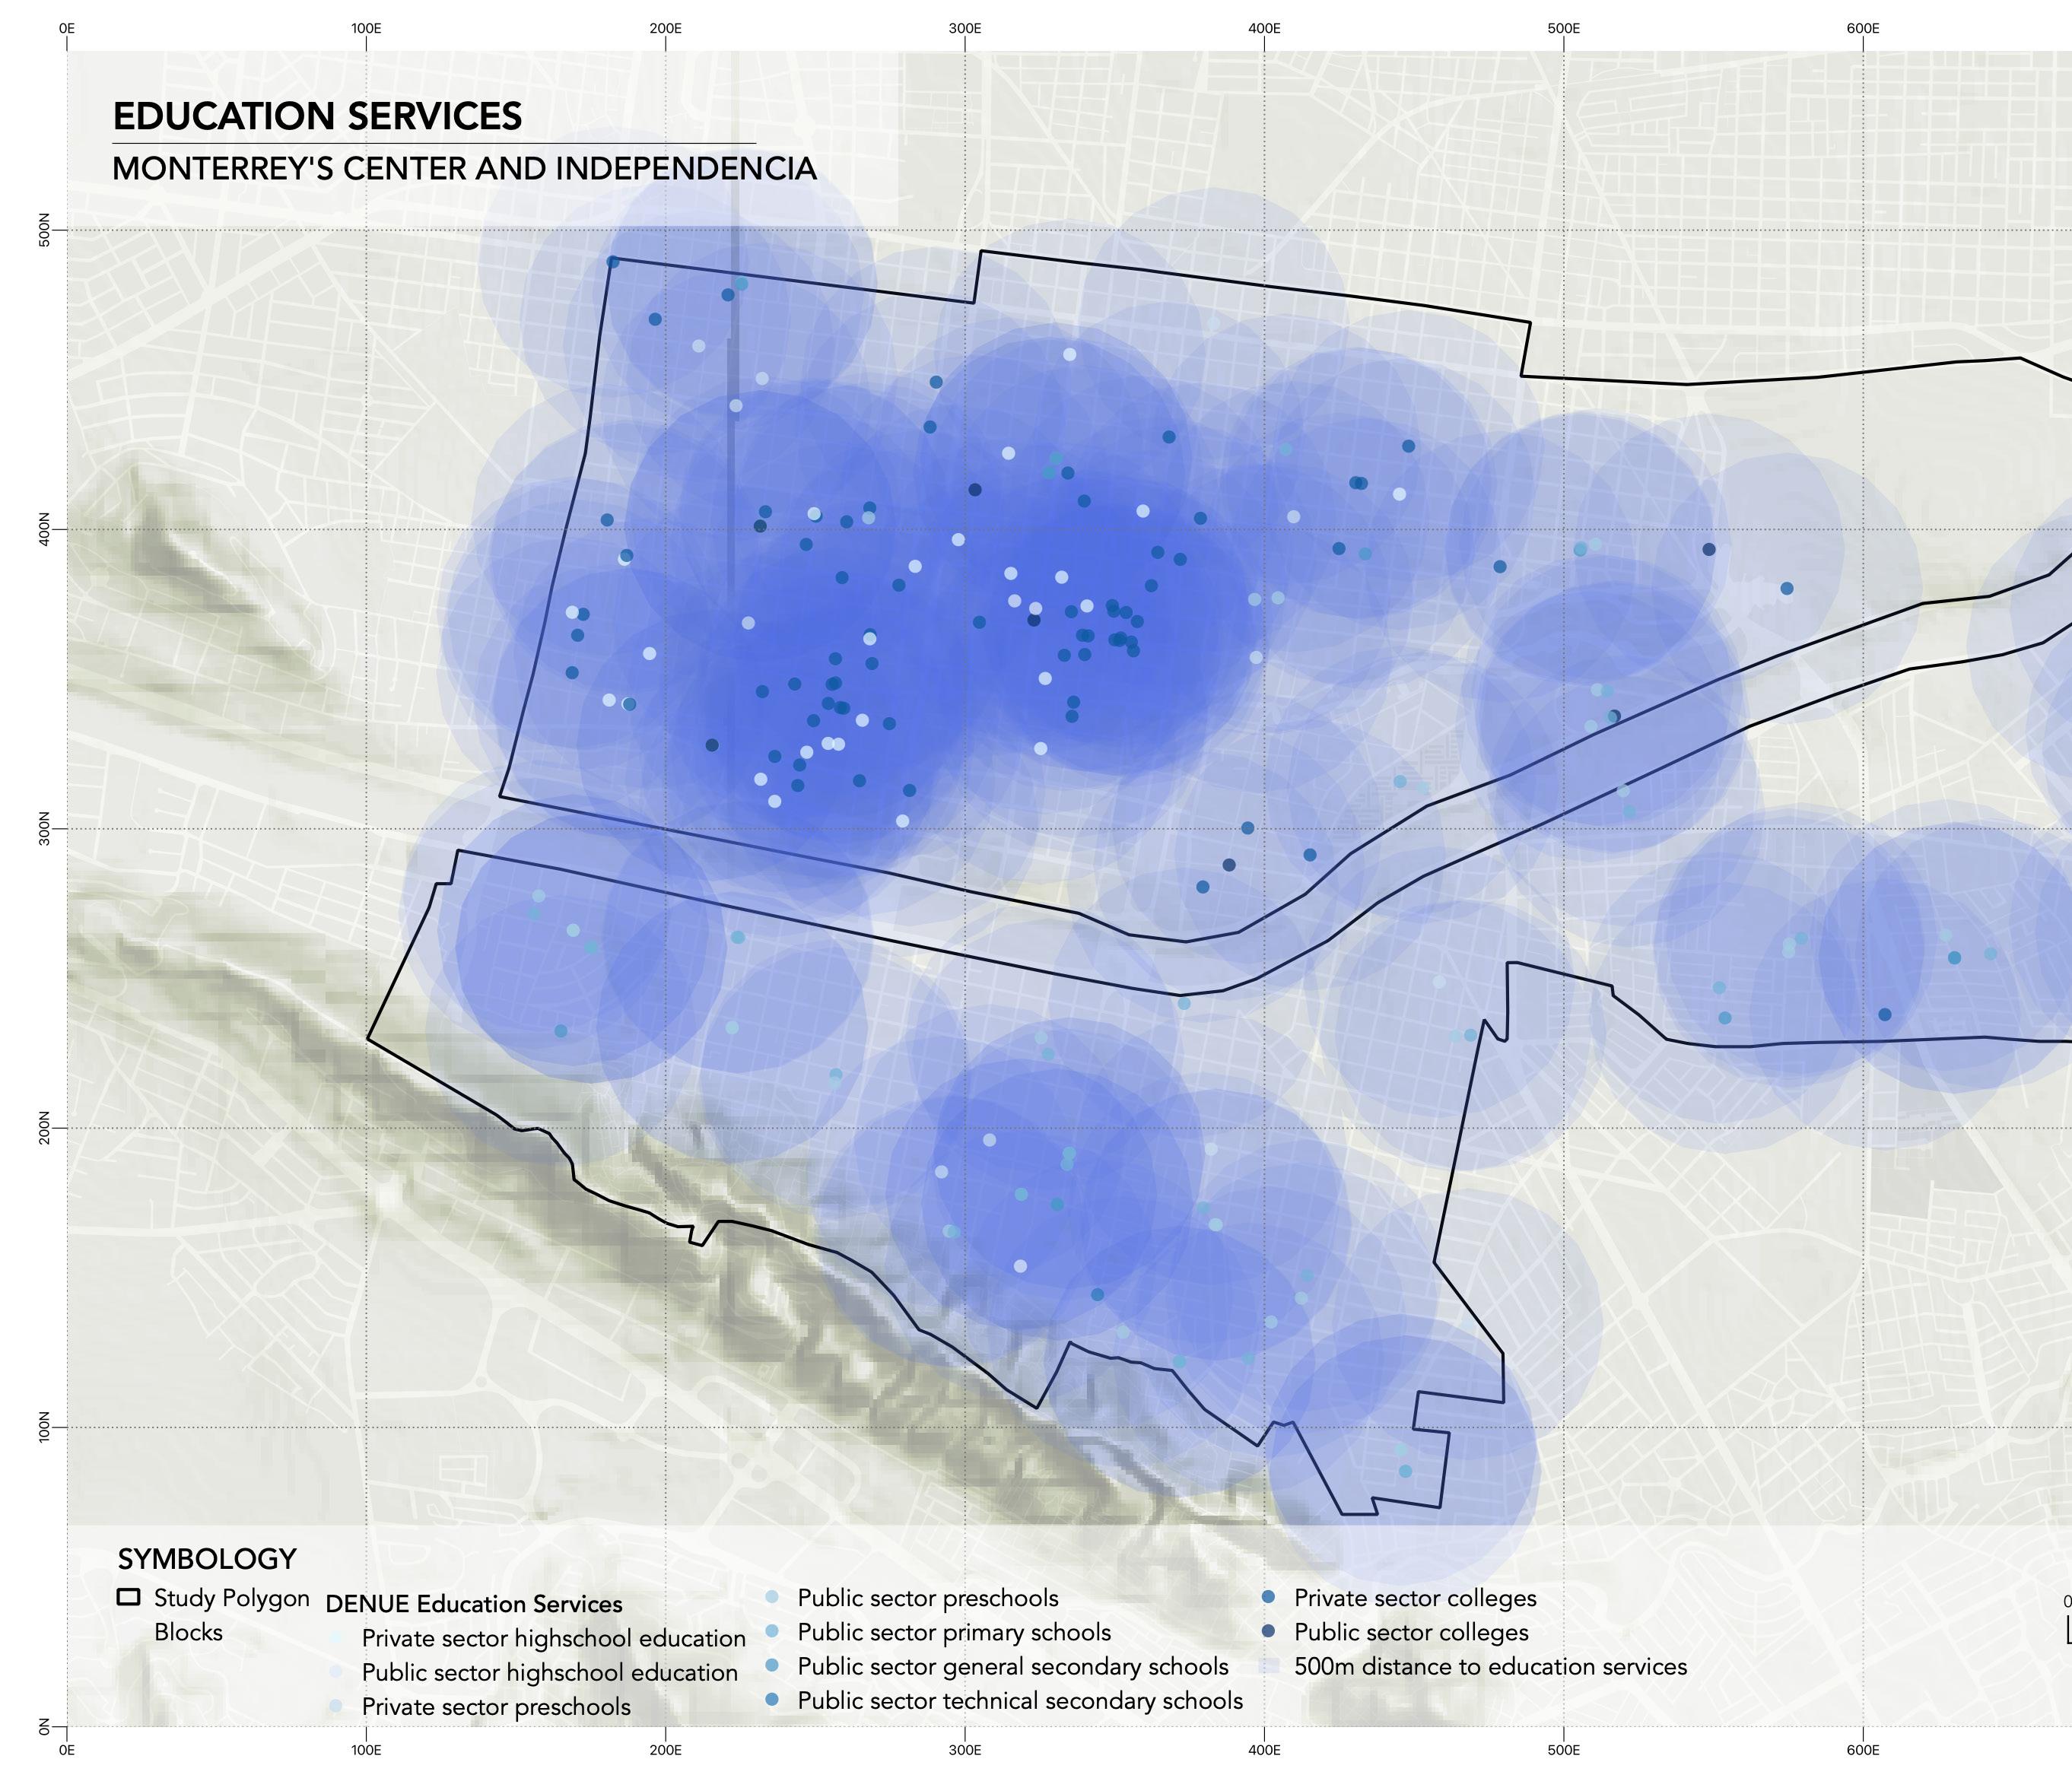
Regarding educational services we can see a high concentration of them in Monterrey’s city center on different levels but specifically in the commercial land use, showing a high concentration of these services in Monterrey’s City Center and a lack of them in Independencia and to the East of the polygon.
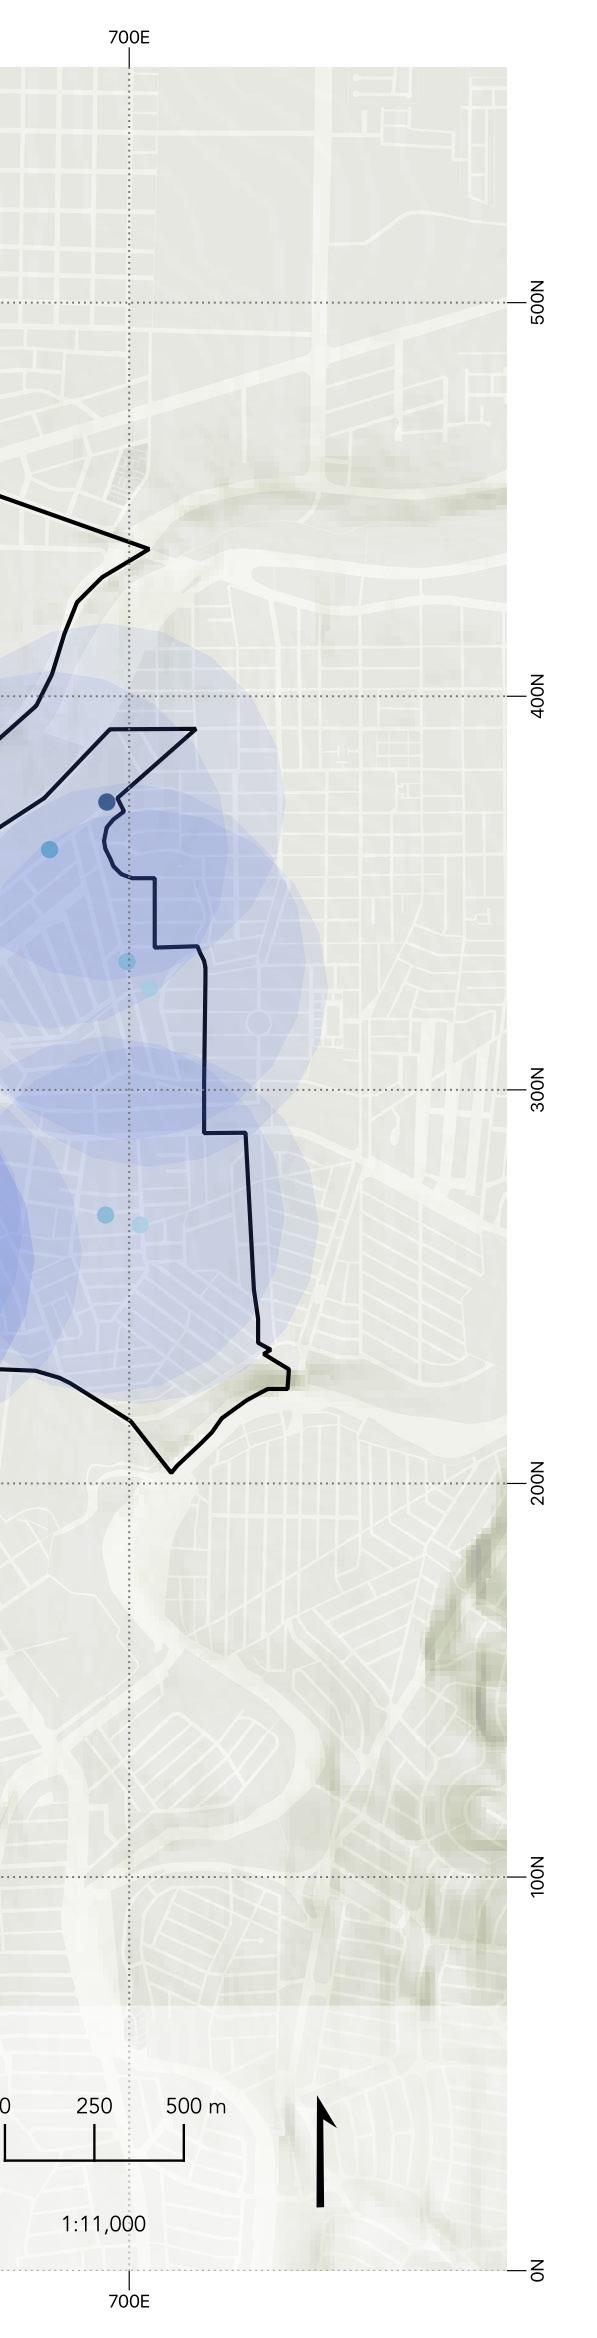
FACILITIES AND SERVICES
51
Map elaborated by Ana Cepeda with data from DENUE
52
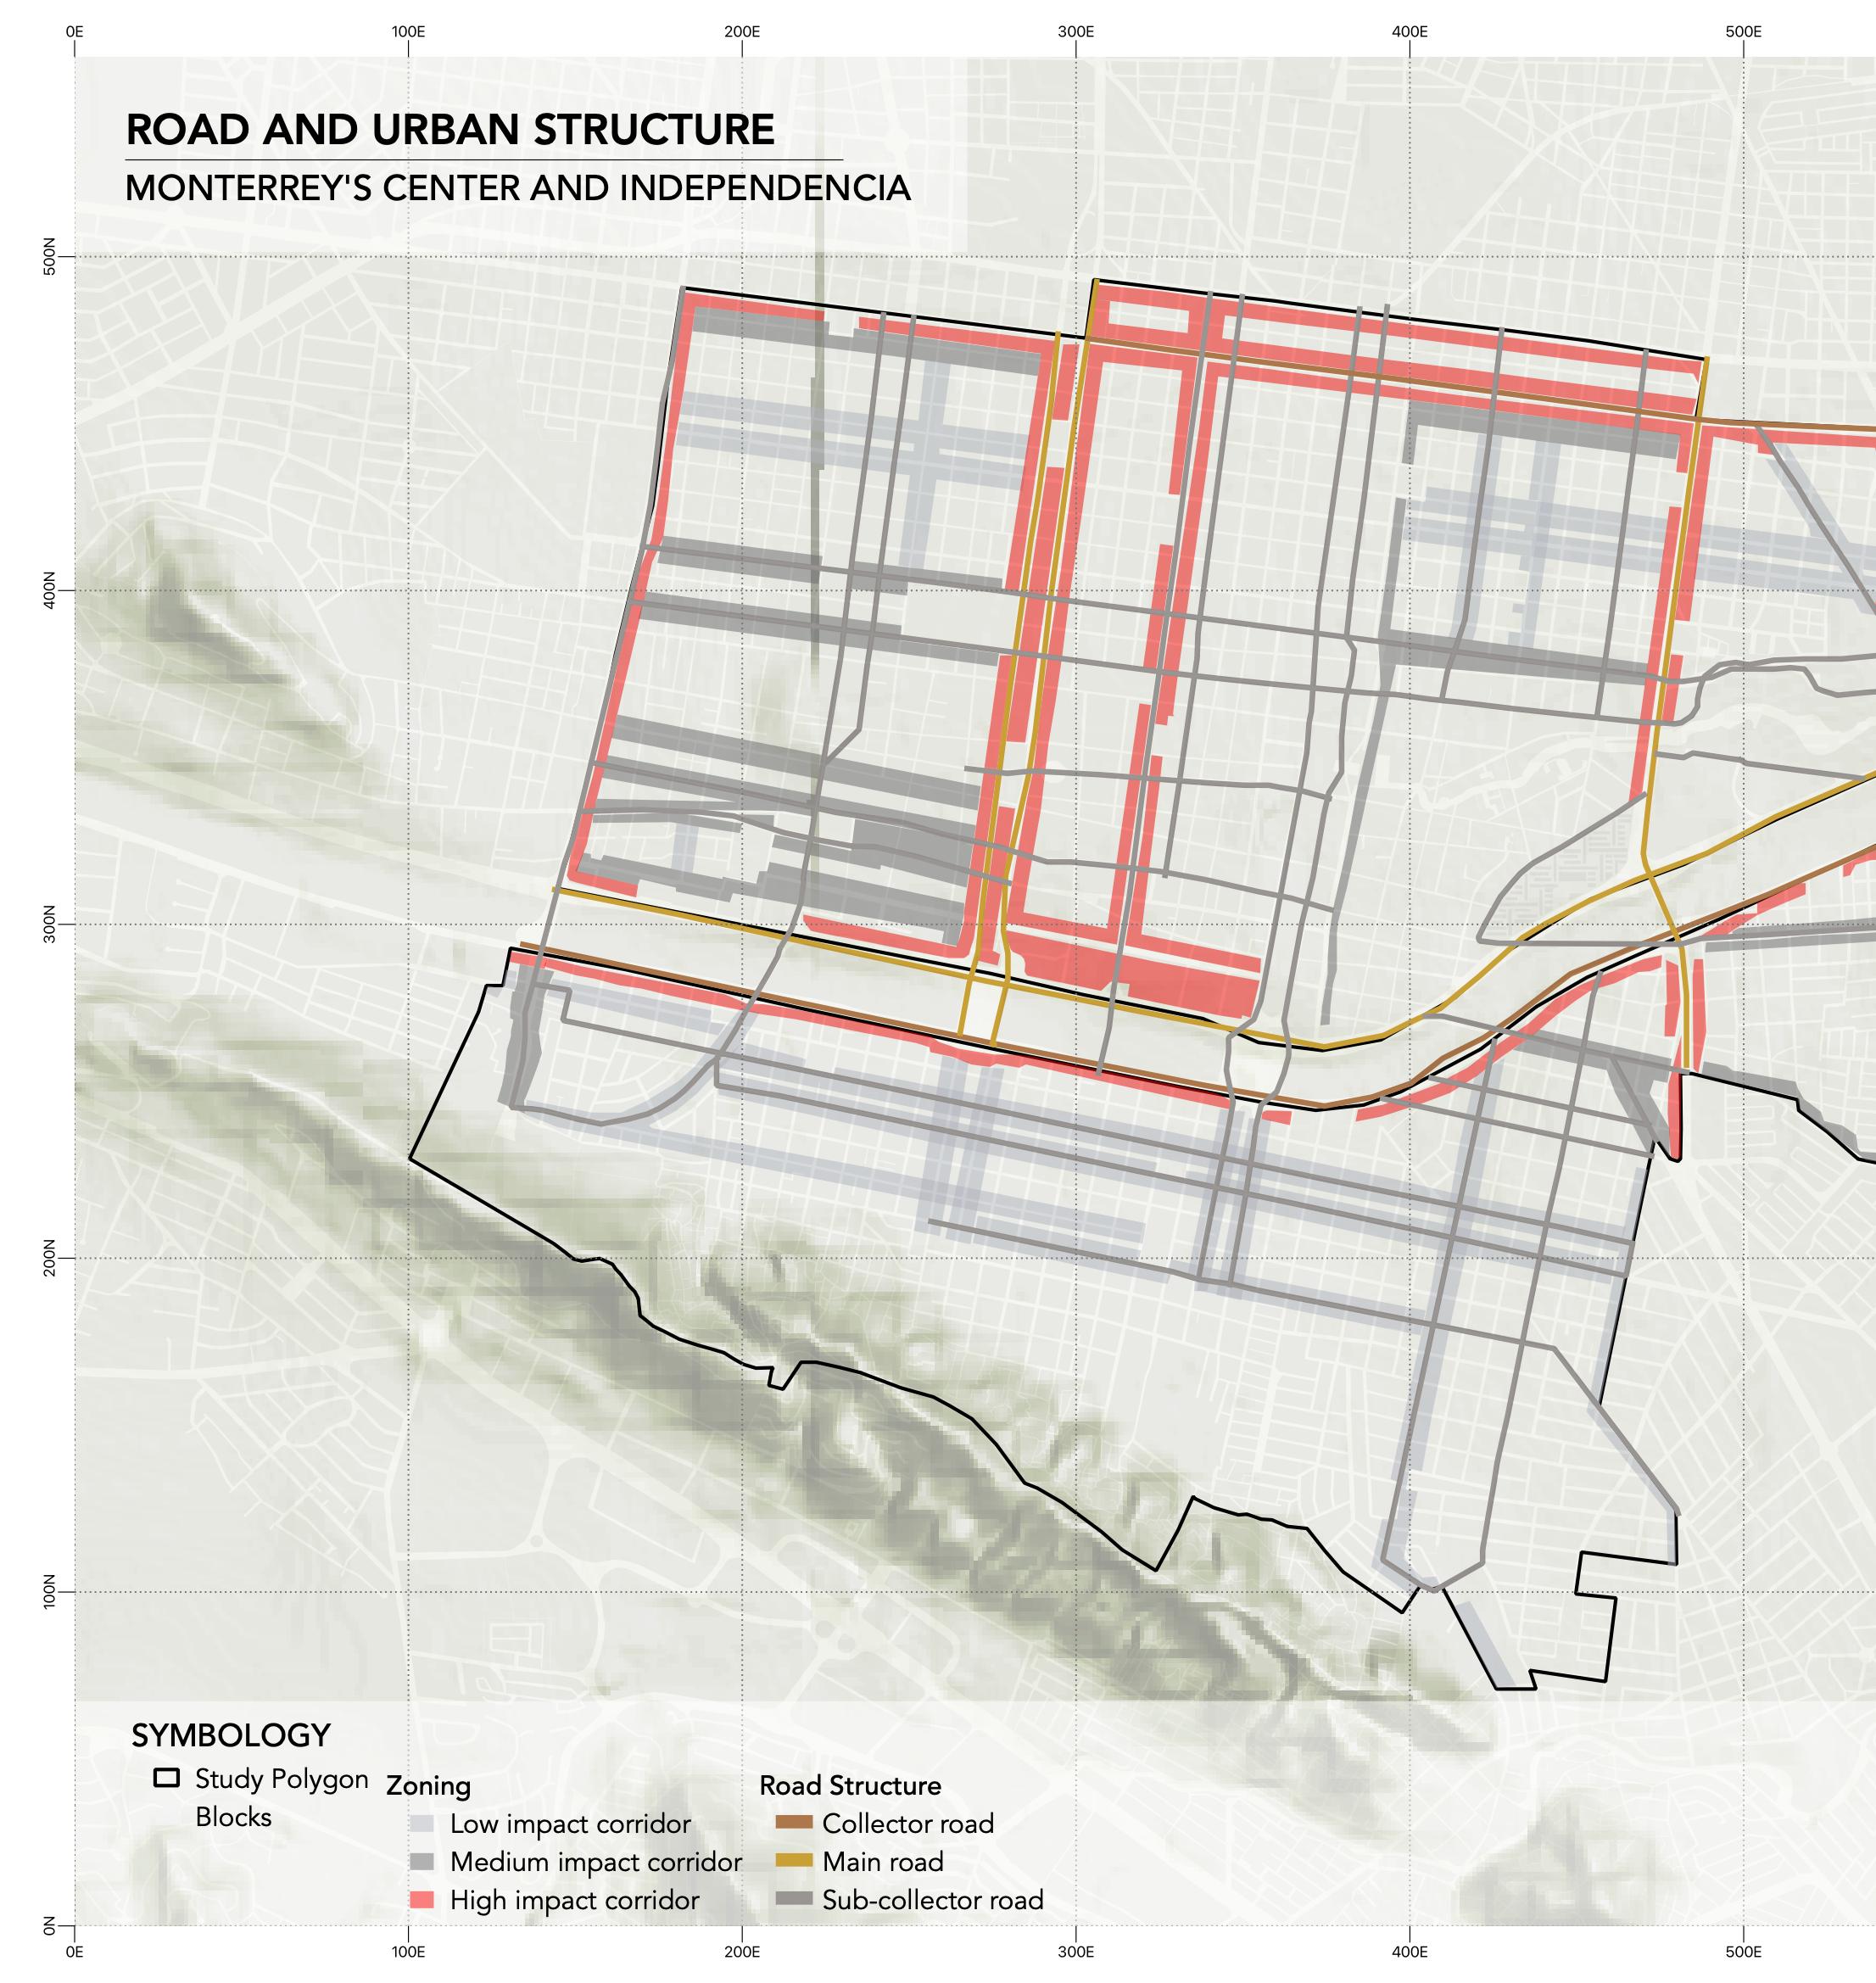
“Because of the connection to a different districts, centers and subcenters, the corridors have different pedestrian and vehicular traffic.”
road and urban structure
Elaborated by Ana Cepeda with information from IMPLAN MTY (2013)
As we saw in the zoning topic, there are corridors which means that there are centers and subcenters being connected by these certain streets, also means that there is combined land use, mainly by commerce, services, and housing. (IMPLAN, 2013).
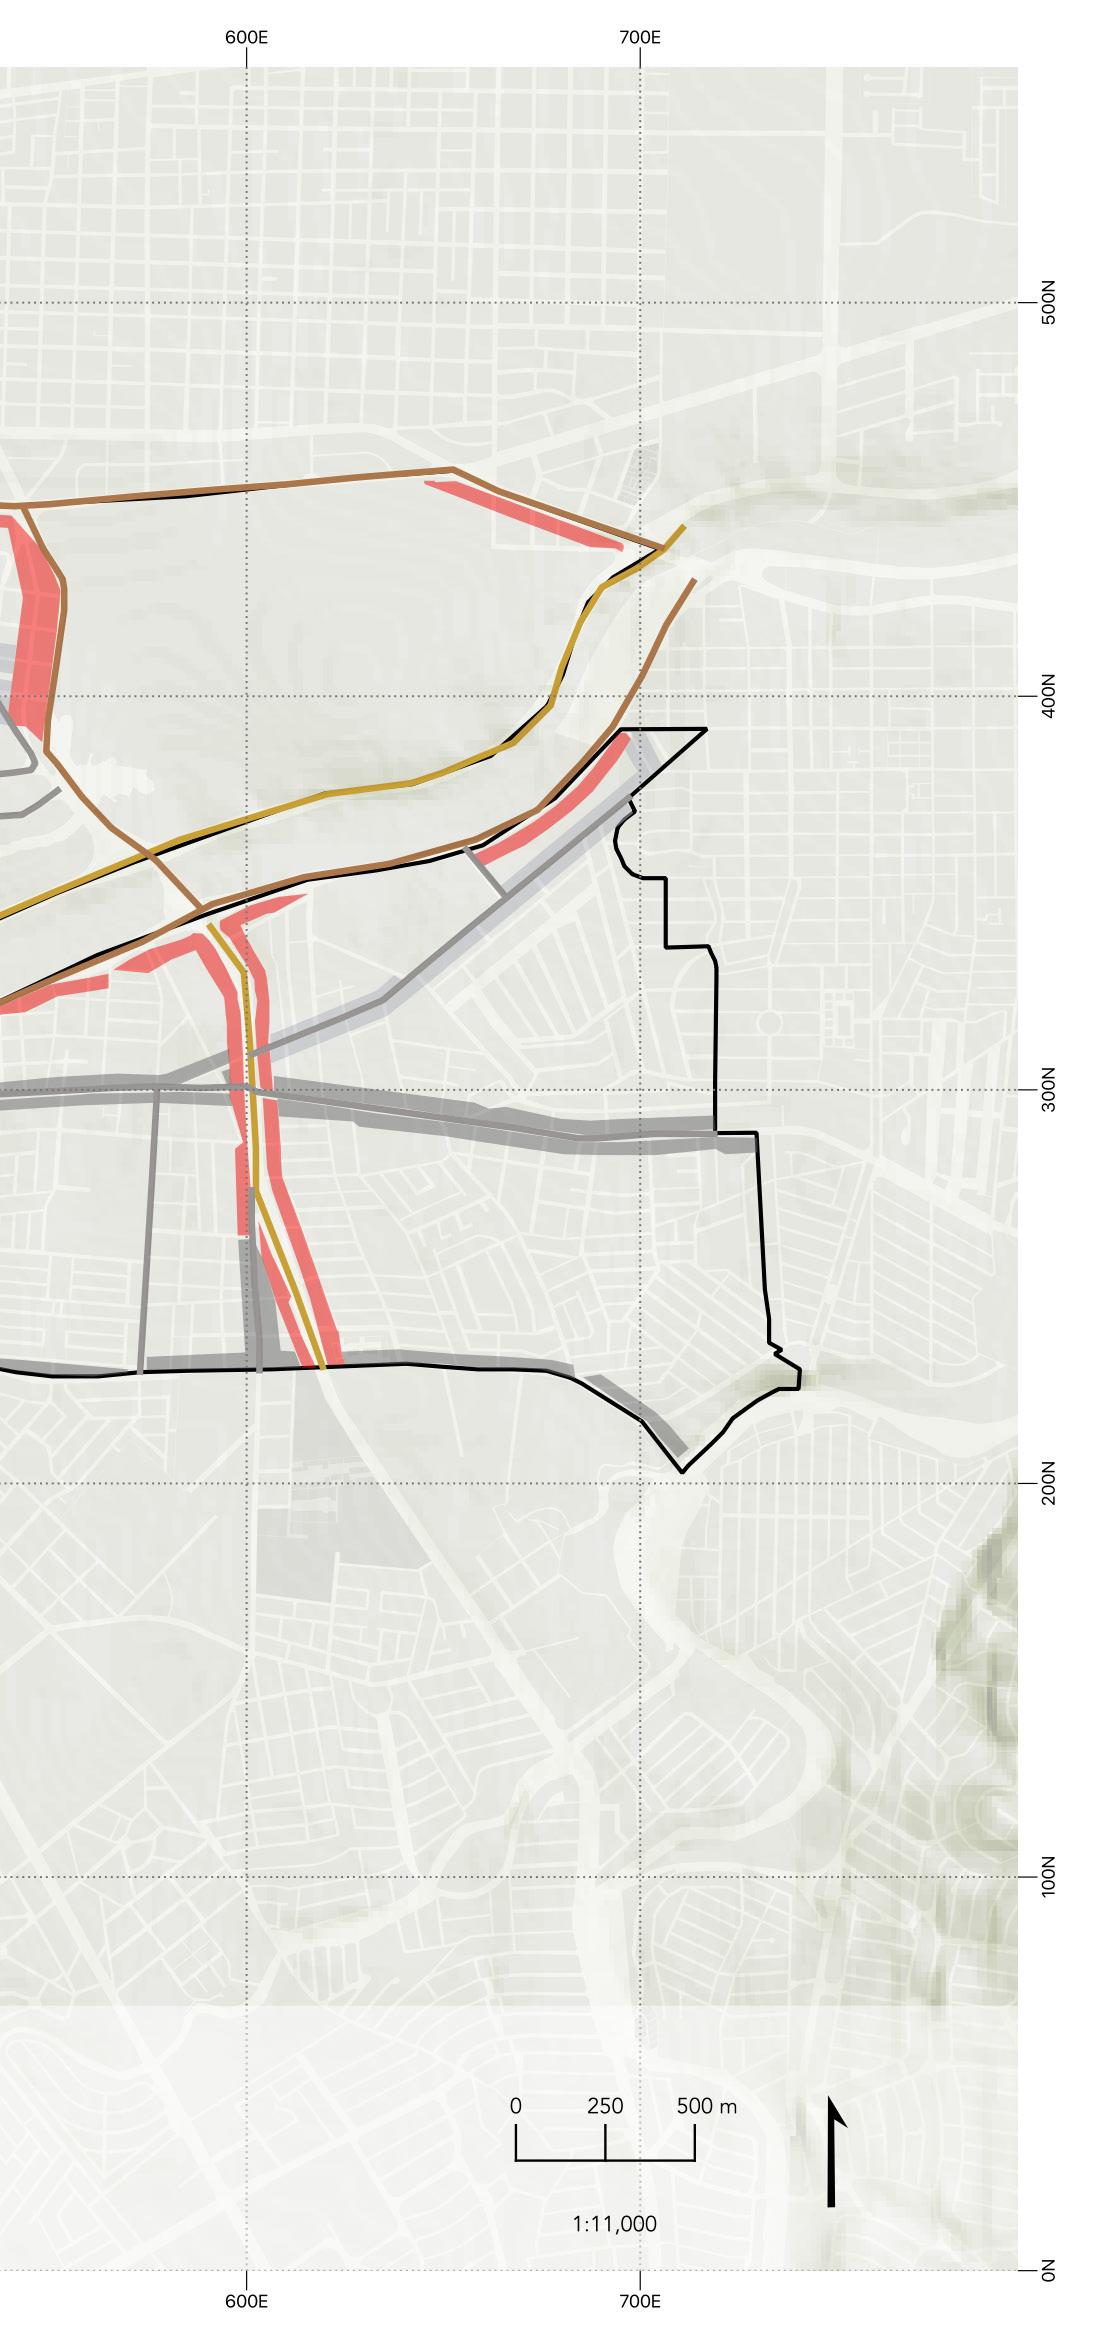
Because of the connection to different districts, centers, and subcenters, the corridors have different pedestrian and vehicular traffic.
This gives us information about the use of certain streets, cause even though there may be main roads, there can be more busy roads.
53
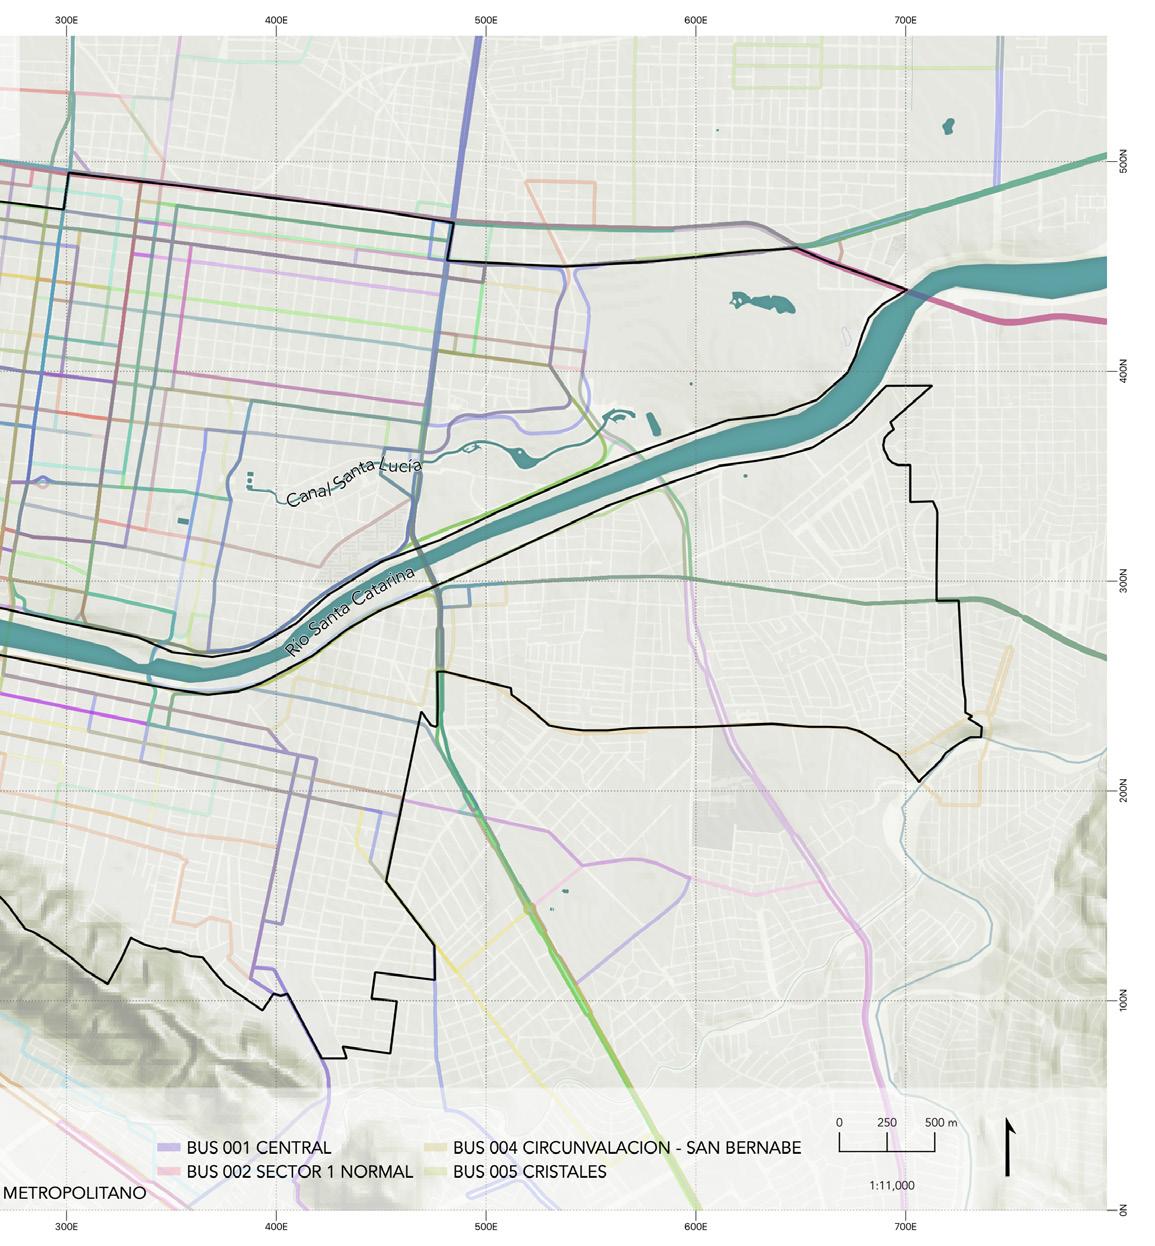
bus lines
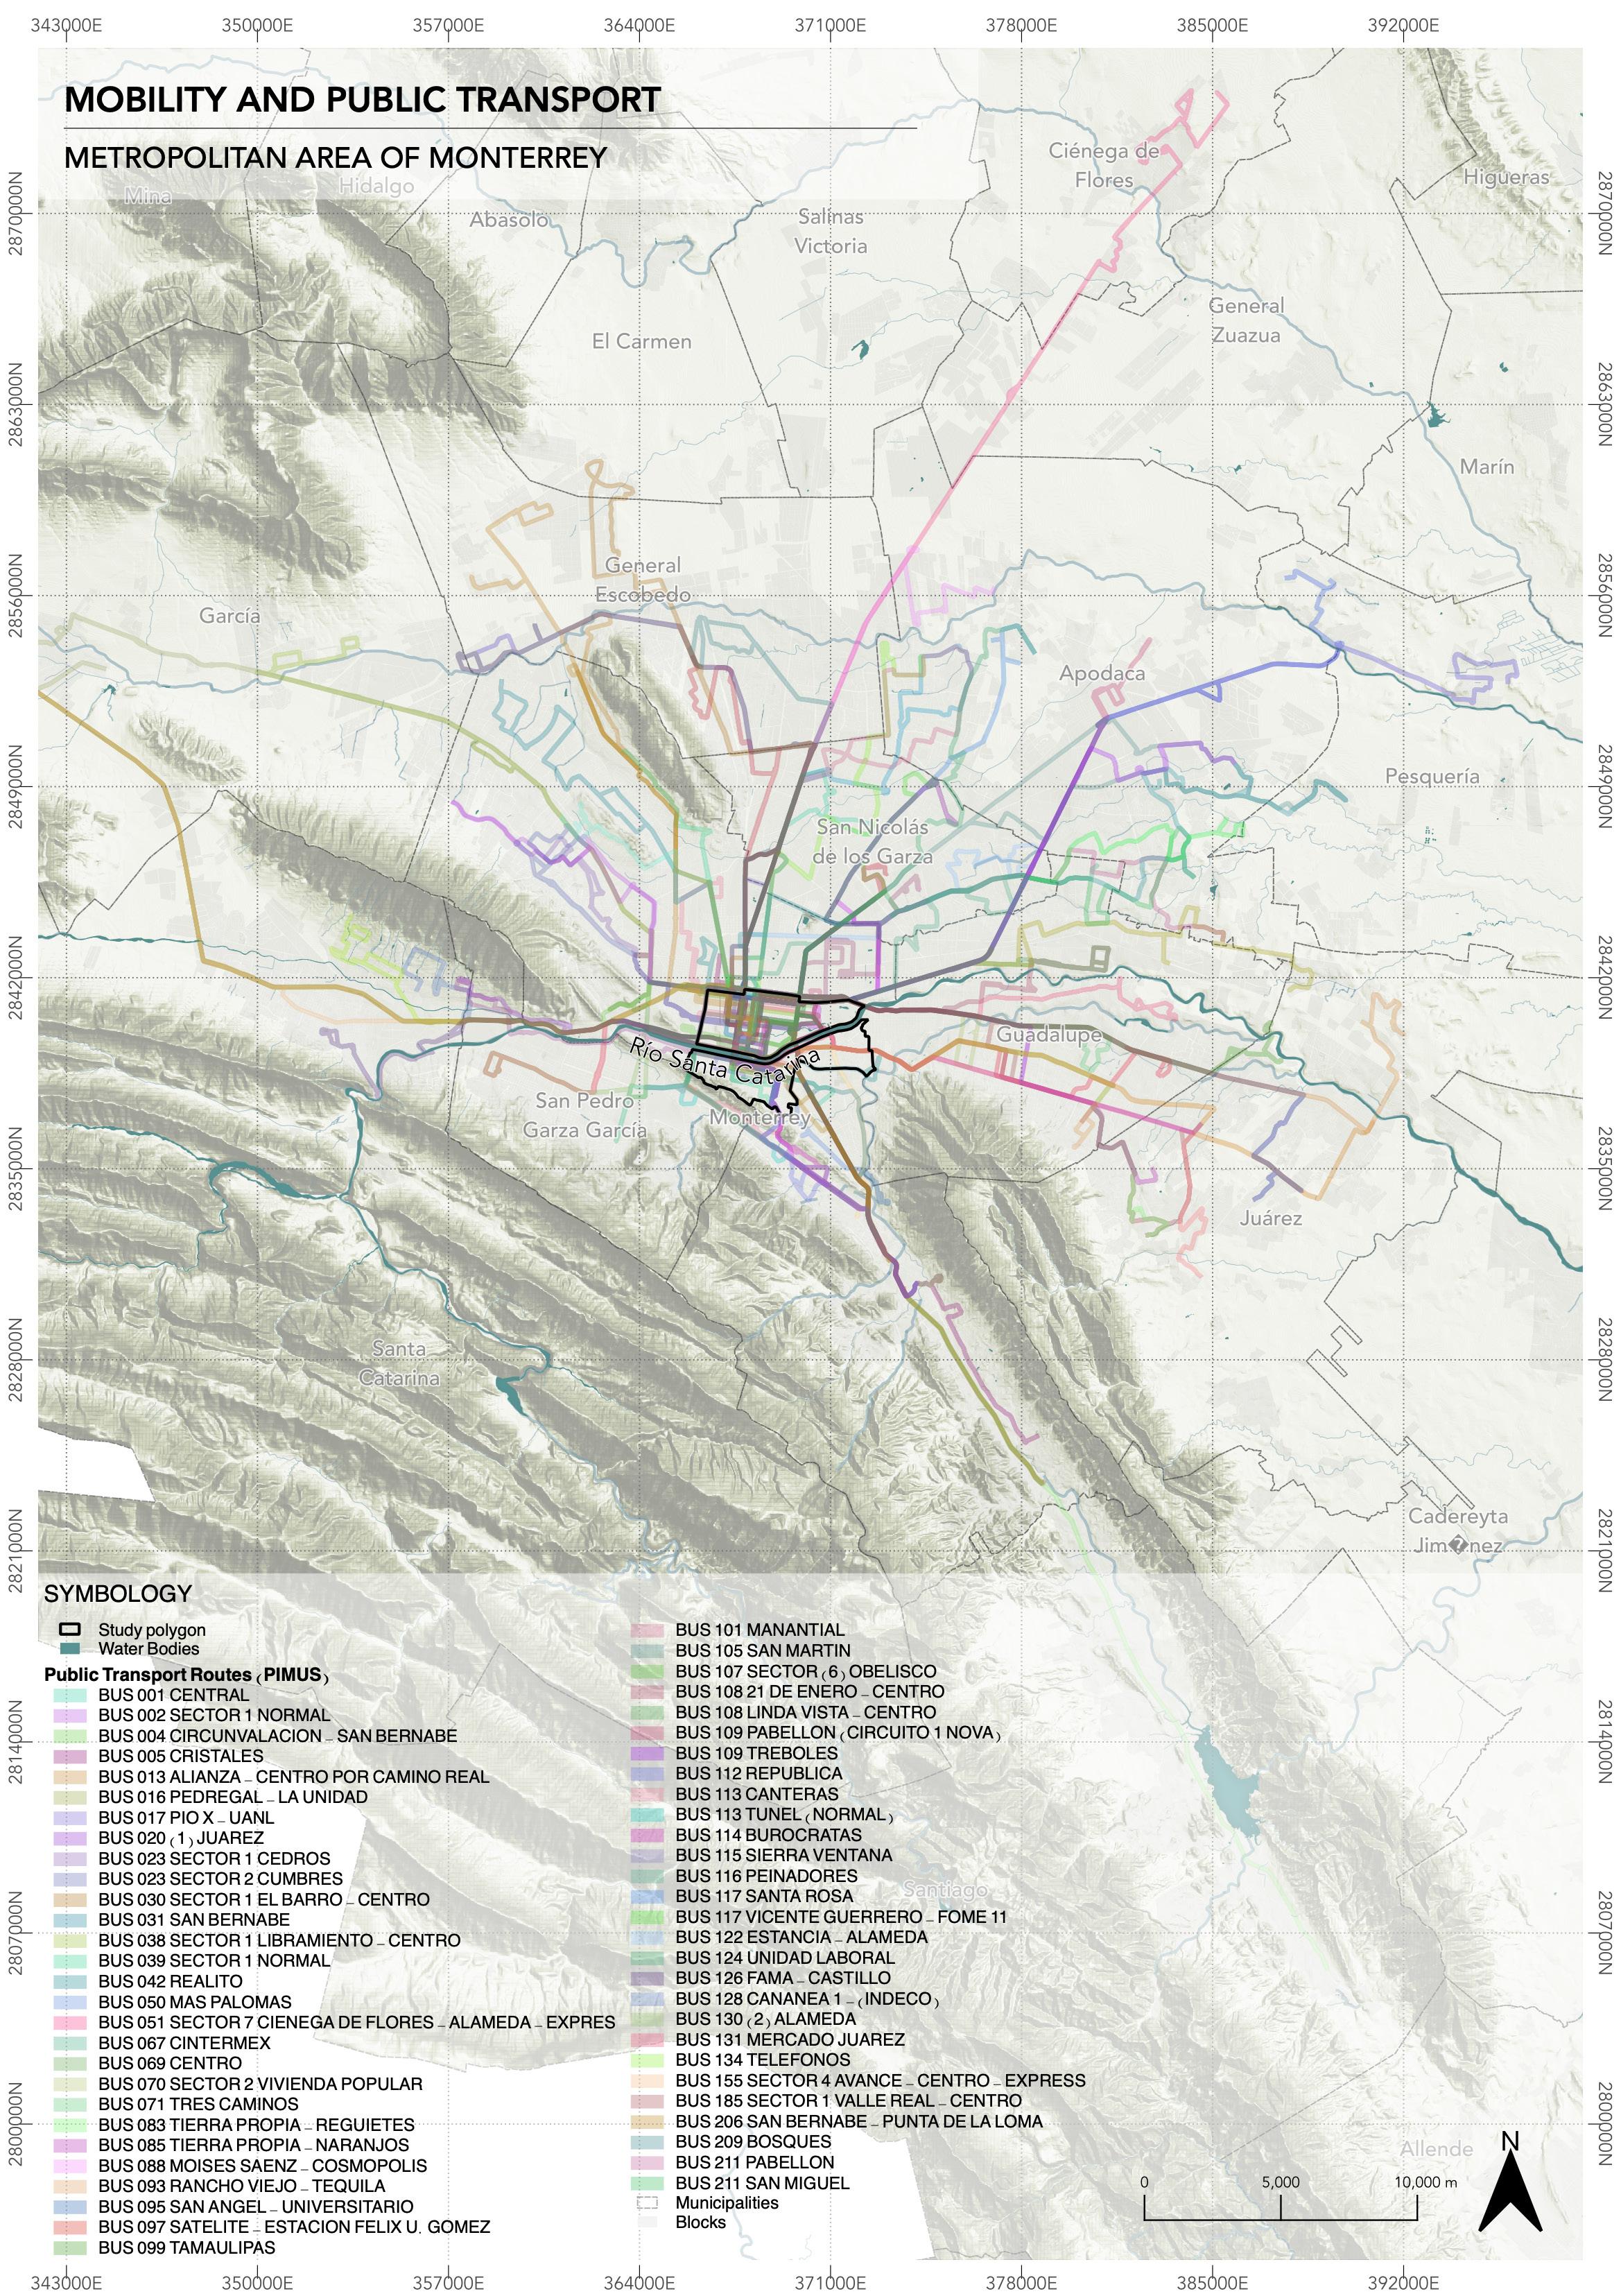
are 164 bus routes in the Metropolitan area, but only in the City center and Independencia are 86.”
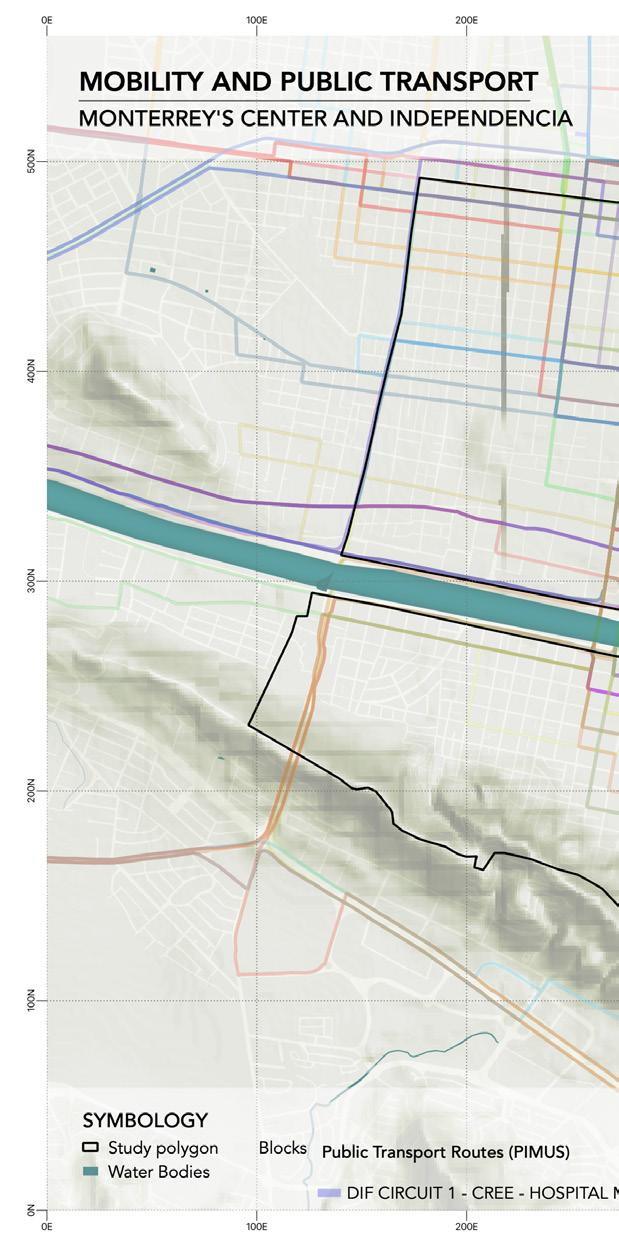
“There
54
According to the PIMUS (Integral Program for Sustainable Urban Mobility), there are 164 bus routes in the Metropolitan area, but only in the City center and Independencia are 86. This causes us to have irregularities in the service like the differences in schedules of the routes because there are bus lines that arrive every 20 minutes, but others that arrive every hour. The polygon represents congestion due to public transport traffic, cause there are so many bus lines that pass across it. These are mainly the peripheral routes.
55
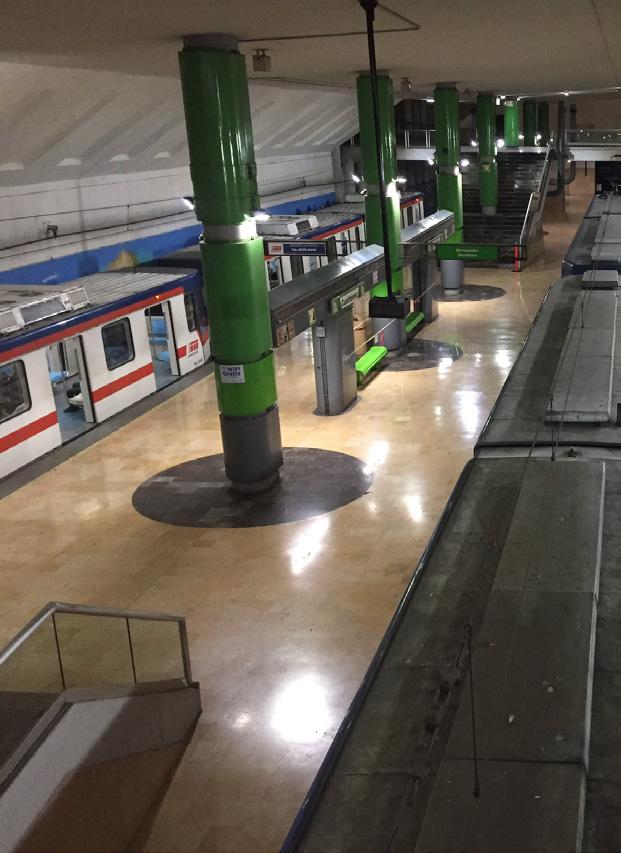
METRO LINES
are 164 bus routes in the Metropolitan area, but only in the City center and Independencia are 86.”
“There
56
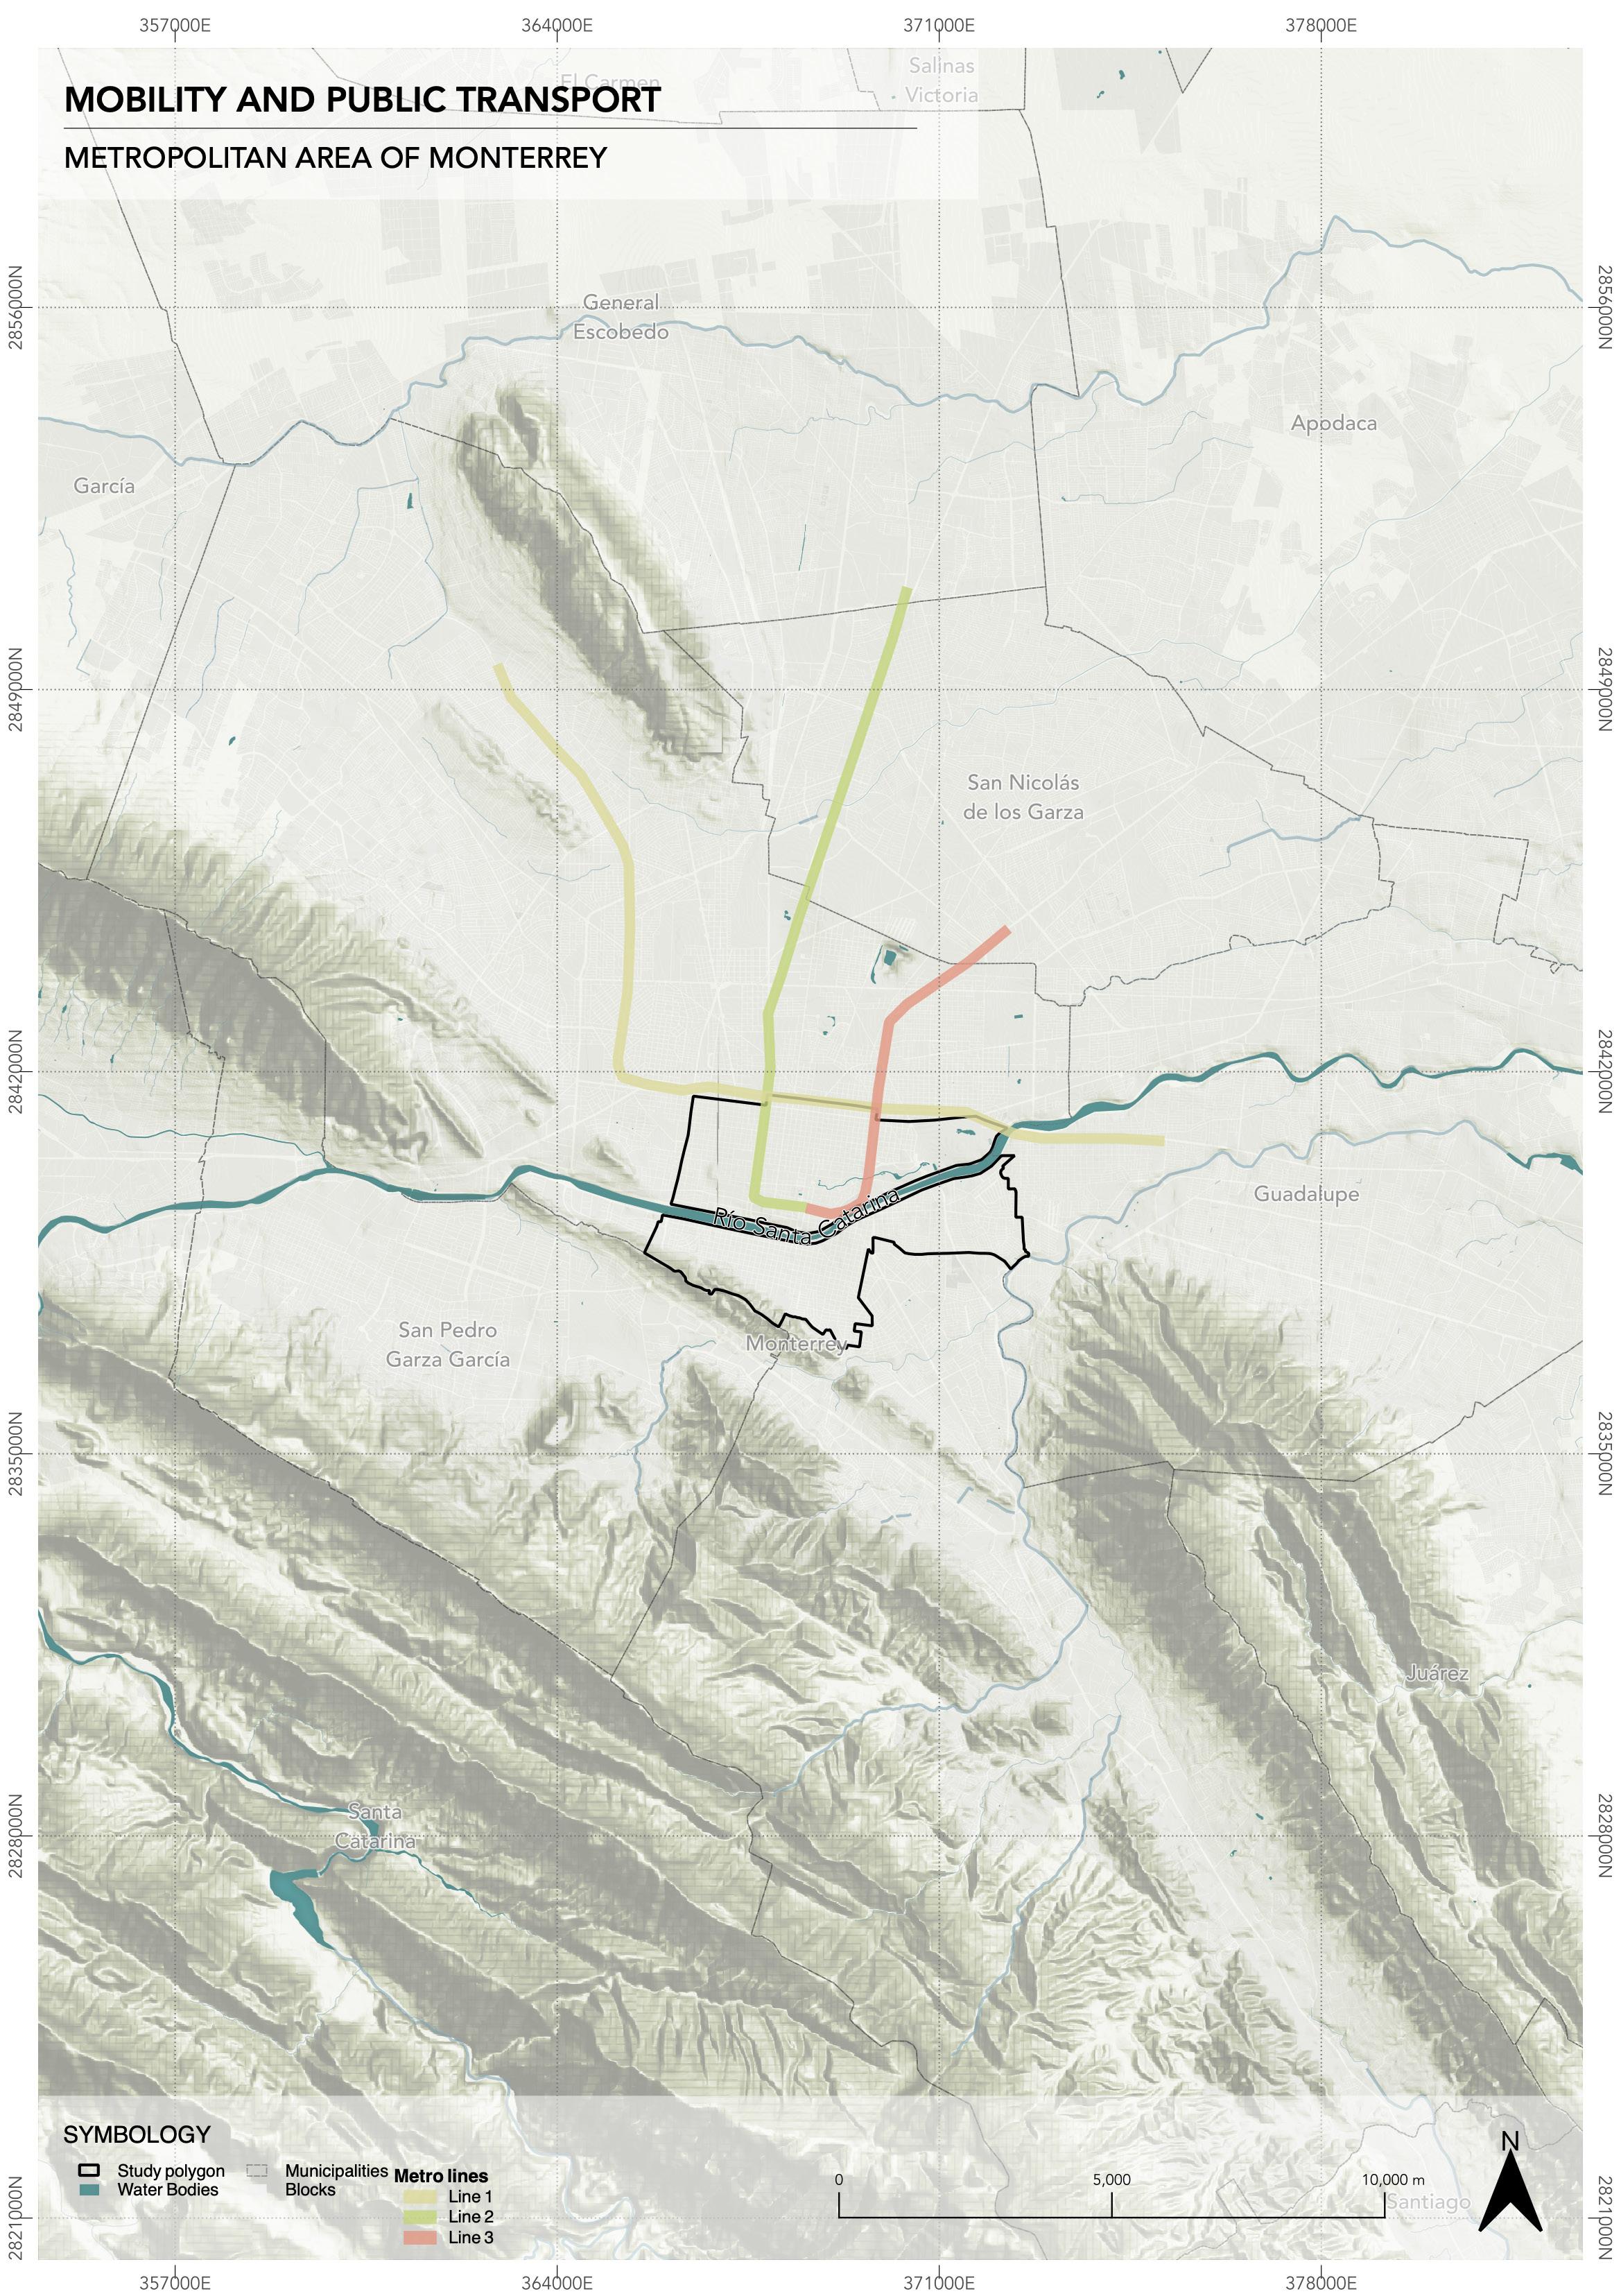
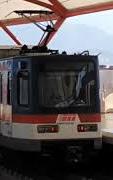
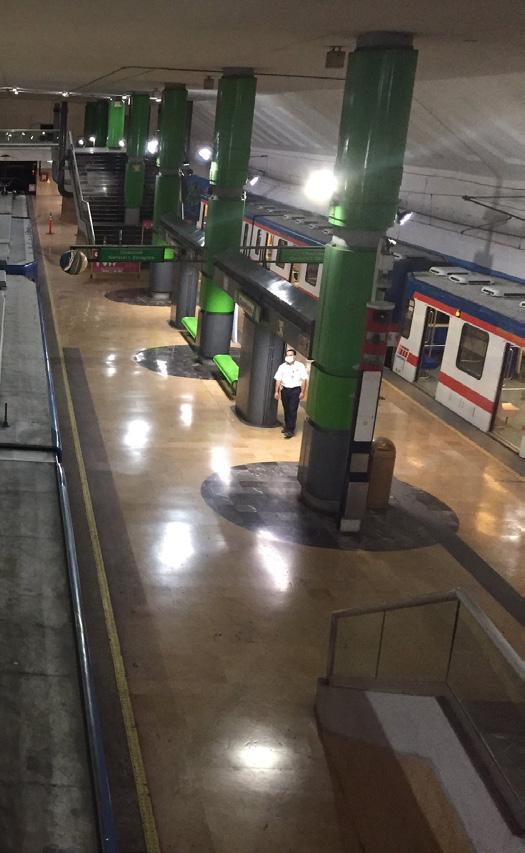
In our study area, there are three metro lines, which, like the bus lines, connect different municipalities to the center of Monterrey, such as San Nicolás de los Garza, Escobedo, and Guadalupe.

For the southern area of our industrial estate, in Independencia there is no metro line, however, the connection with the bus lines is complemented Through the subway, the downtown area is not connected to the southern area of Monterrey, which speaks of a slower transportation system to that area or vice versa.
 Elaborated by Ana Cepeda with information from IMPLAN MTY (2013)
57
58
ECONOMY AND SOCIETY
According to the Rockefeller Foundation City Resilience Index, Economy and Society Dimension refers to how the city is organized in the terms of the social and economic systems, and how these last two enable urban populations to live peacefully and act collectively. (ARUP, 2013)
In this section, a socio-economic and demographic analysis of the study zone is being carried out, to determine the inhabitants profile to take into account the different necessities.
Variables such as the distribution of the population by sex and age group are studied; population density, presence of vulnerable groups, economically active population, estimated income, average level of schooling, among others.
Knowing that in the study zone two different but important neighborhoods exist, there will be a comparison between the two of them.
On the other hand, the main commercial and service corridors were identified, as well as the estimated number of employees who work in each economic unit. This analysis will be the basis for identifying possible flows and dynamics in the area as well as those points of greatest influx.
59
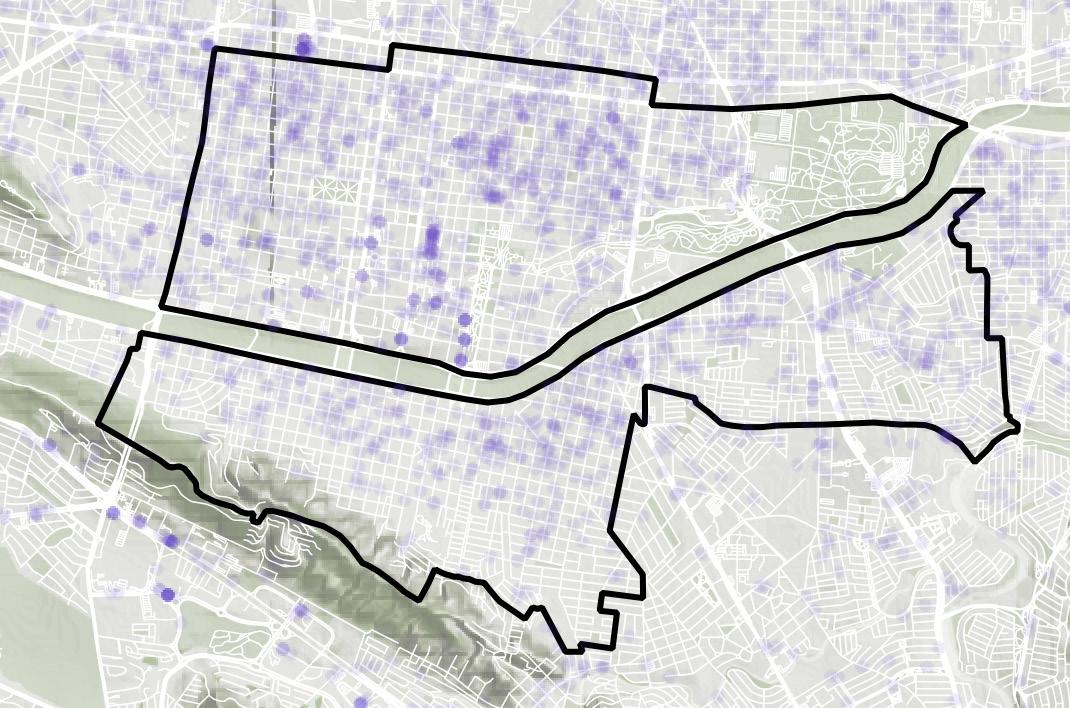
60
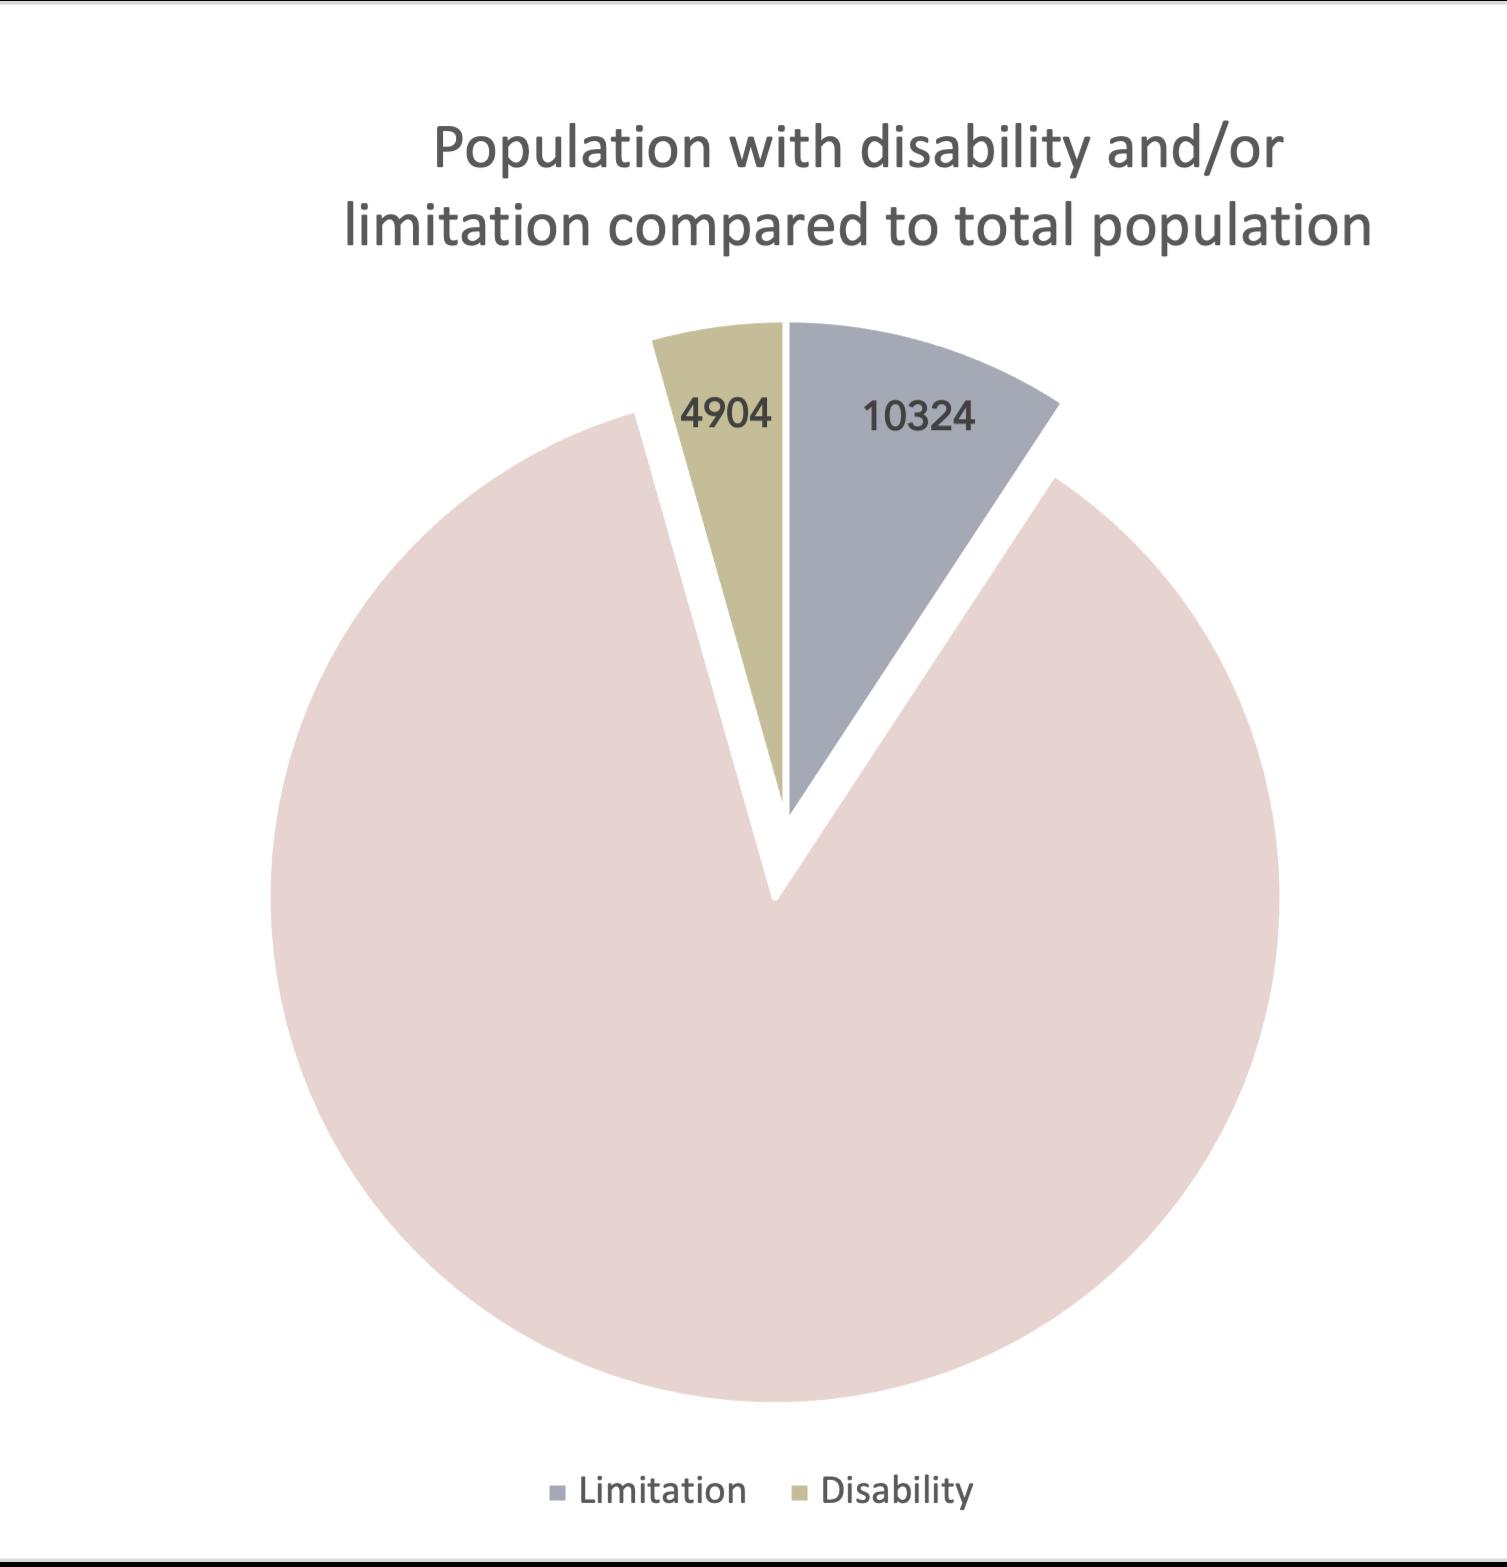
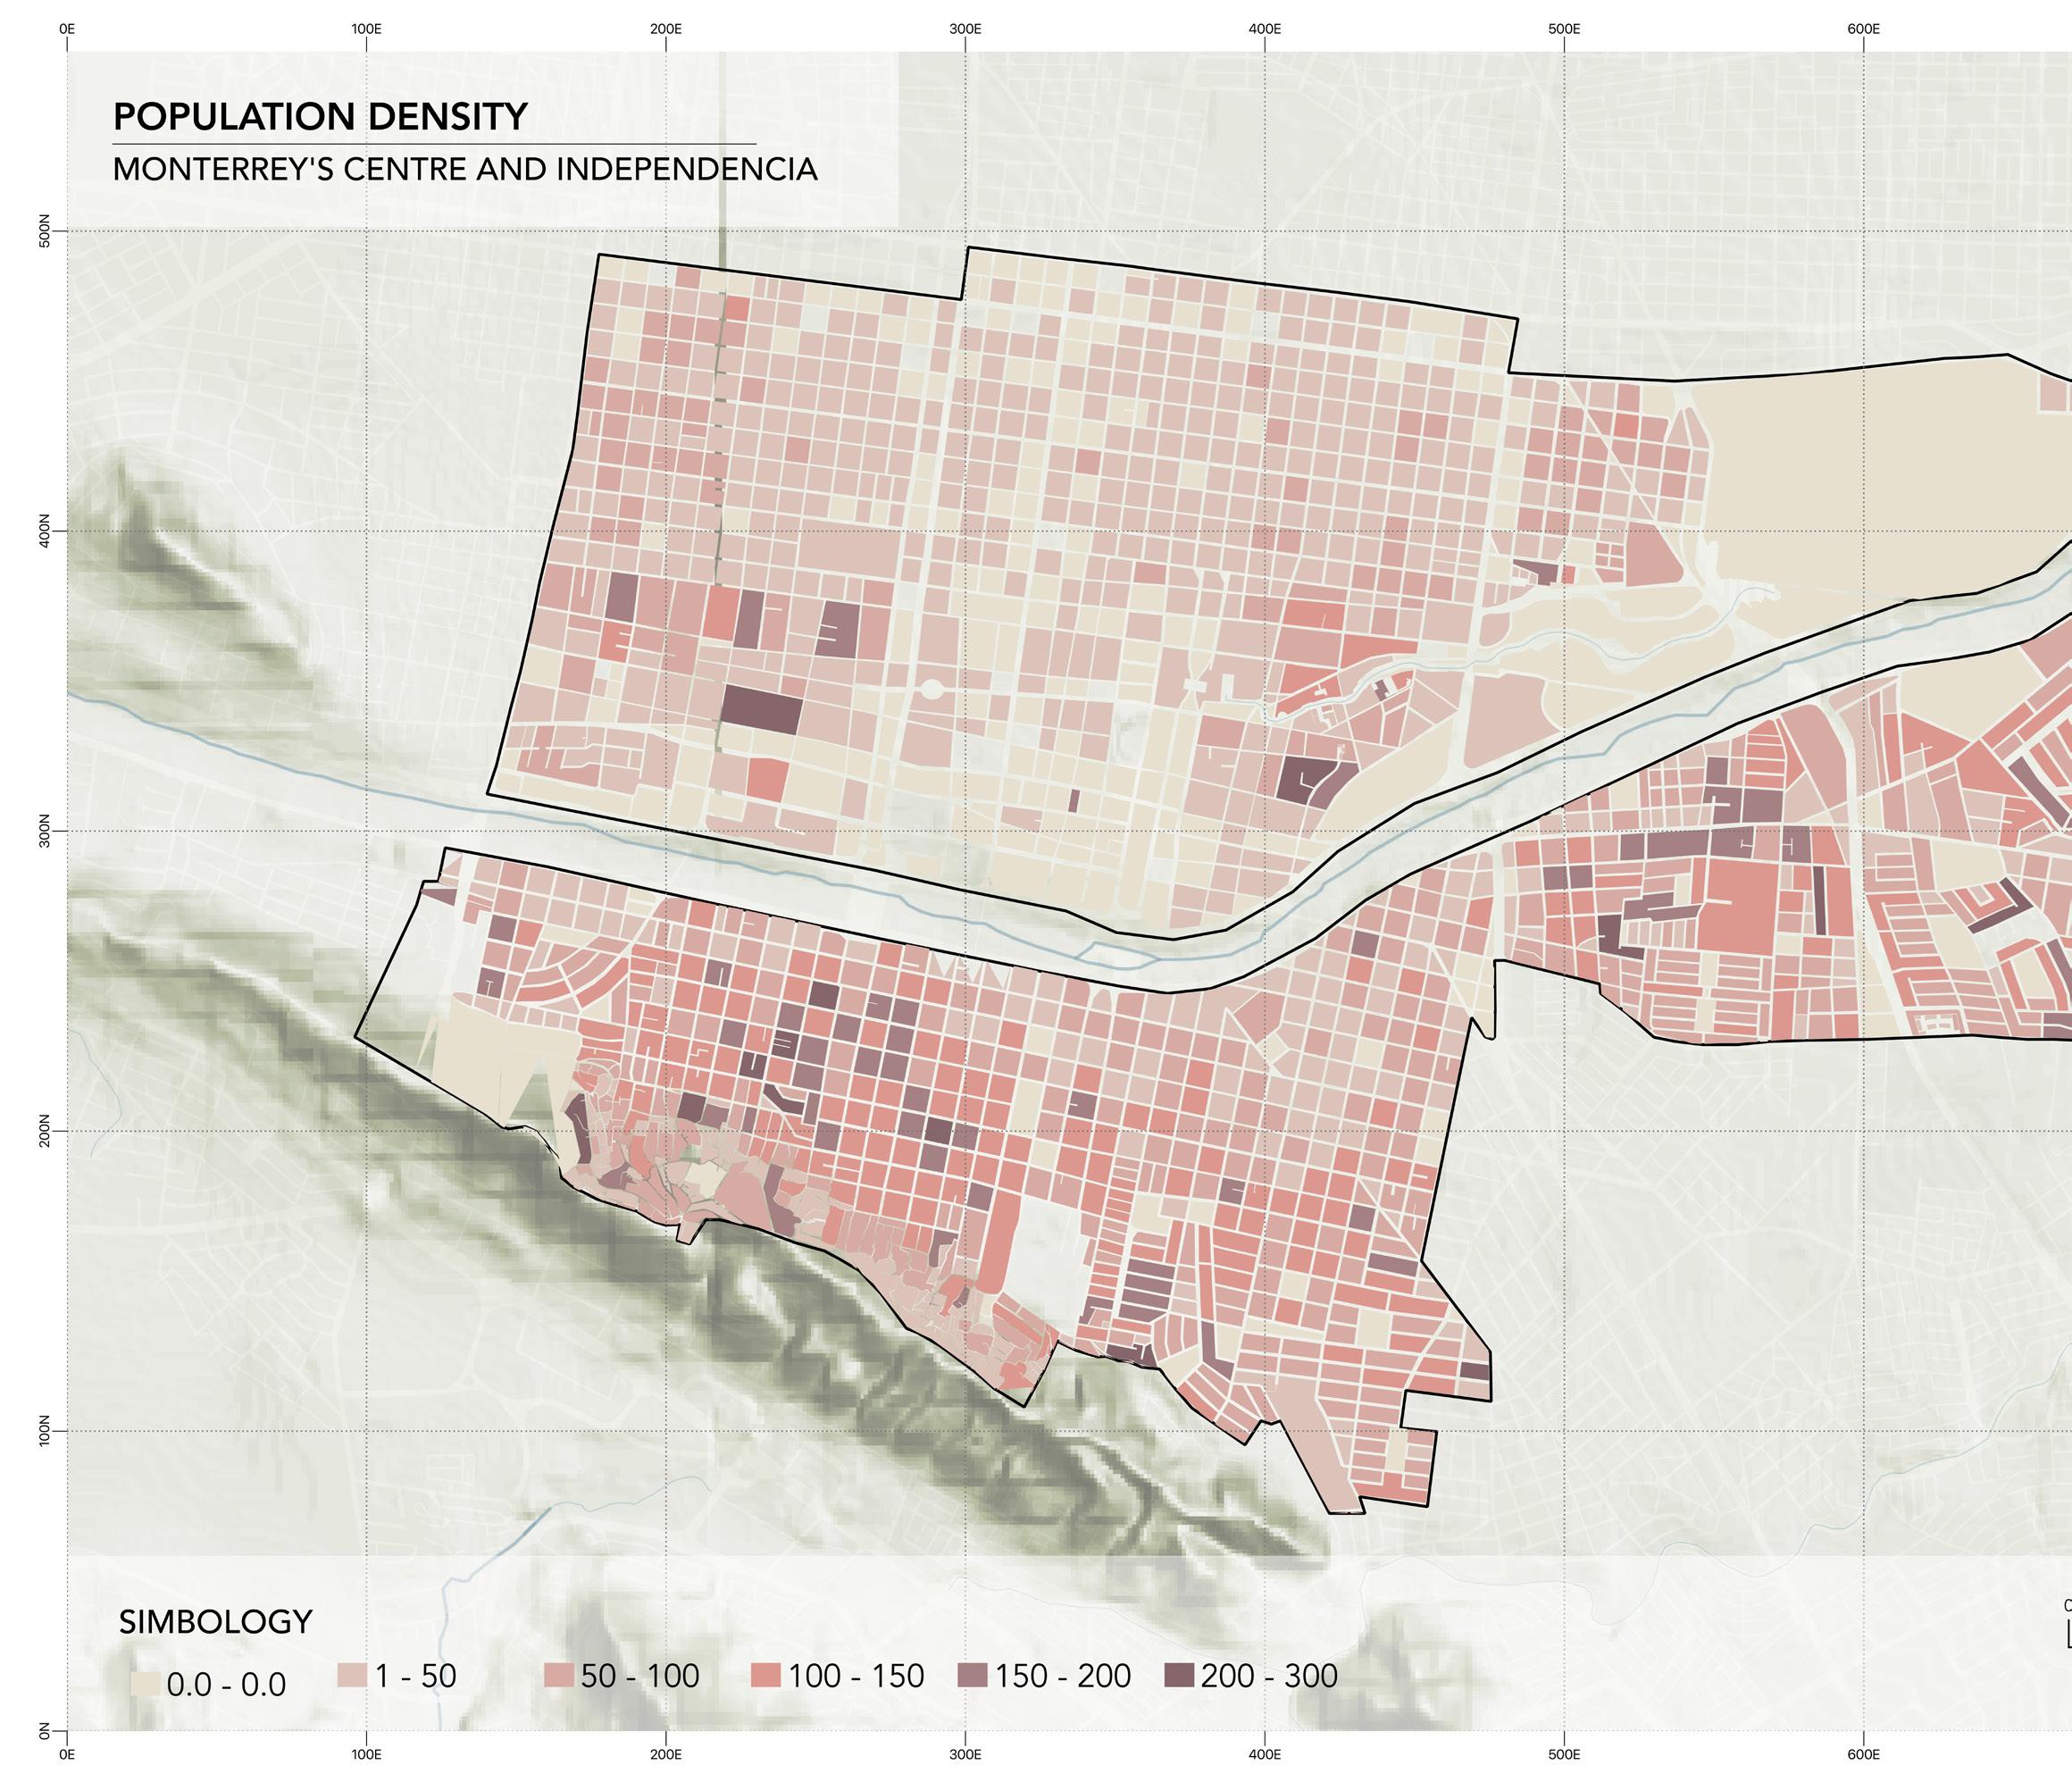
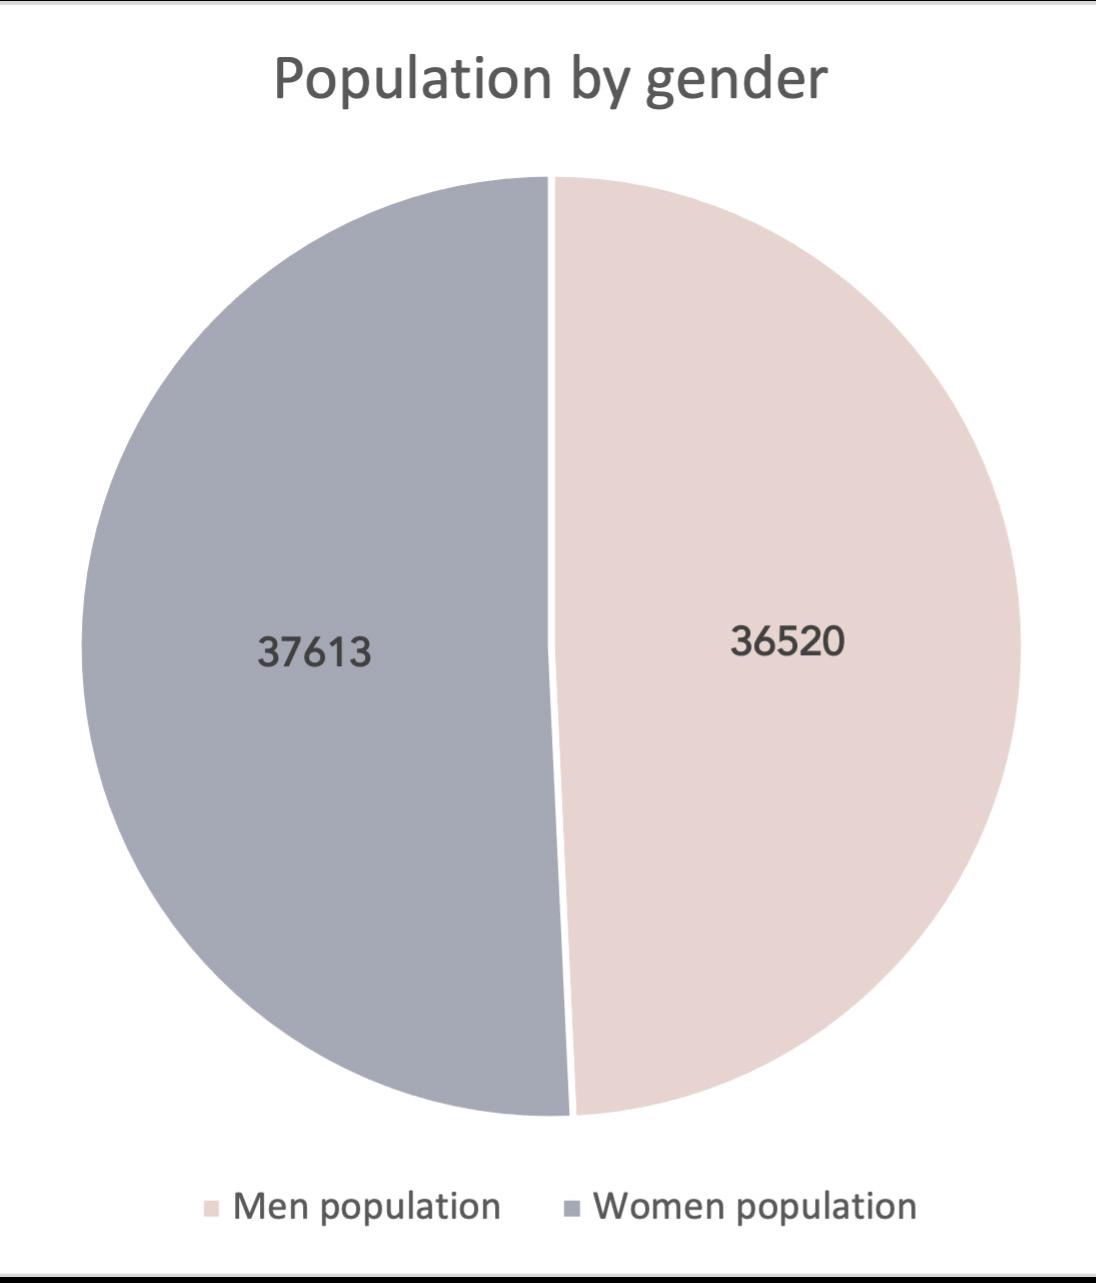
Left to right: City center walker. Top photo: Population density mp. Bottom graph: Population by gender. Bottom graph: Population with disability or limitation.
On the site, there is a total population of 96,345 of which 48,627 are women and 47,718 are men. However, the city center has a much lower population with 22,212 inhabitants. On the other hand, Independencia counts a population of 74,133, with a predominance of the age group of adults aged 25 to 59 years with 51.62% of the total population belonging to this age group. The second largest age group is the elderly with 21,711 which represents 22.56% of the total population.
The population studied includes a vulnerable sector which is the people with limitations and disabilities. There are a total of 15,228 persons who belong to these vulnerable groups. This is 16% of the total population studied, distributed around the area near zones with and without hazards and stresses with difficulties in their lively experience in the zone considering their needs.
Even though the population by sex is balanced, the contrast of participation between the two sex can be observed when doing the transect walks along the city center, the presence of the gender that predominated in the public space and commercials was the male population. The map includes both sides of the river and their population density. Represented with stronger colors, are the areas where there is a higher population density per block. South of the river we can see stronger colors, where more people are living in each block than there are in the city center, the North area of the polygon. The East part of the polygon also demonstrates a higher population density, as a consequence of its strategic location and closeness to TEC de Monterrey making it a hotspot for student housing and strong economic activity. It is important to point out that areas with no population or shaded in lighter colors like the South of the city center are because it is public space, a plaza to be specific. On the other side, population density indicates that there is more interaction or even a closer relationship between neighbors due to their proximity and quantity.
Demography and population density
61
“Population density also indicates that there is more interaction or even a closer relationship between neighbors due to thereproximity and quantity.”
62
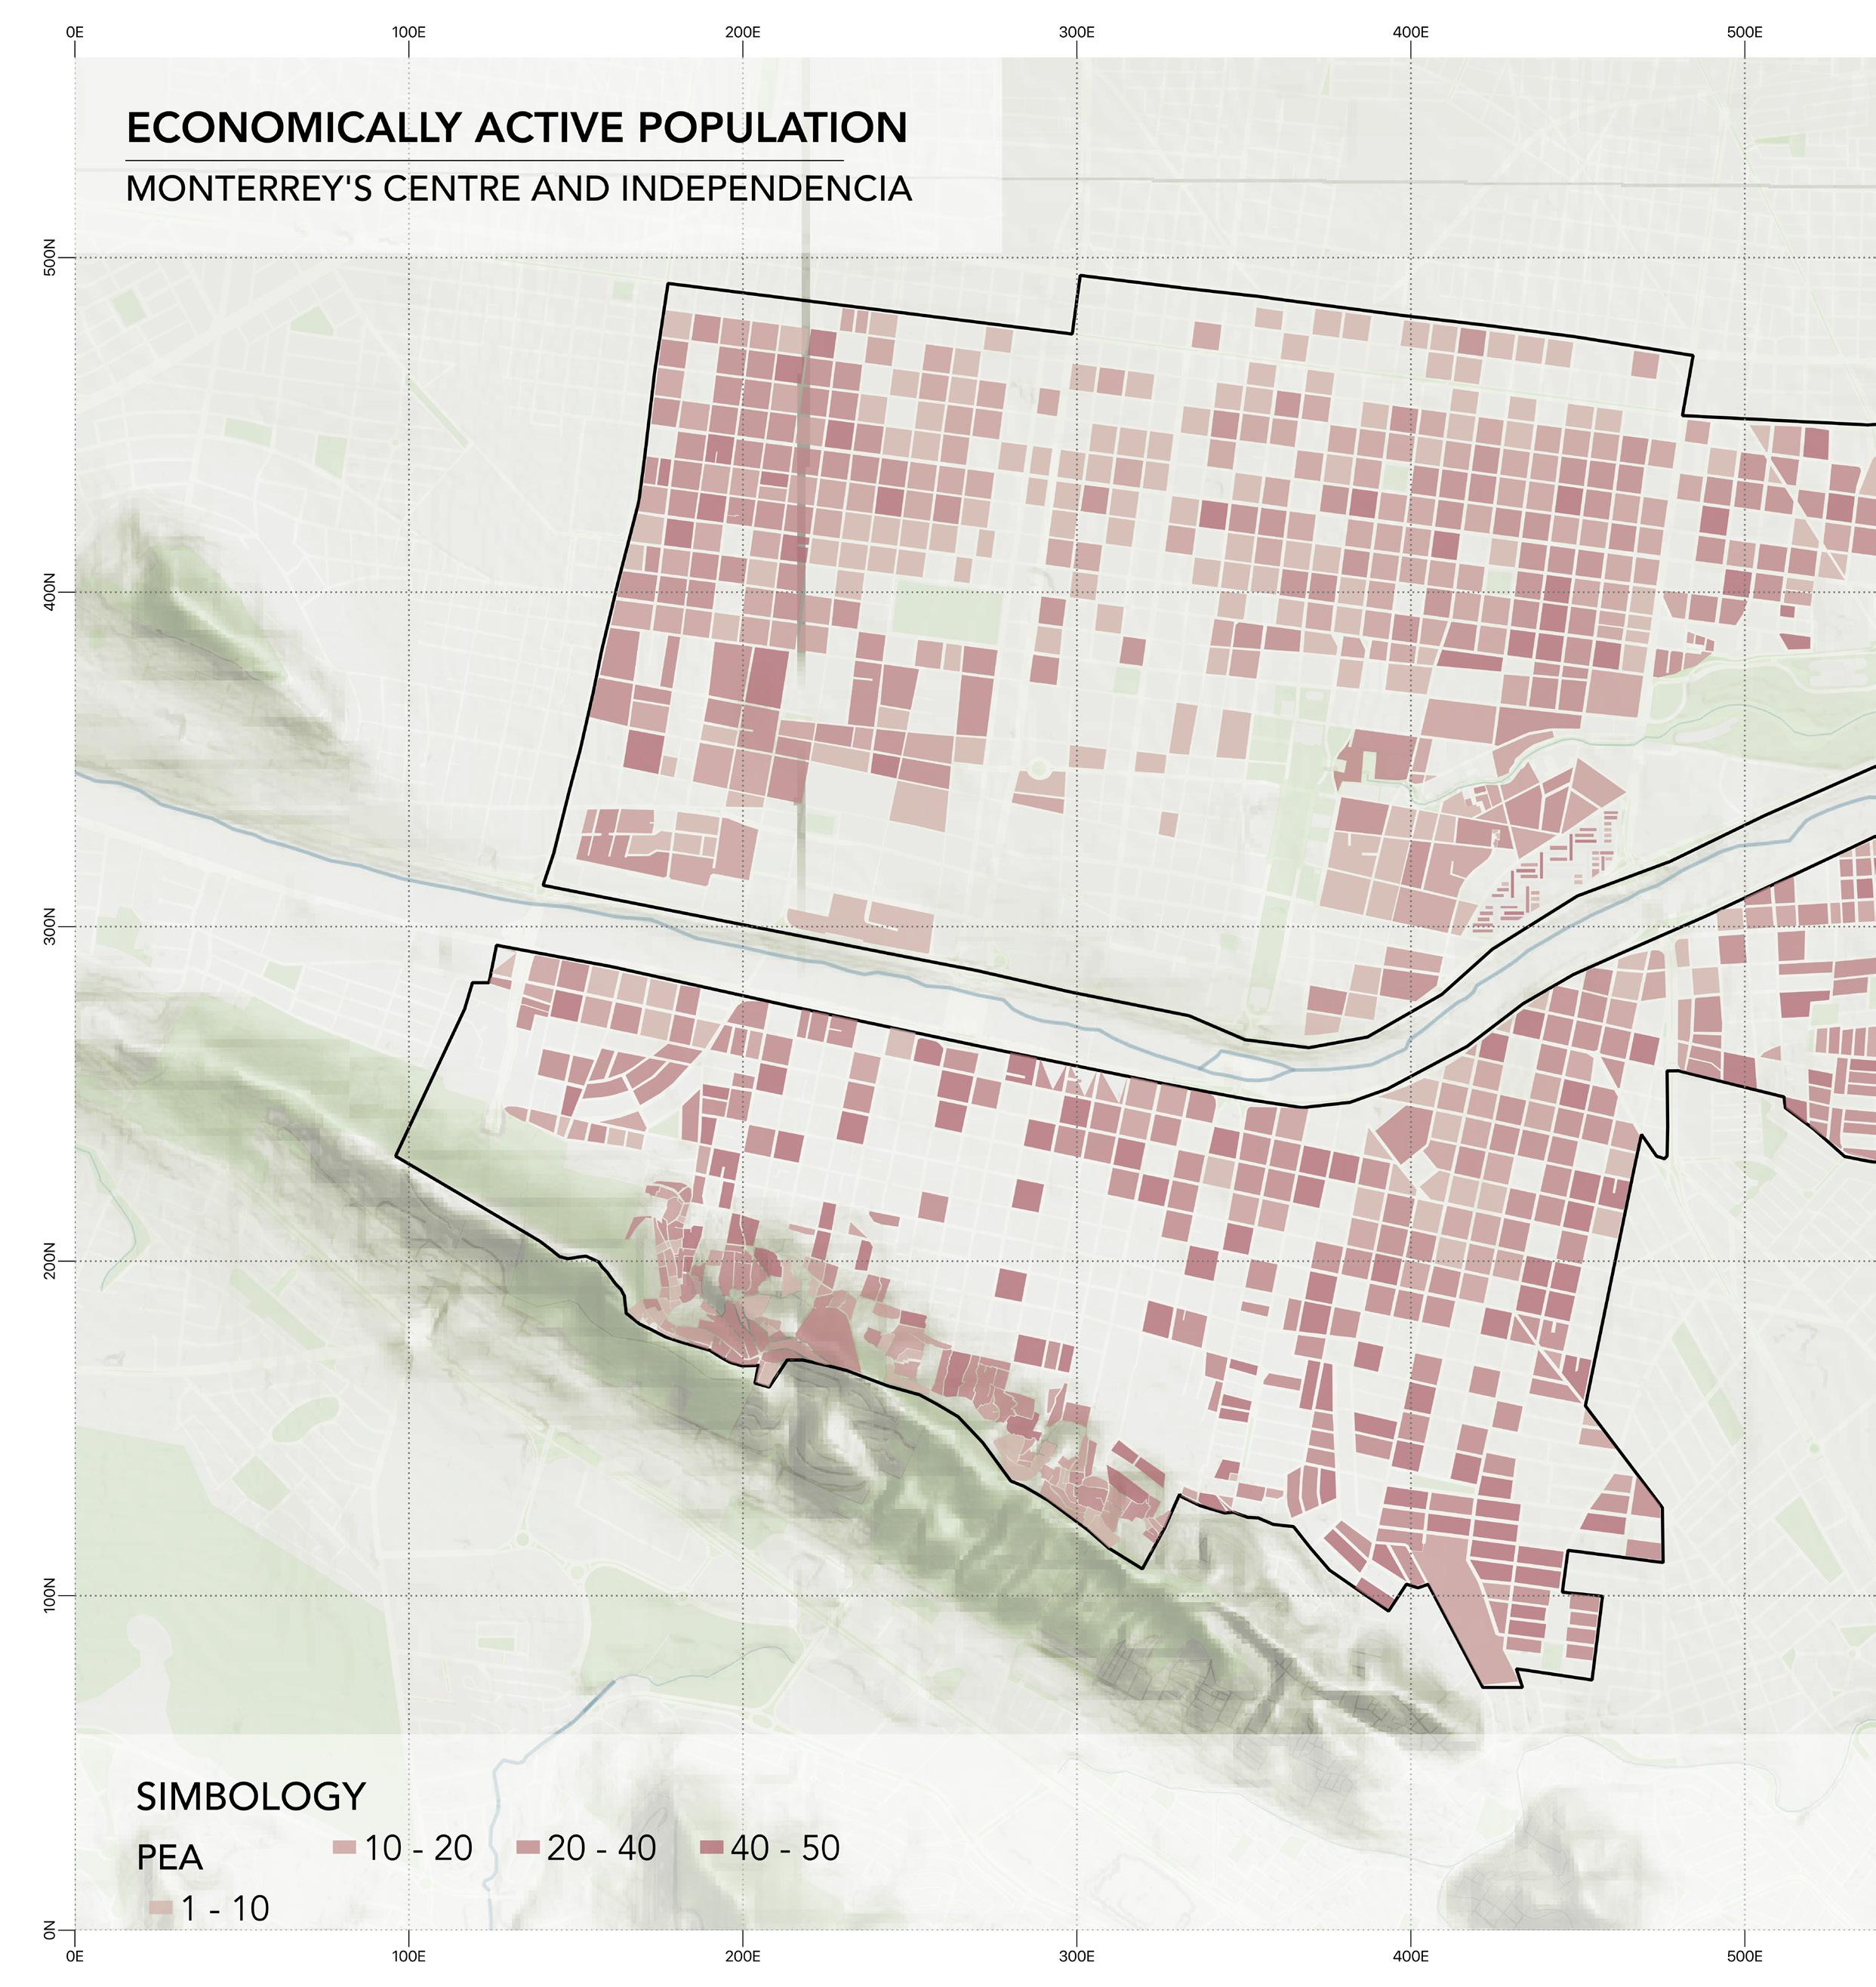
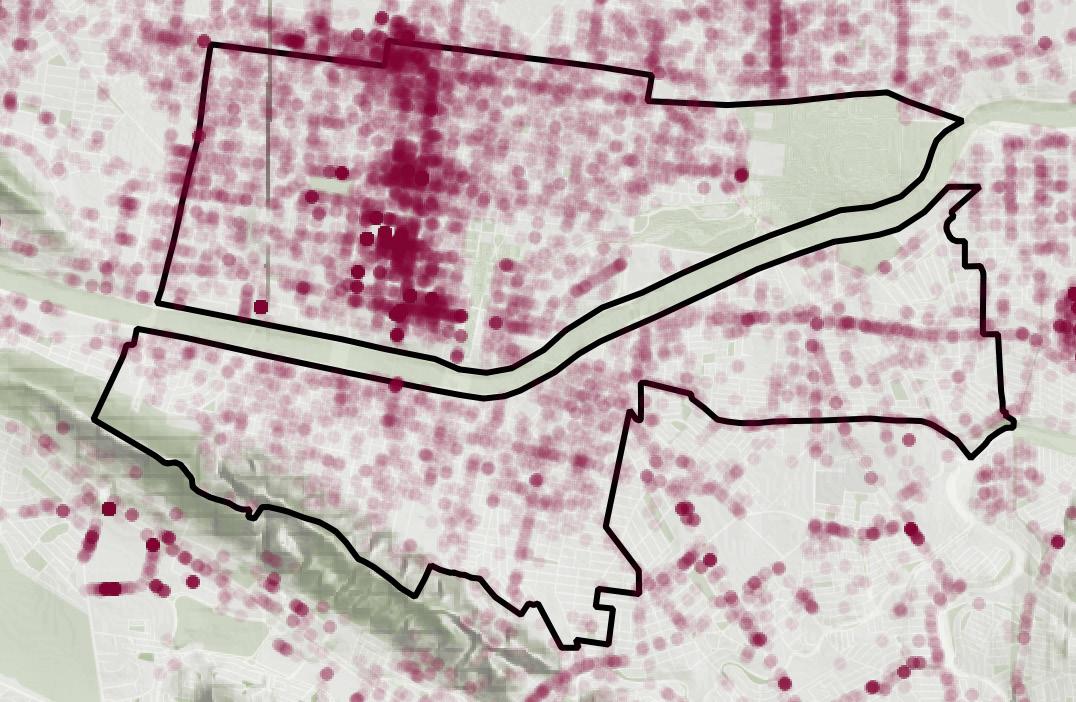
“Posters with slips to contact the company, would be empty, meaning people were eager to find jobs.”
Economically active population
Analyzing the economically active population mark on the map, we can instantly detect a higher number of people in Independencia.
An important factor here is the higher the population density in the zone is, the more economically active citizens per block. The average number of workers per block in Independencia is 95-143, contrary to around 50 workers per block in the city center. This means higher GDP, higher education, and the opening of opportunities.
It was clear during the visit to the site that there was a lot of recruitment happening in Indepencia that increased the population economically active. Posters with slips to contact the company would be empty, meaning people were also eager to find jobs. However, it was common to see that the first floor of the houses here was for commercial use and the second floor was for residential use. Walking on one street, you would find around three commercials that state that they are as open to starting a business as they are to working in one.
Economically active populations are always a sign of a society that values work and it´s shown in the GDP of a country. Monterrey is known for being an industrial city and the opportunities given in this city are like no other. What we can take from this are the benefits that even places such as Independencia being economically active could contribute to the state’s GDP.
63
Elaborated by Catalina Salinas with information from INEGI 2020
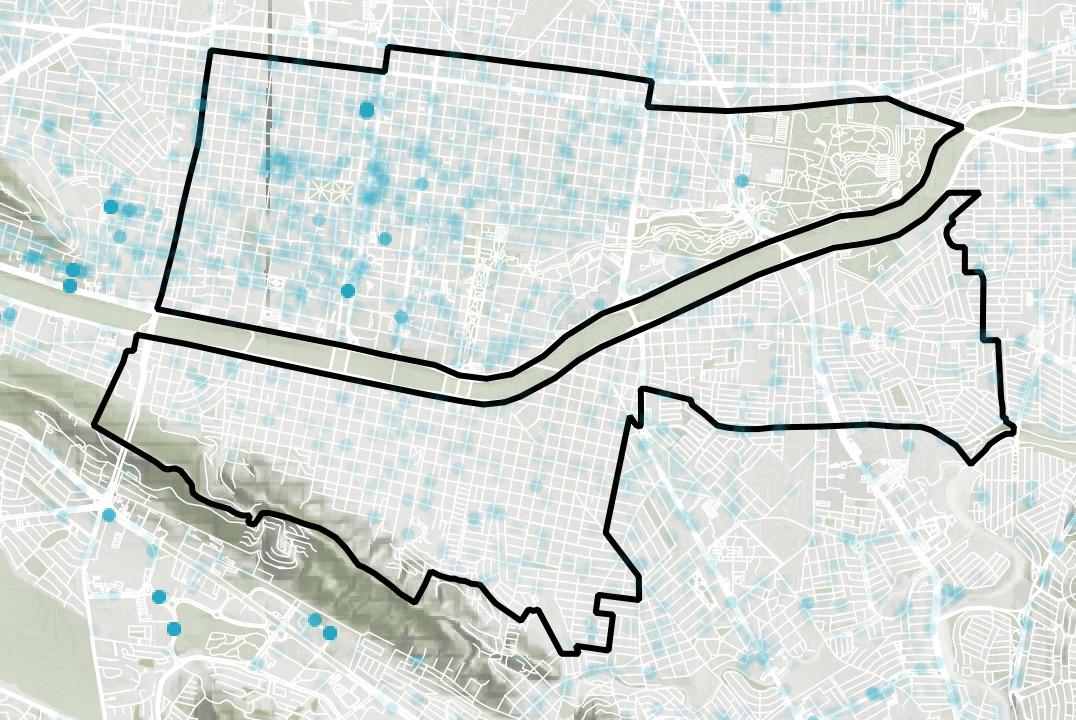
ECONOMIC ACTIVITY
64
“The concentration on the North can be easily related to the zoning in the area, where the commercials are the predominant floor use over other uses.”
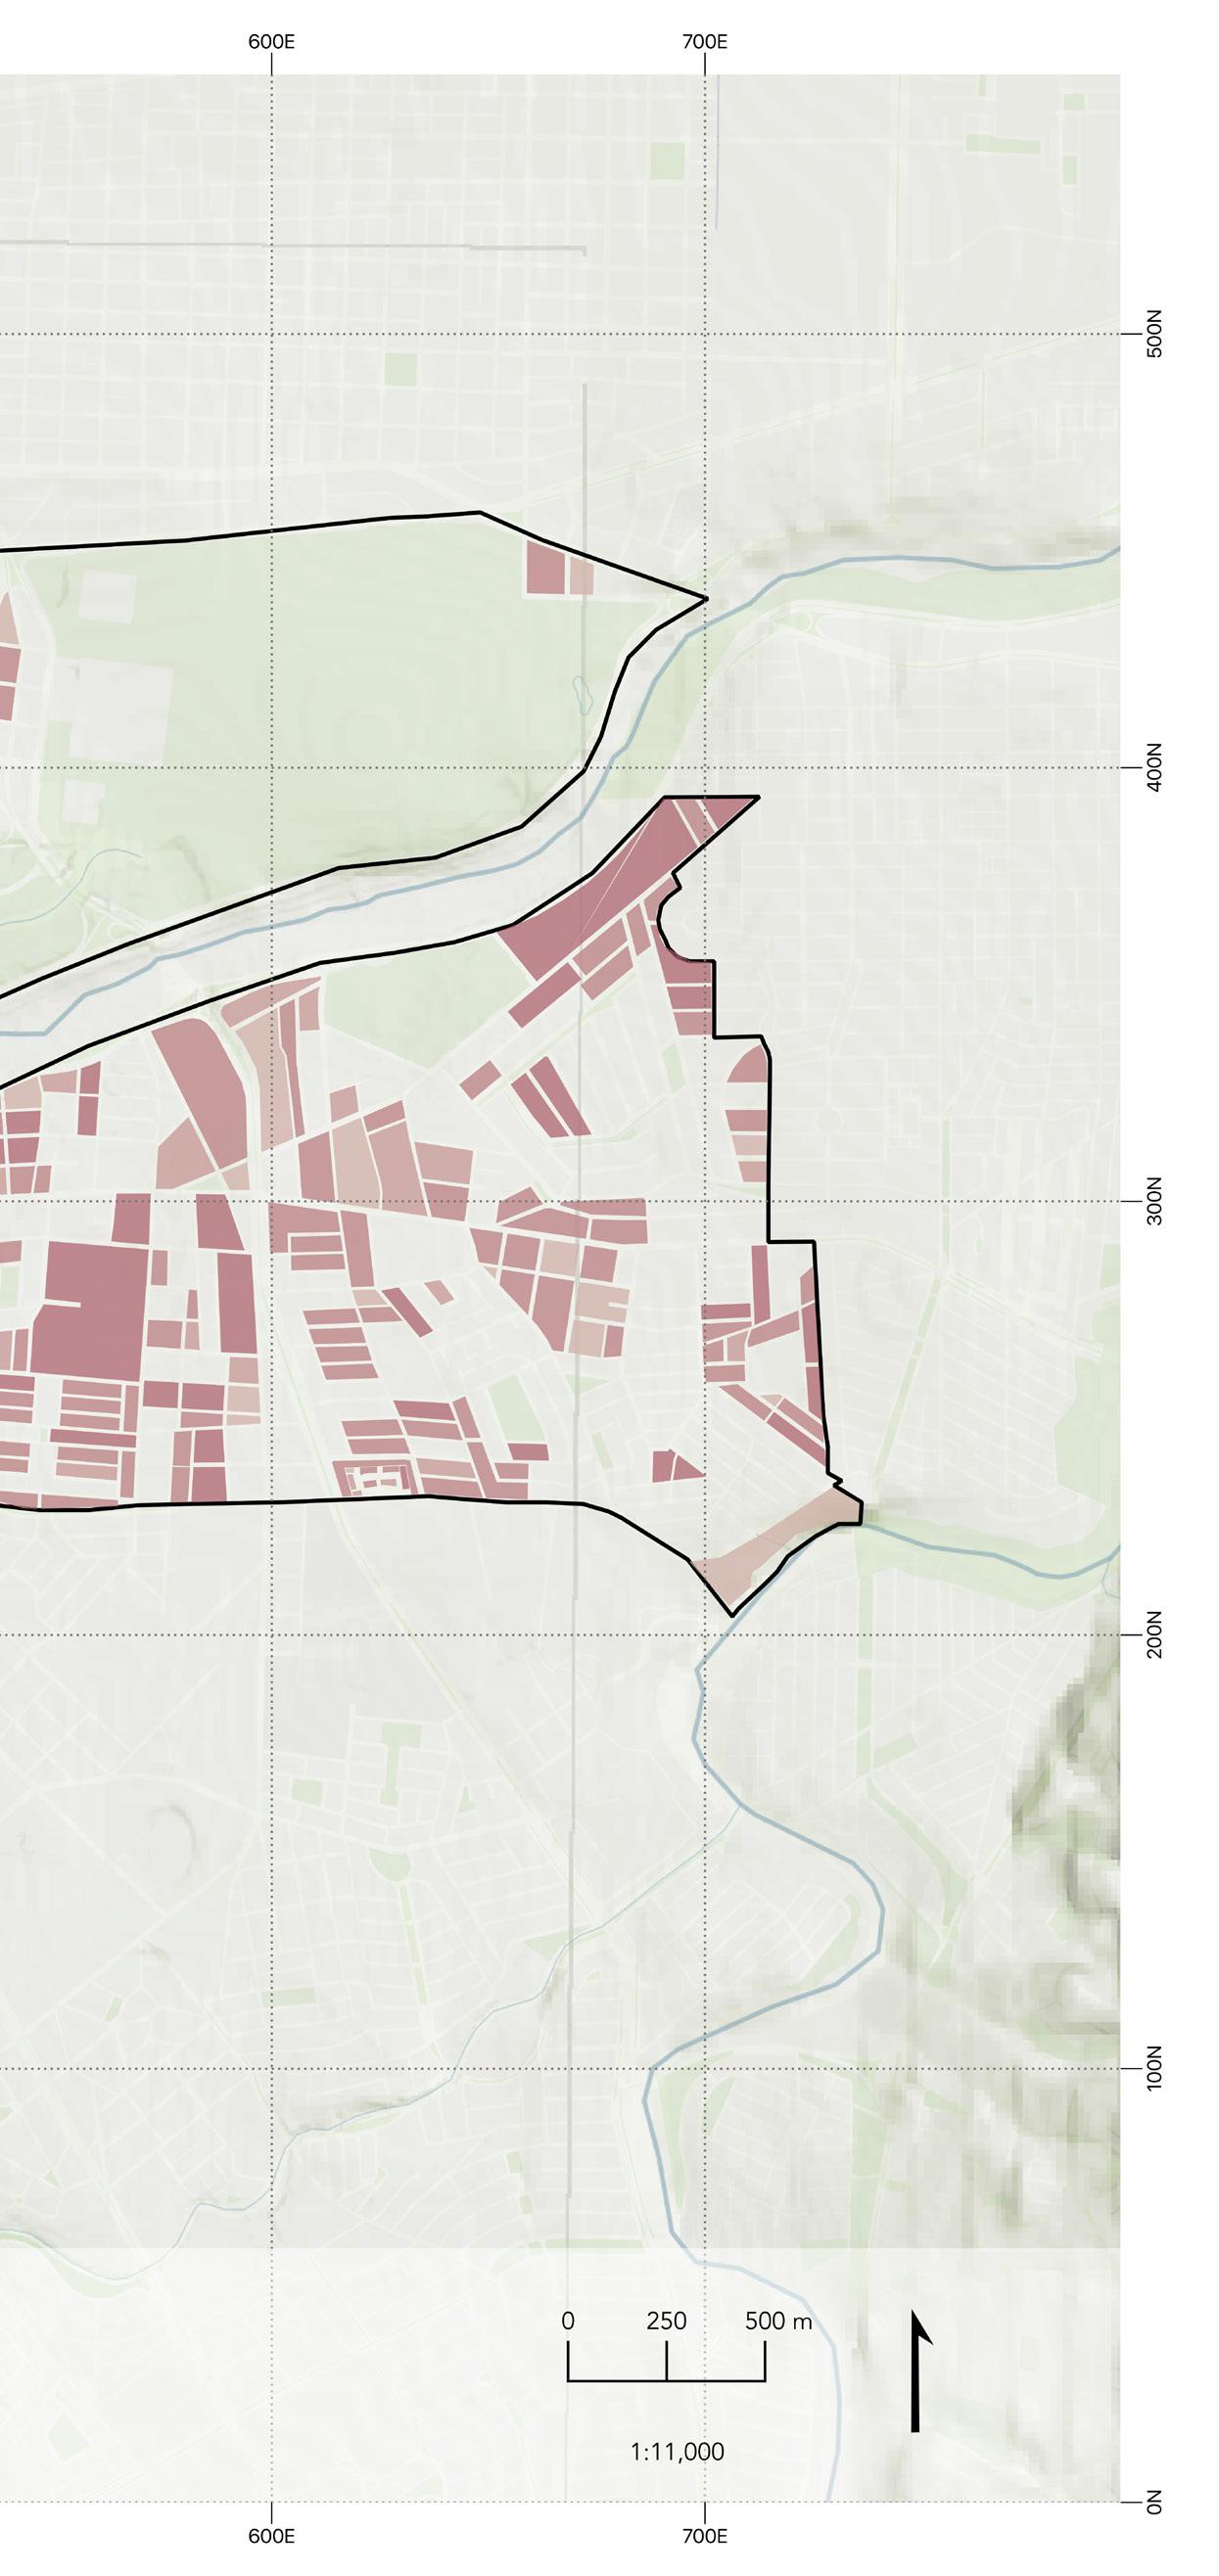
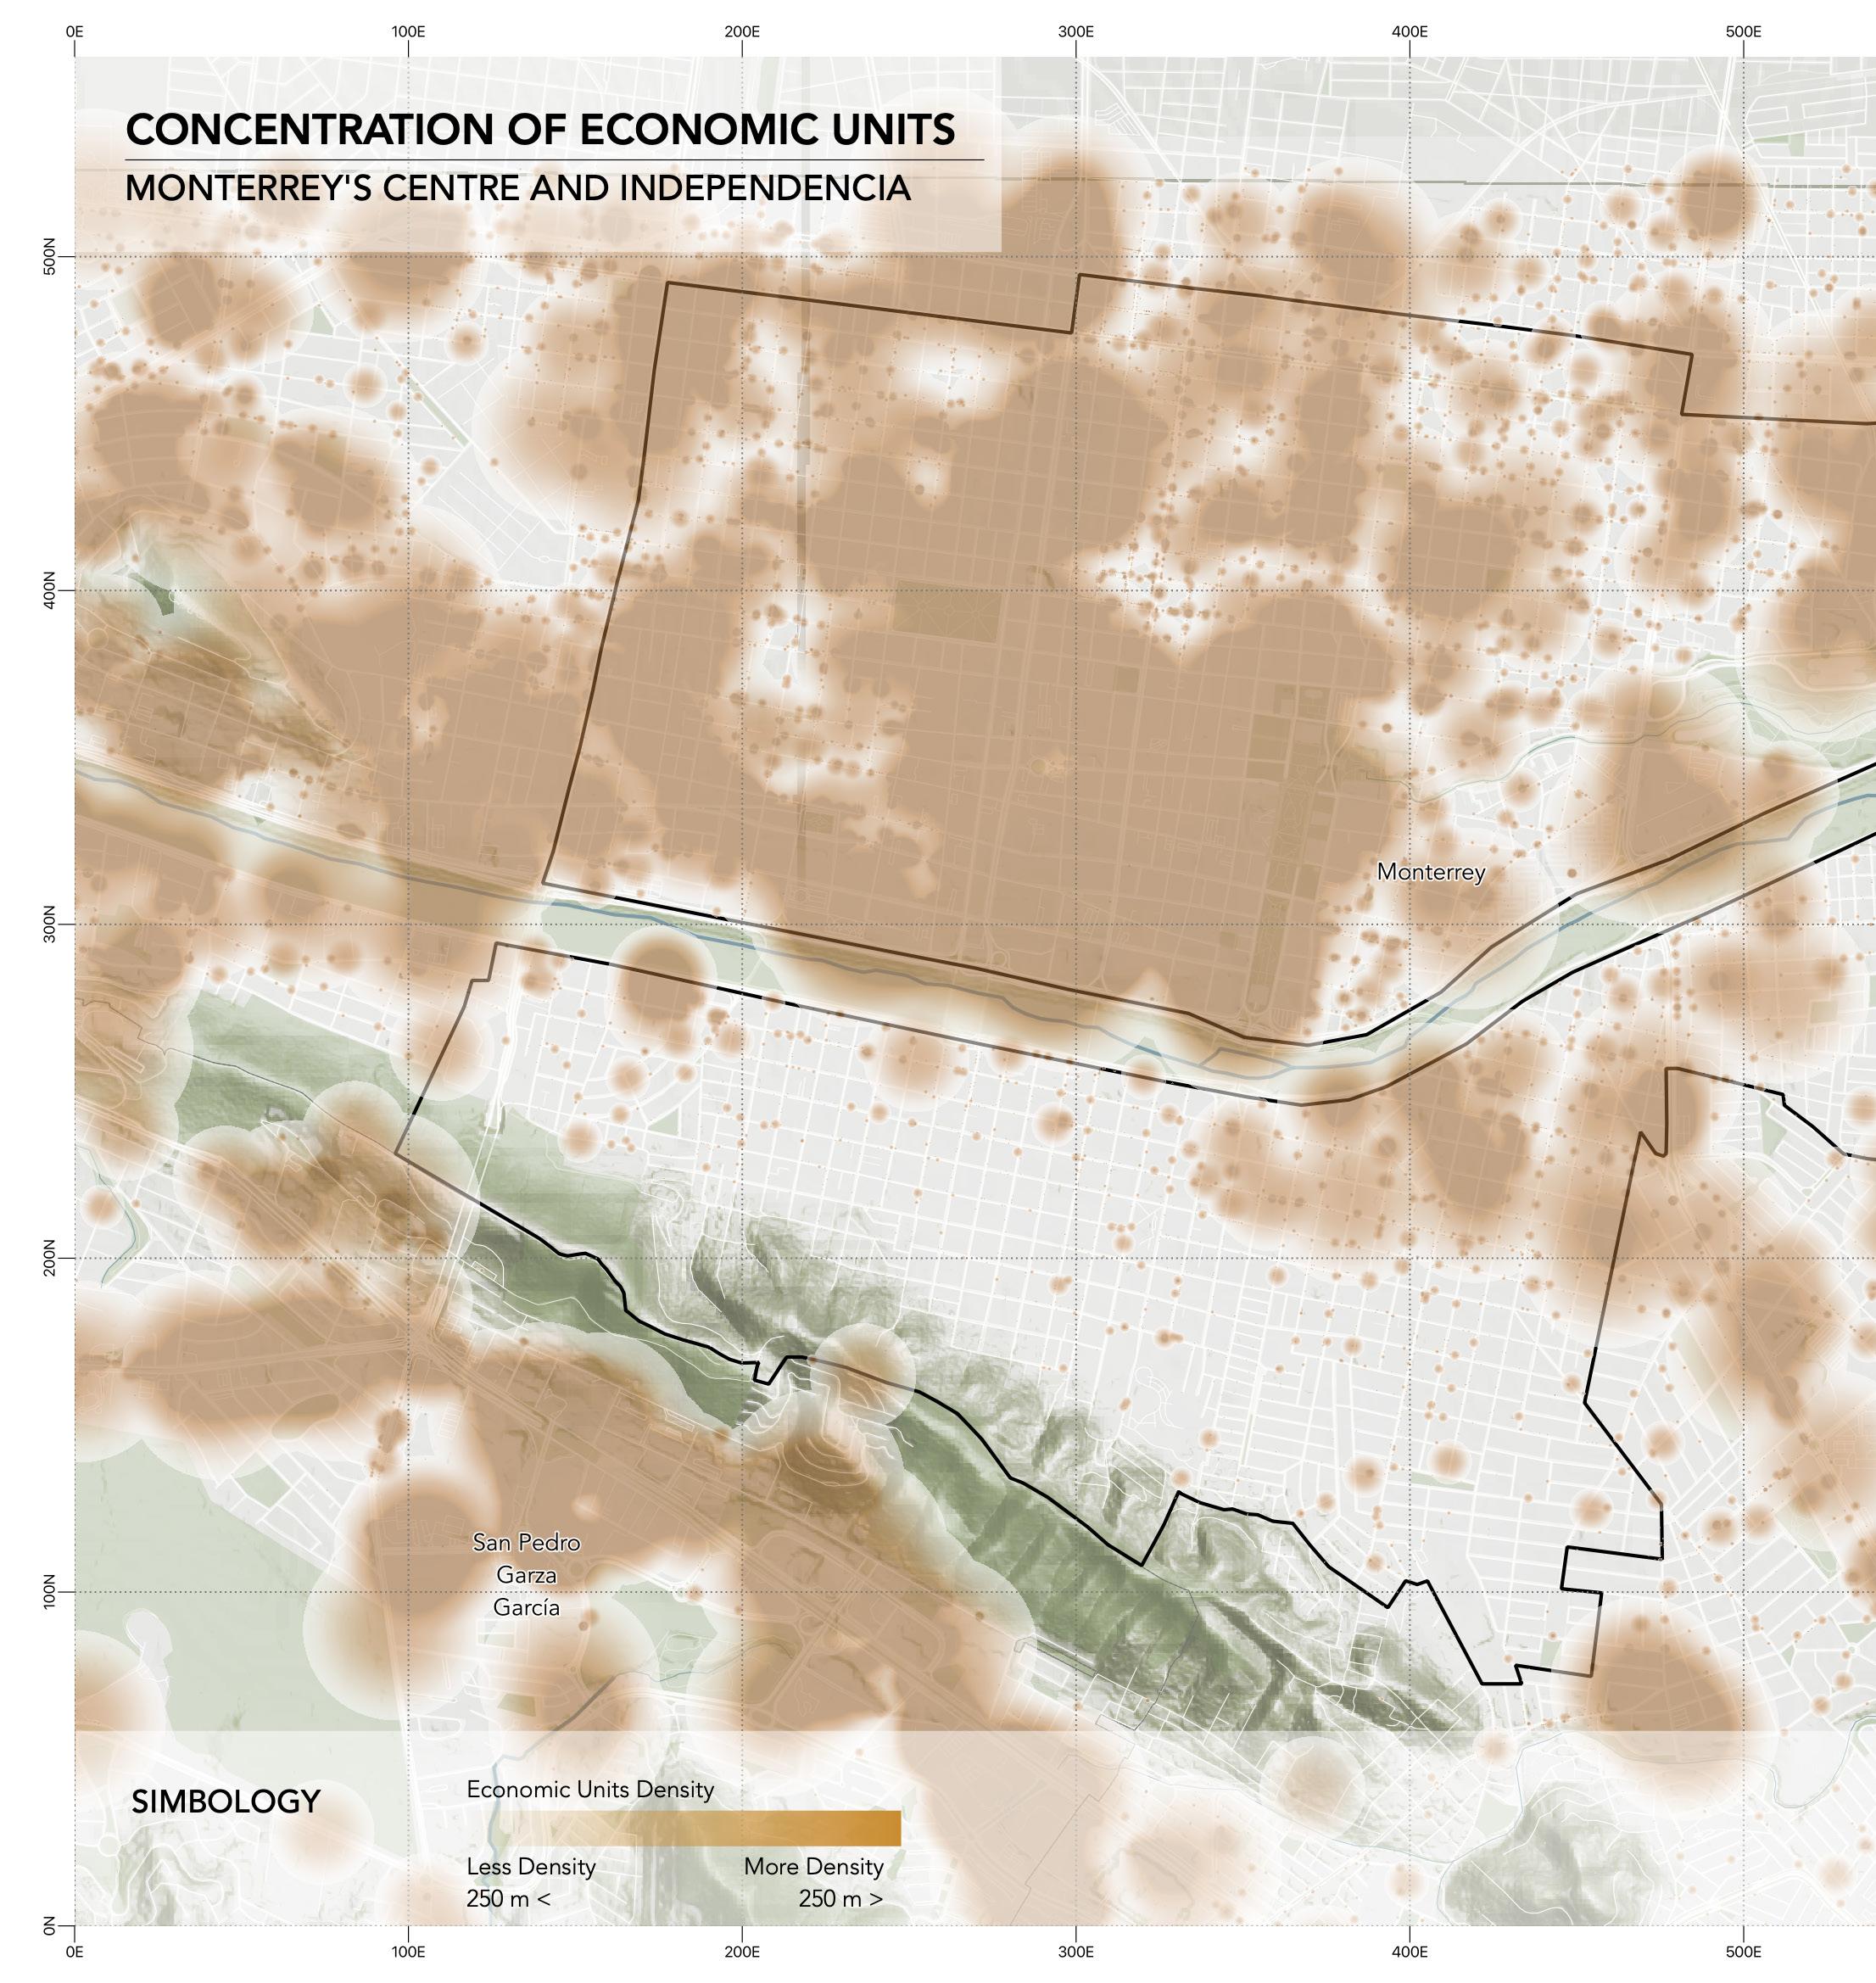
The study zone delimited represents an important pole of economic activity. The most evident economic activity zone on the map, is located in the northern area of the polygon. Each economic activity is represented on the map with a distance of 250 m, as a parameter to refer to the walkability.
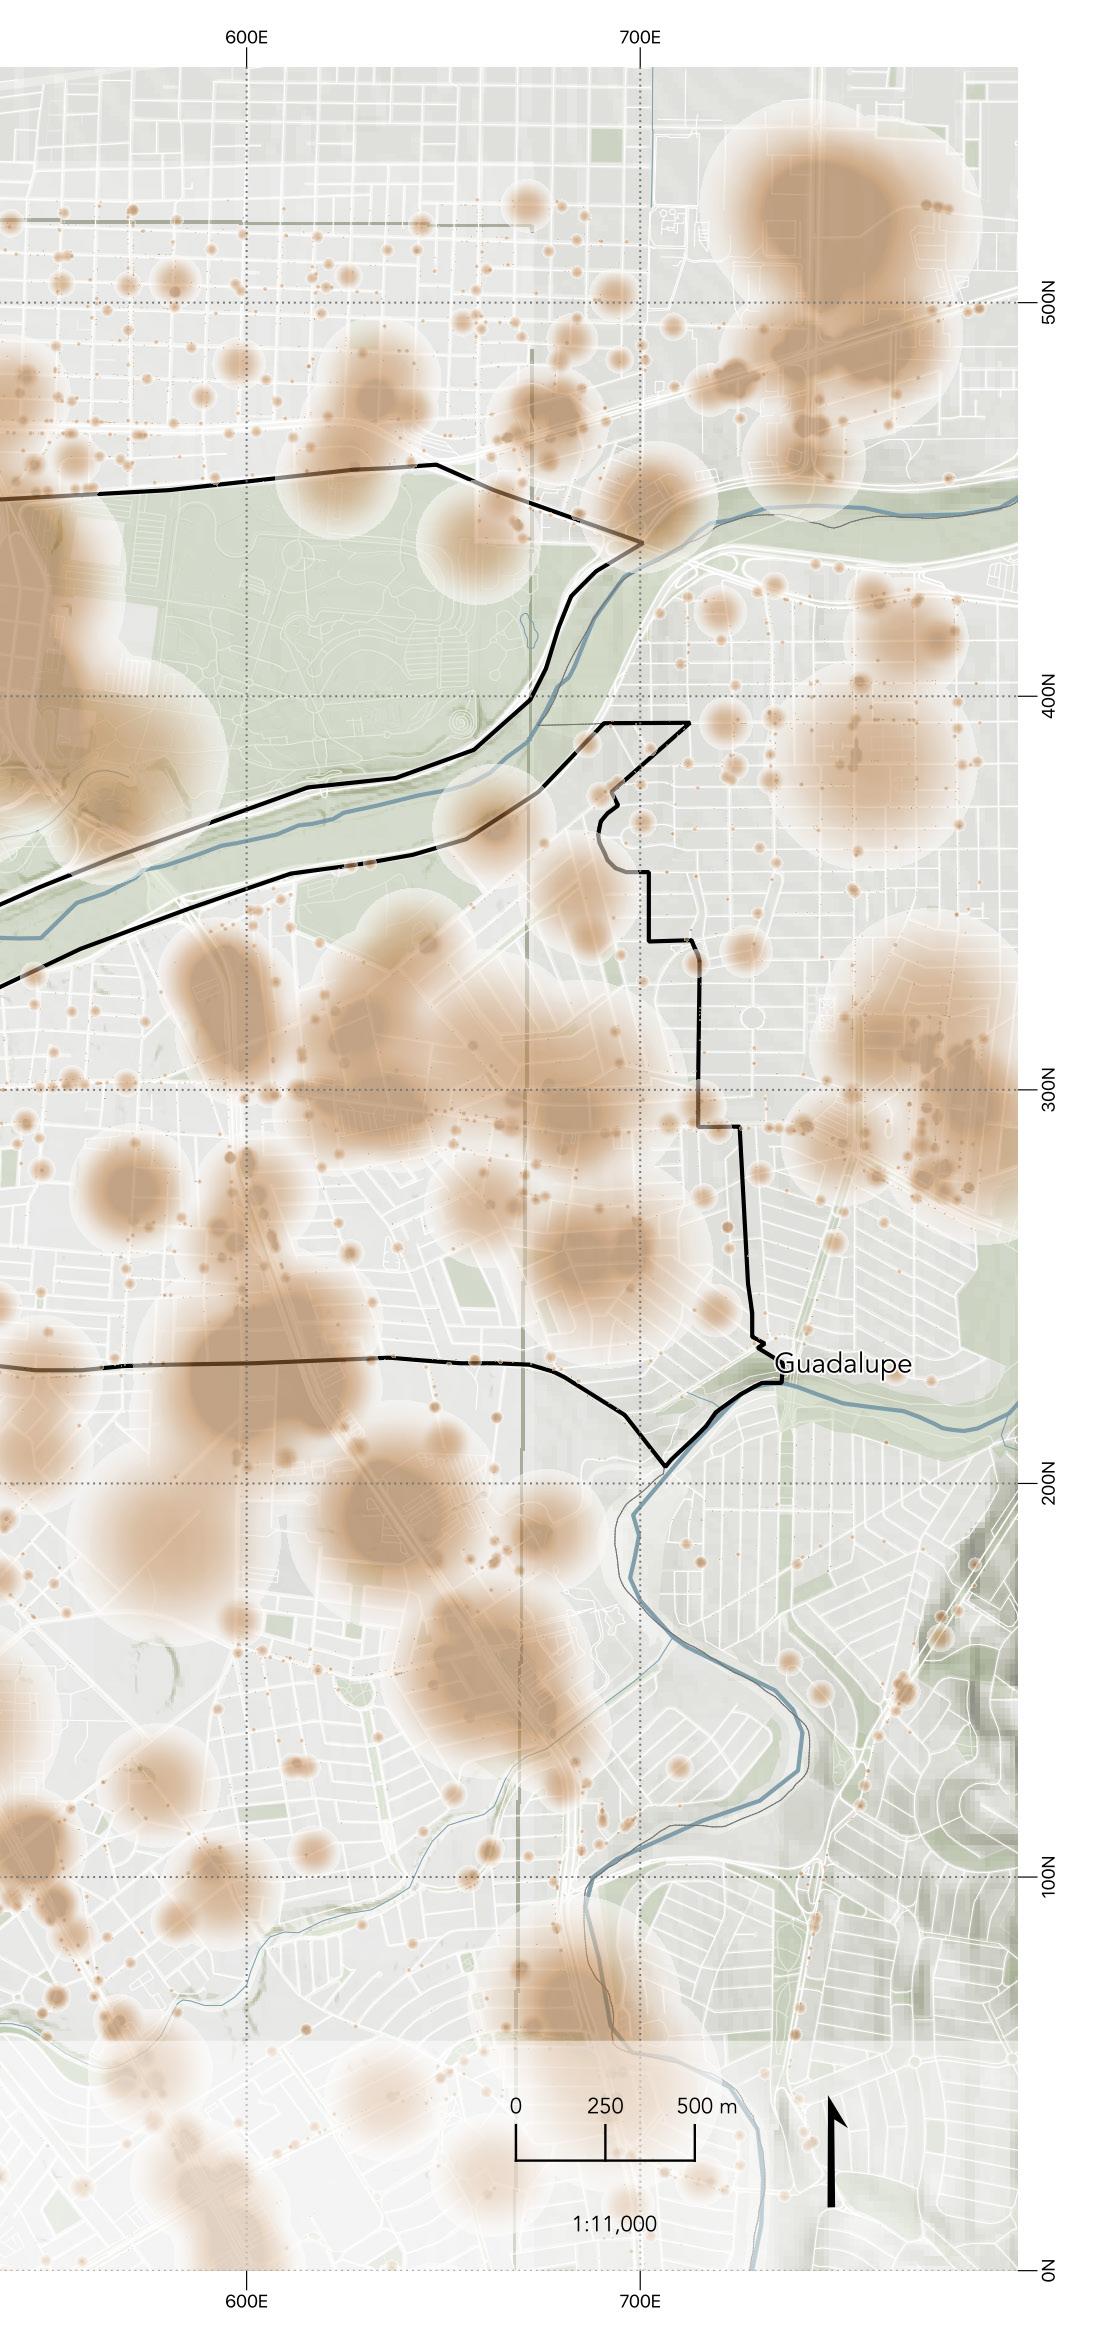
The concentration on the North can be easily related to the zoning in the area, where the commercials are the predominant floor use over other uses. From another point of view, the historical and cultural value zones are an asset to the zone, and an effect on this would be that more inhabitants and visitors will come to this part of the city to consume.
On the Southern part of the river, can be seen that there are also economic units distributed along Morones Prieto Avenue and as getting closer to Distrito Tec.
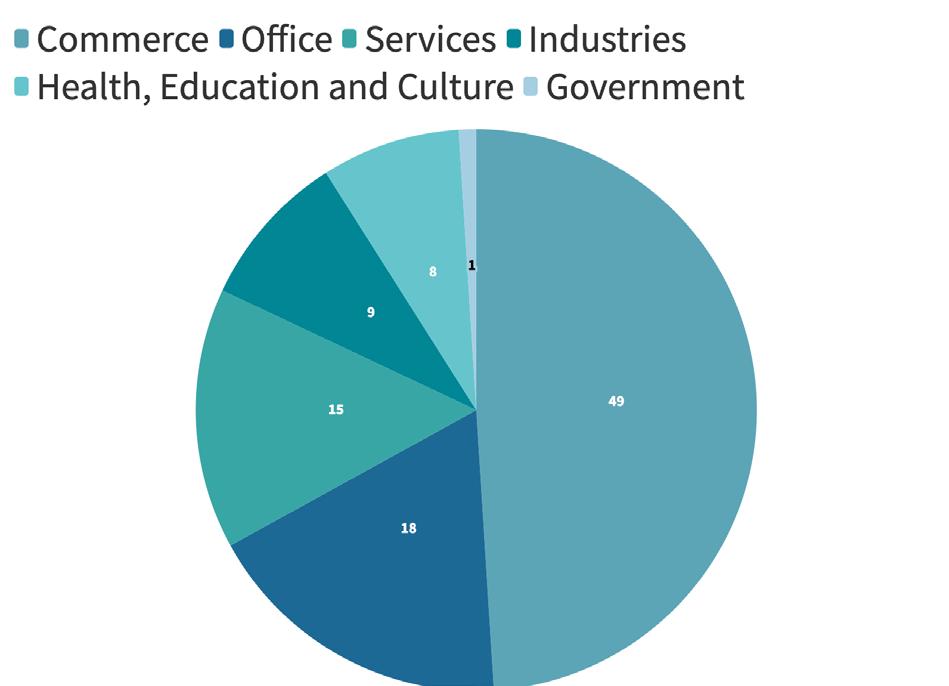
There are 15,776 units, whose categories are distributed as follows:
65
Right: Map elaborated by Paulina Ramírez in QGIS with information from DENUE 2020
Top: Classification of Economic units. Elaborated by Paulina Ramírez with information from DENUE 2020
It can be observed that the study zone is mostly commercial, but there is an agglomeration in the city center. Commercial corridors identified are Av. Cuauhtémoc, Av. Pino Suarez, Av. Madero, in the city center, and Av. Chapultepec on the East part of the site, among others.
Commercial
A curious thing about the locations of the industry is that most of all are concentrated in the Northern part of both neighborhoods. In the Southern part of the river, the concentration is less the closer it gets to the river, and the higher the concentration. For the Northern part of the river, the other way around, the farther away from the river, the
INDUSTRY
In the categorization of equipment, it is contemplated the health sector, educational sector, and culture sector. It can be seen that there is more coverage in equipment for the northern part of the river than in the South, even though it’s known that the southern part has more population than the northern.
EQUIPMENT
66
Right: Map elaborated by Paulina Ramírez in QGIS with information from DENUE 2020
Right: Map elaborated by Paulina Ramírez in QGIS with information from DENUE 2020
Right: Map elaborated by Paulina Ramírez in QGIS with information from DENUE 2020
The governmental facilities are mainly located in the northern part of the river, close to the historical and cultural zones, such as the Macroplaza.
GOVERNMENTAL
On this map, there is clear segregation made by the Santa Catarina River of the offices’ location. It can be seen that the closer it’s to the river and the more highways there are, the more concentration there is.

OFFICES
The services category shows a diverse location throughout the study zone, with a higher concentration as it gets closer to the Santa Catarina River.
SERVICES
67
Right: Map elaborated by Paulina Ramírez in QGIS with information from DENUE 2020
Right: Map elaborated by Paulina Ramírez in QGIS with information from DENUE 2020
Right: Map elaborated by Paulina Ramírez in QGIS with information from DENUE 2020
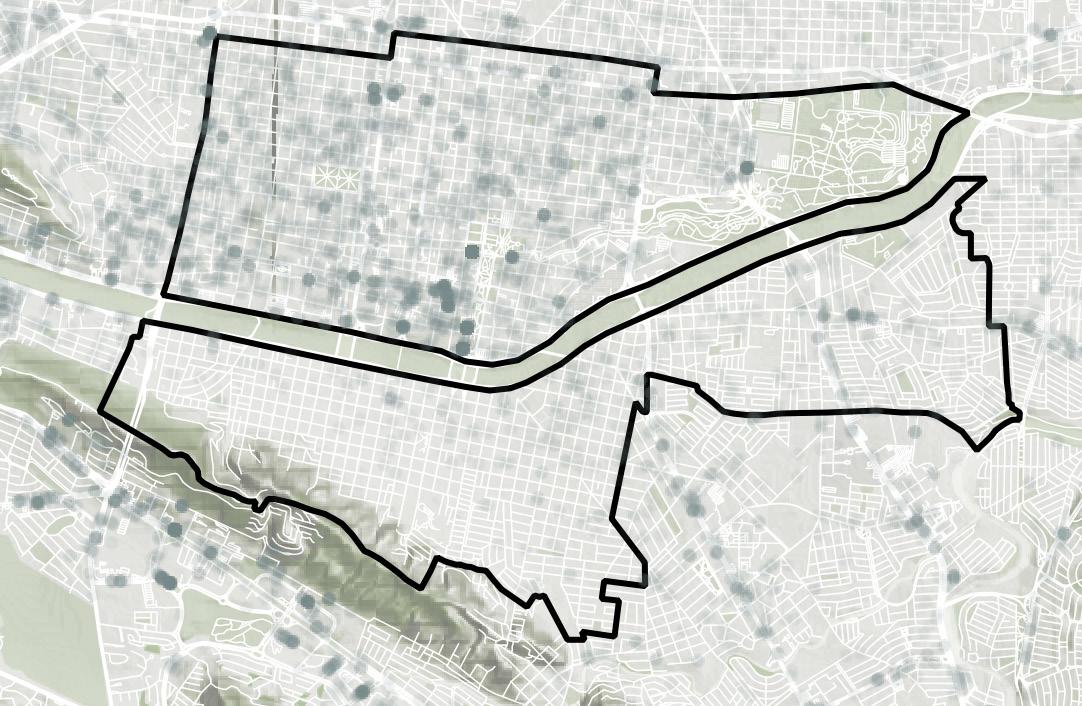
68
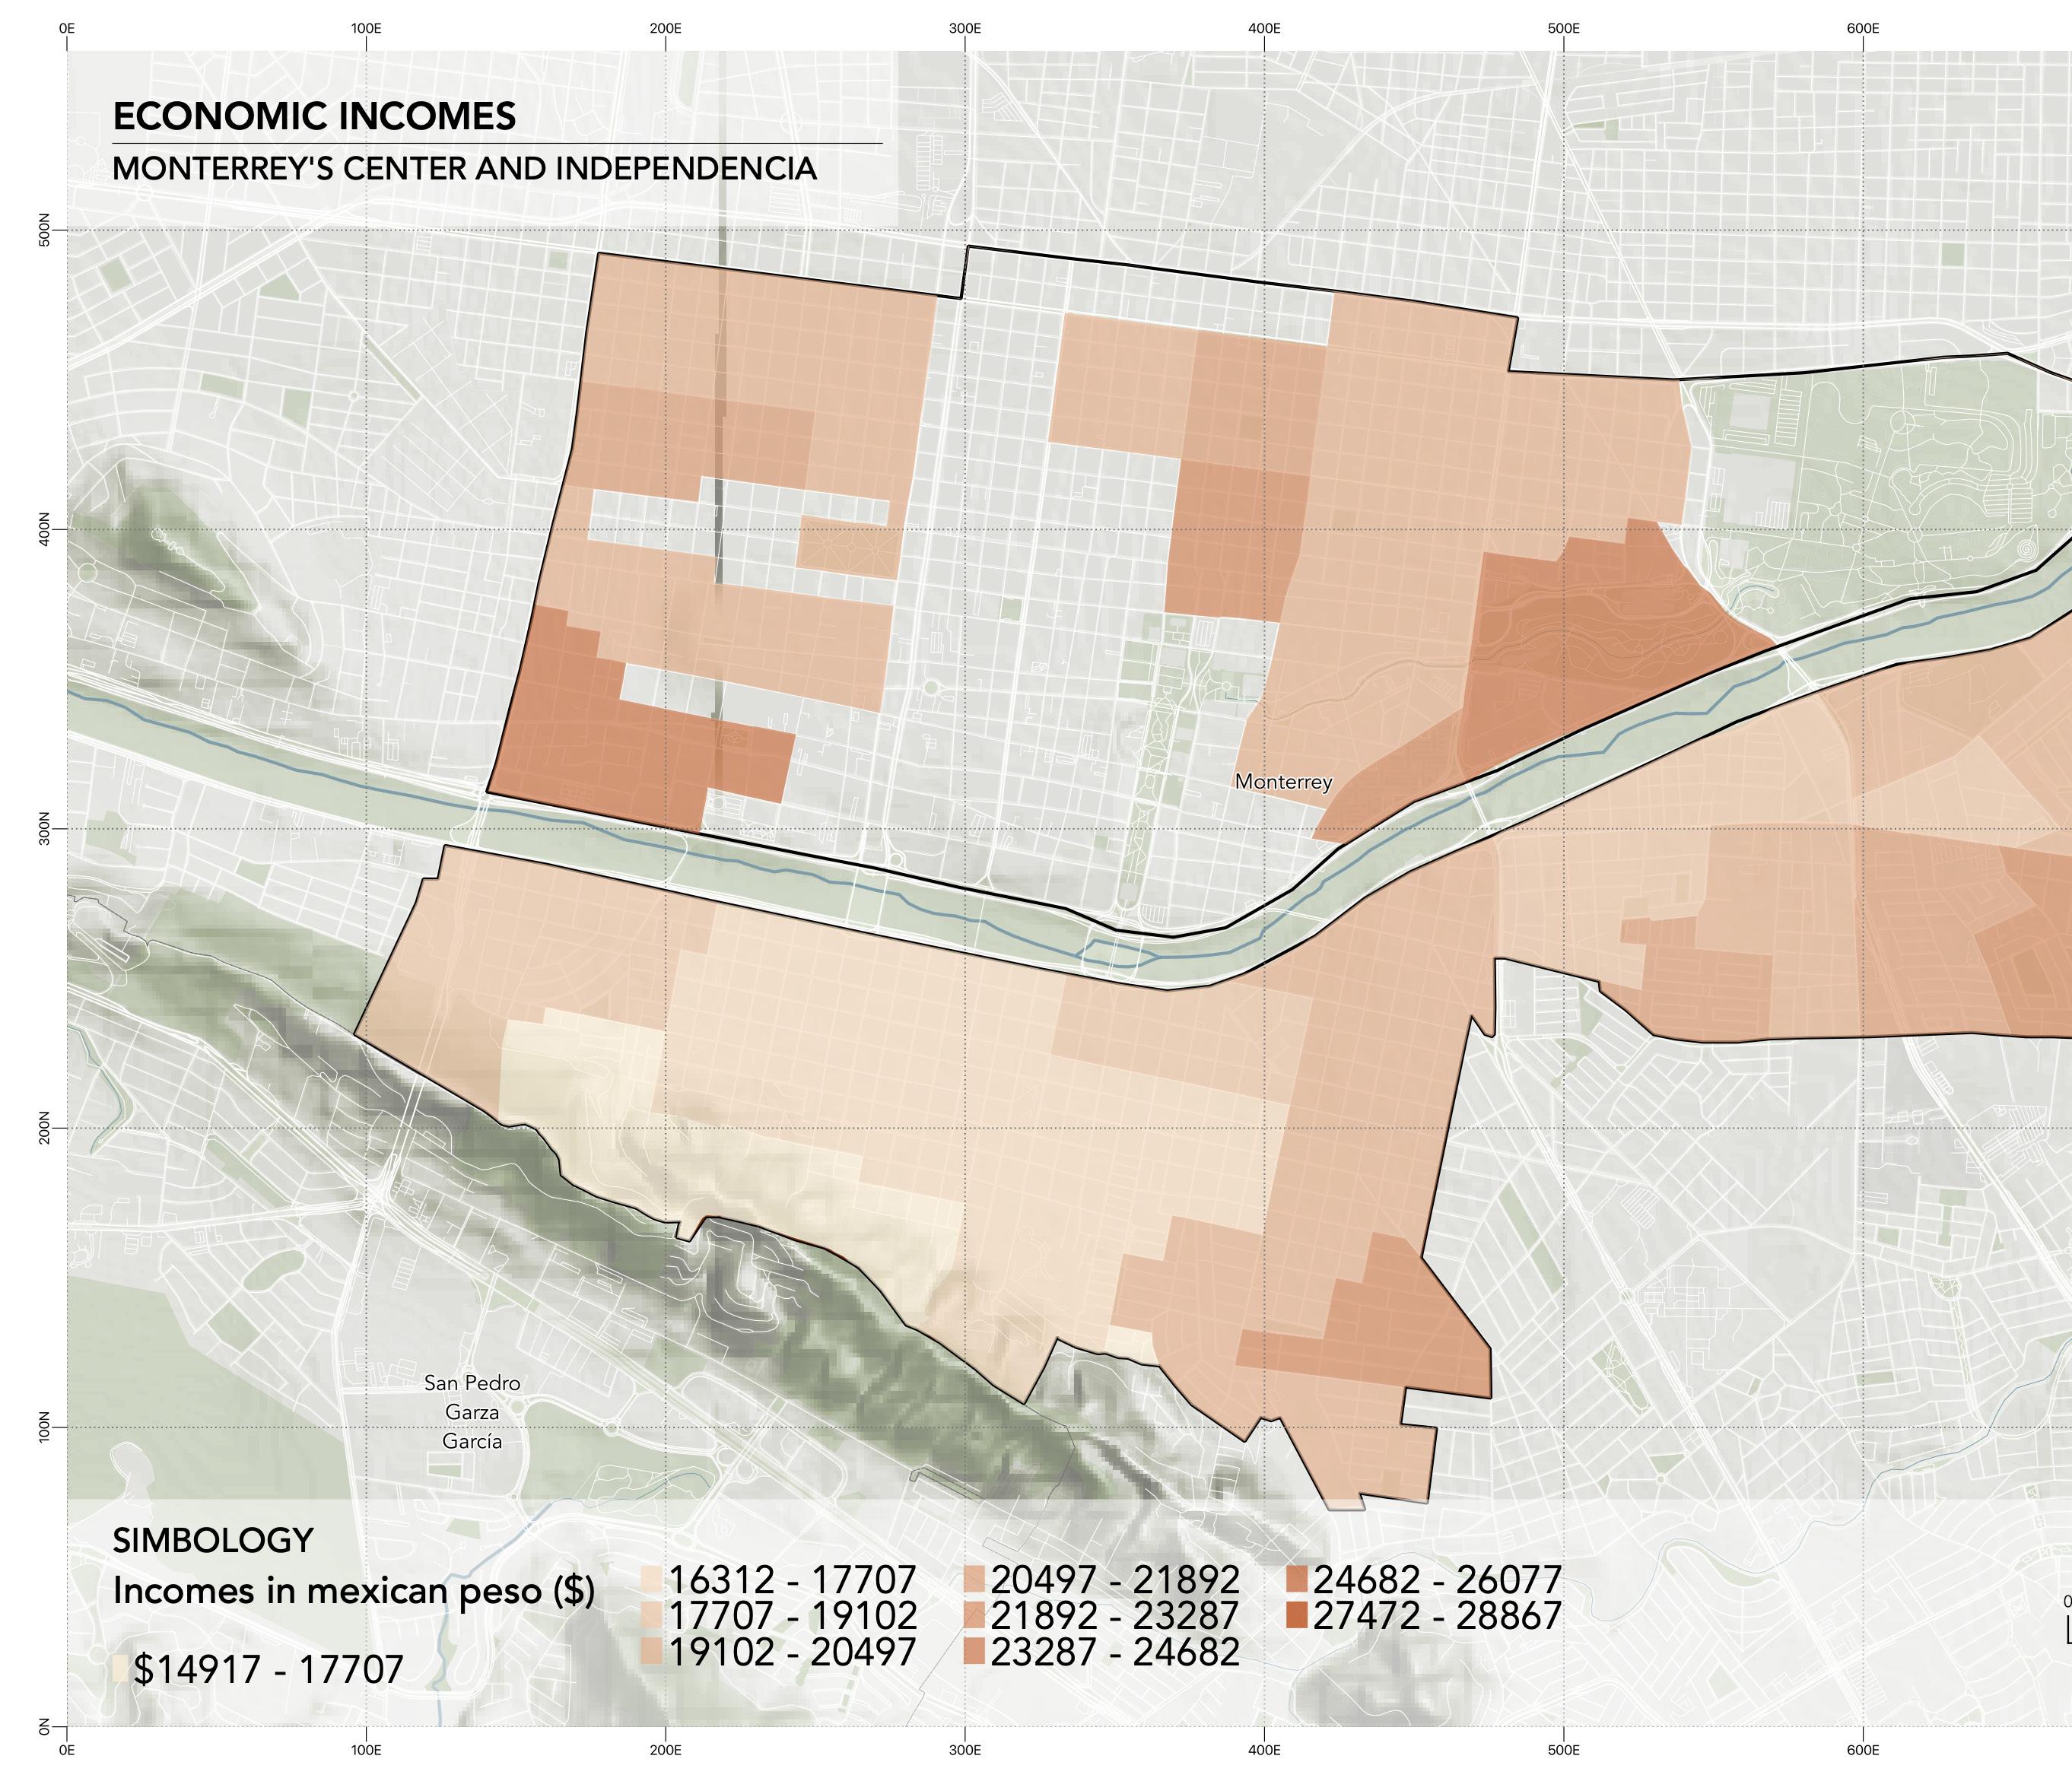
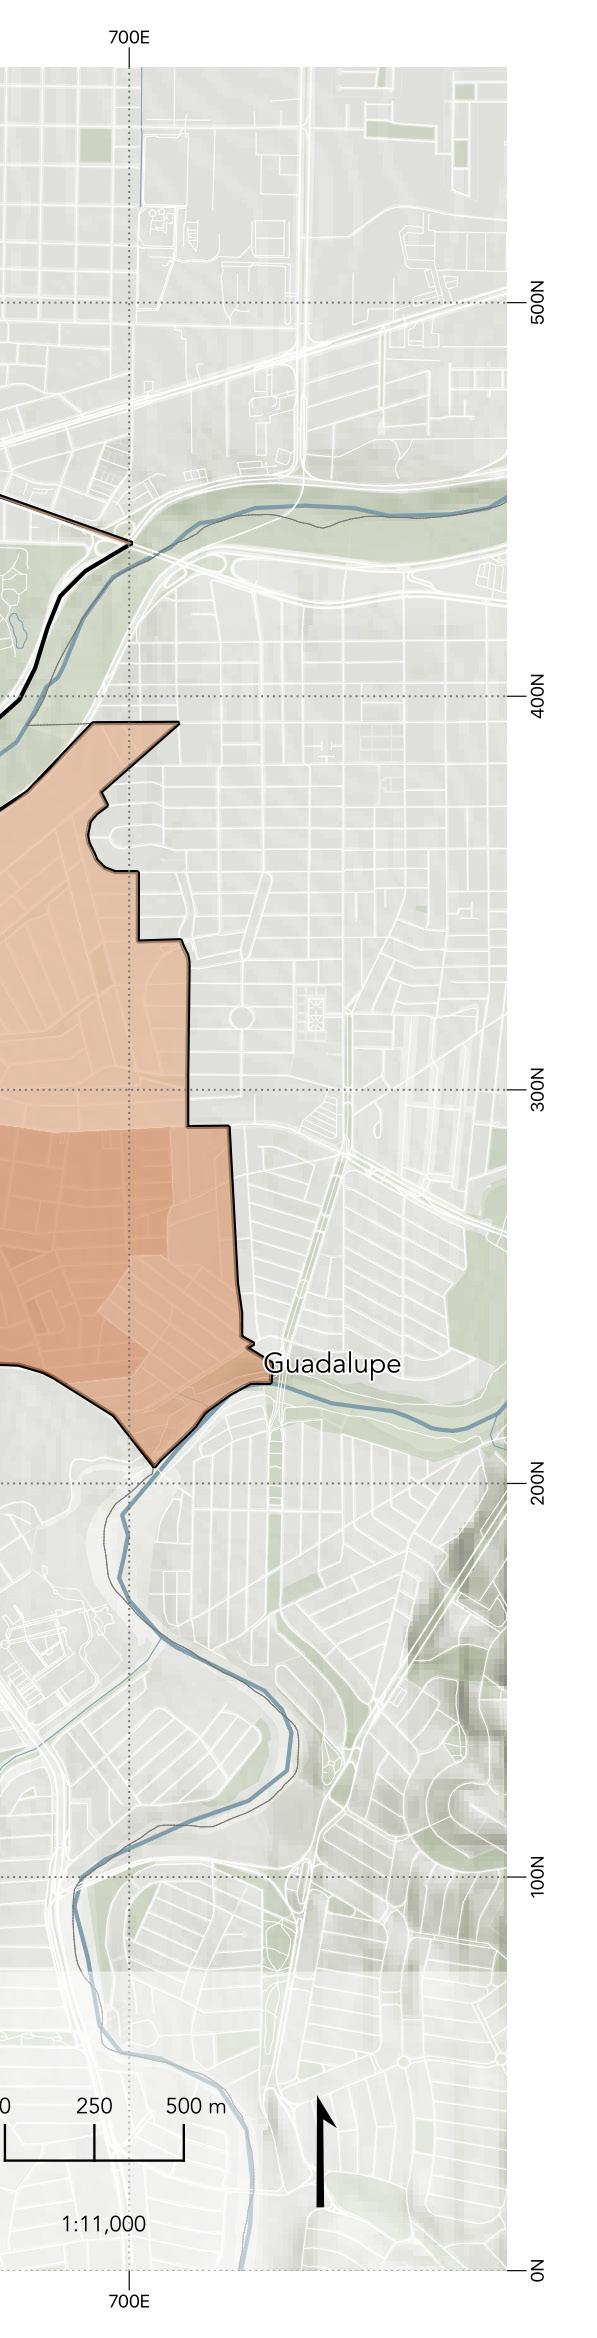
HOUSEHOLD INCOMES
The data used was according to an estimation generated from microsimulation, taking into account data from the Income and Expenditure Survey (ENIGH - Encuesta de Ingreso y Gasto) and the social profile of households generated from data from the 2020 Population and Housing Census. These two methods take into consideration the delimitation of the AGEBS to assign the data, so the incomes generated are ranged in Mexican pesos for each AGEB. In the representation there is a part in which no data is seen, this relates to the zoning of the area which in this part is mainly commercial, followed by a cultural value, heritage value, green areas, facilities, and services. (See the Zoning map for more information).
Now analyzing this information, it can be seen that in the south polygon, the topography plays a significant role in the income, the higher or with more proximity to the Cerro Loma Larga, the less the income.
The household income also has a relationship with the neighborhoods. Independencia neighborhood has a laborer character in history and presents spatial segregation from the North polygon due to economic incomes. The segregation of the polygon can be reflected in numbers by having the lowest housing income in the study area of $14,000 mxn. Nevertheless,
these incomes are way too high so research was made.
According to Market Data Mexico, “Independencia households have a socioeconomic level type D+, with an estimated household income of MXN $15,300 and MXN $3,920 per person”. The income of $14,000 mxn is a sum of all the incomes of the persons living in a household unit. This relates that at the higher density and higher economically active population.
The East part of the polygon shows the average income that ranges between $19,000 - $23,000 mxn, the increase can be related to the proximity to Distrito Tec.
Clearly, the North polygon shows the highest incomes, this can be attributed to the urban policies to city center gentrification, which resulted in the highest monthly income making people form outside the polygon to habit this zone and causing it unavailable for original inhabitants. The highest monthly income estimated in the area is $28,867 mxn.
69
“..topography plays an important role on the incomes, the higher or with more proximity to the cerro loma larga the less the
Top: Map elaborated by Paulina Ramirez in QGIS with data form ENIGH and CENSO 2020. Bottom: Images from Reforma newspaper and Lau G.
70
Health and Wellbeing
“This dimension relates to people – the health and well-being of everyone living and working in the city.” (The Rockefeller Foundation)
Health is a state of complete physical, mental and social wellbeing and not merely the absence of disease or infirmity. On the other hand, well-being is the experience of health, happiness and prosperity.
The dimension considers the extent to which the city enables everyone to meet their basic needs, how well the city supports diverse livelihood opportunities and if the city is able to safeguard the health of its population through its normal and emergency healthcare provisions.
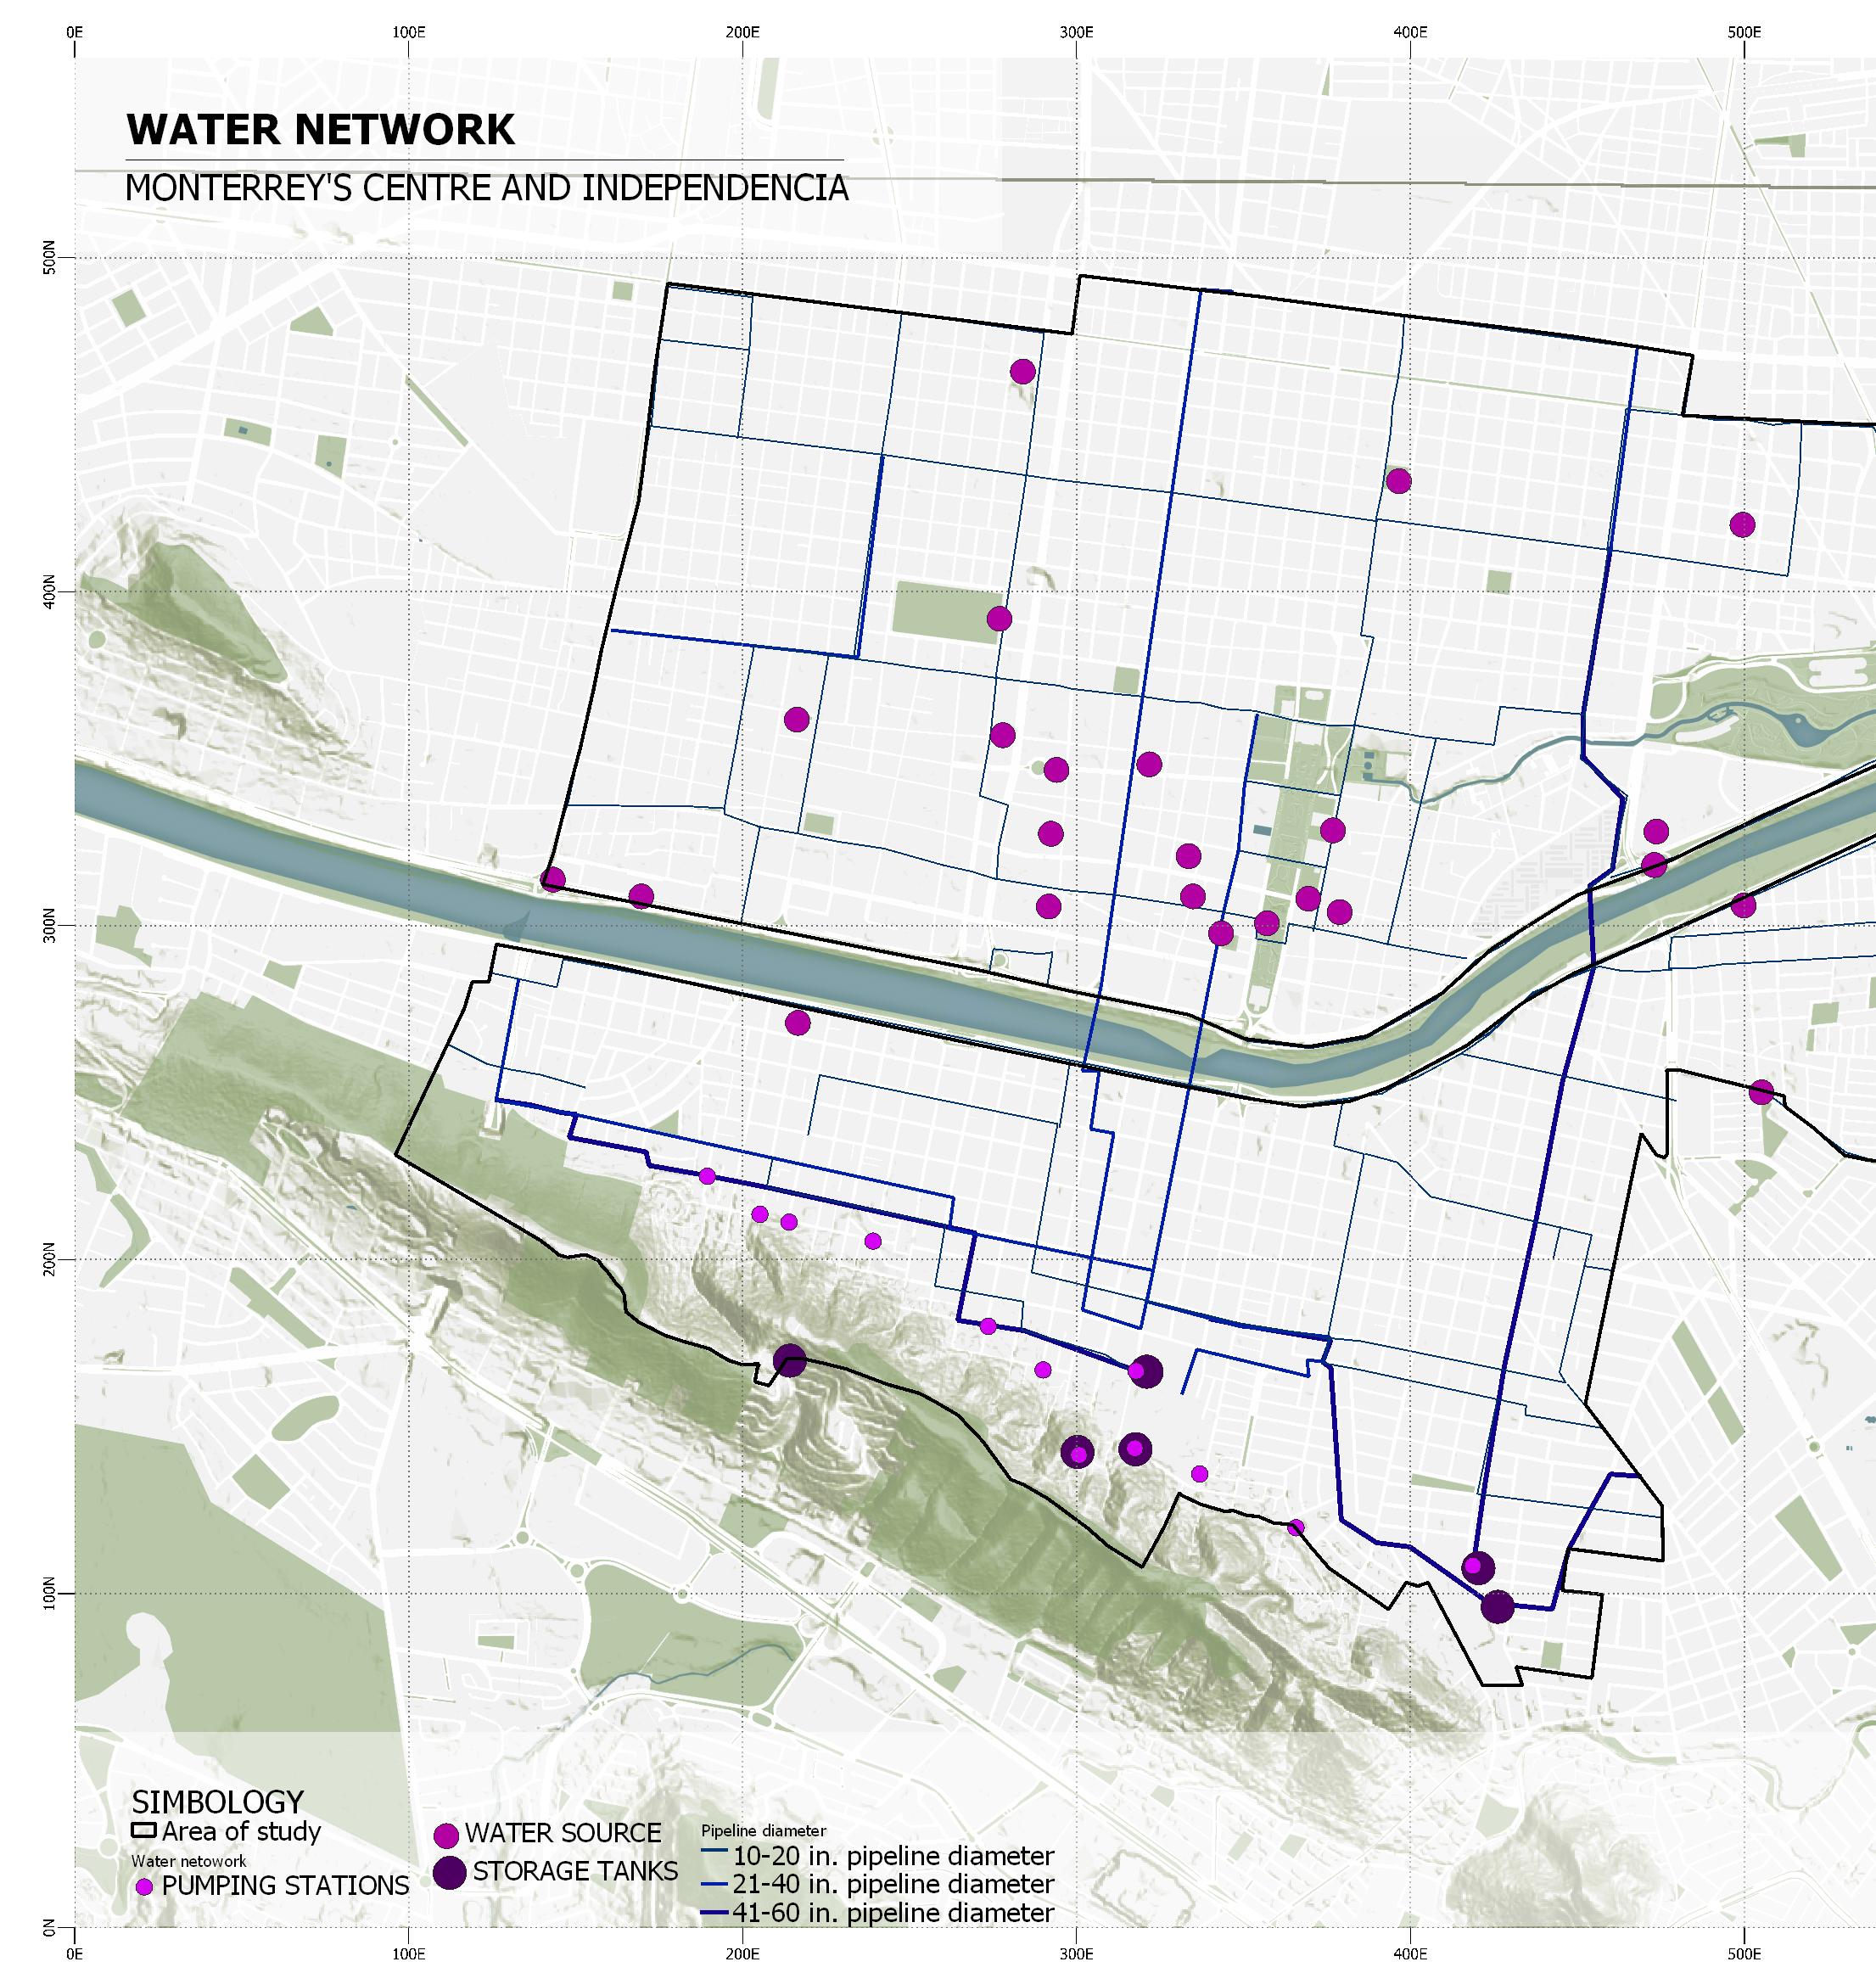
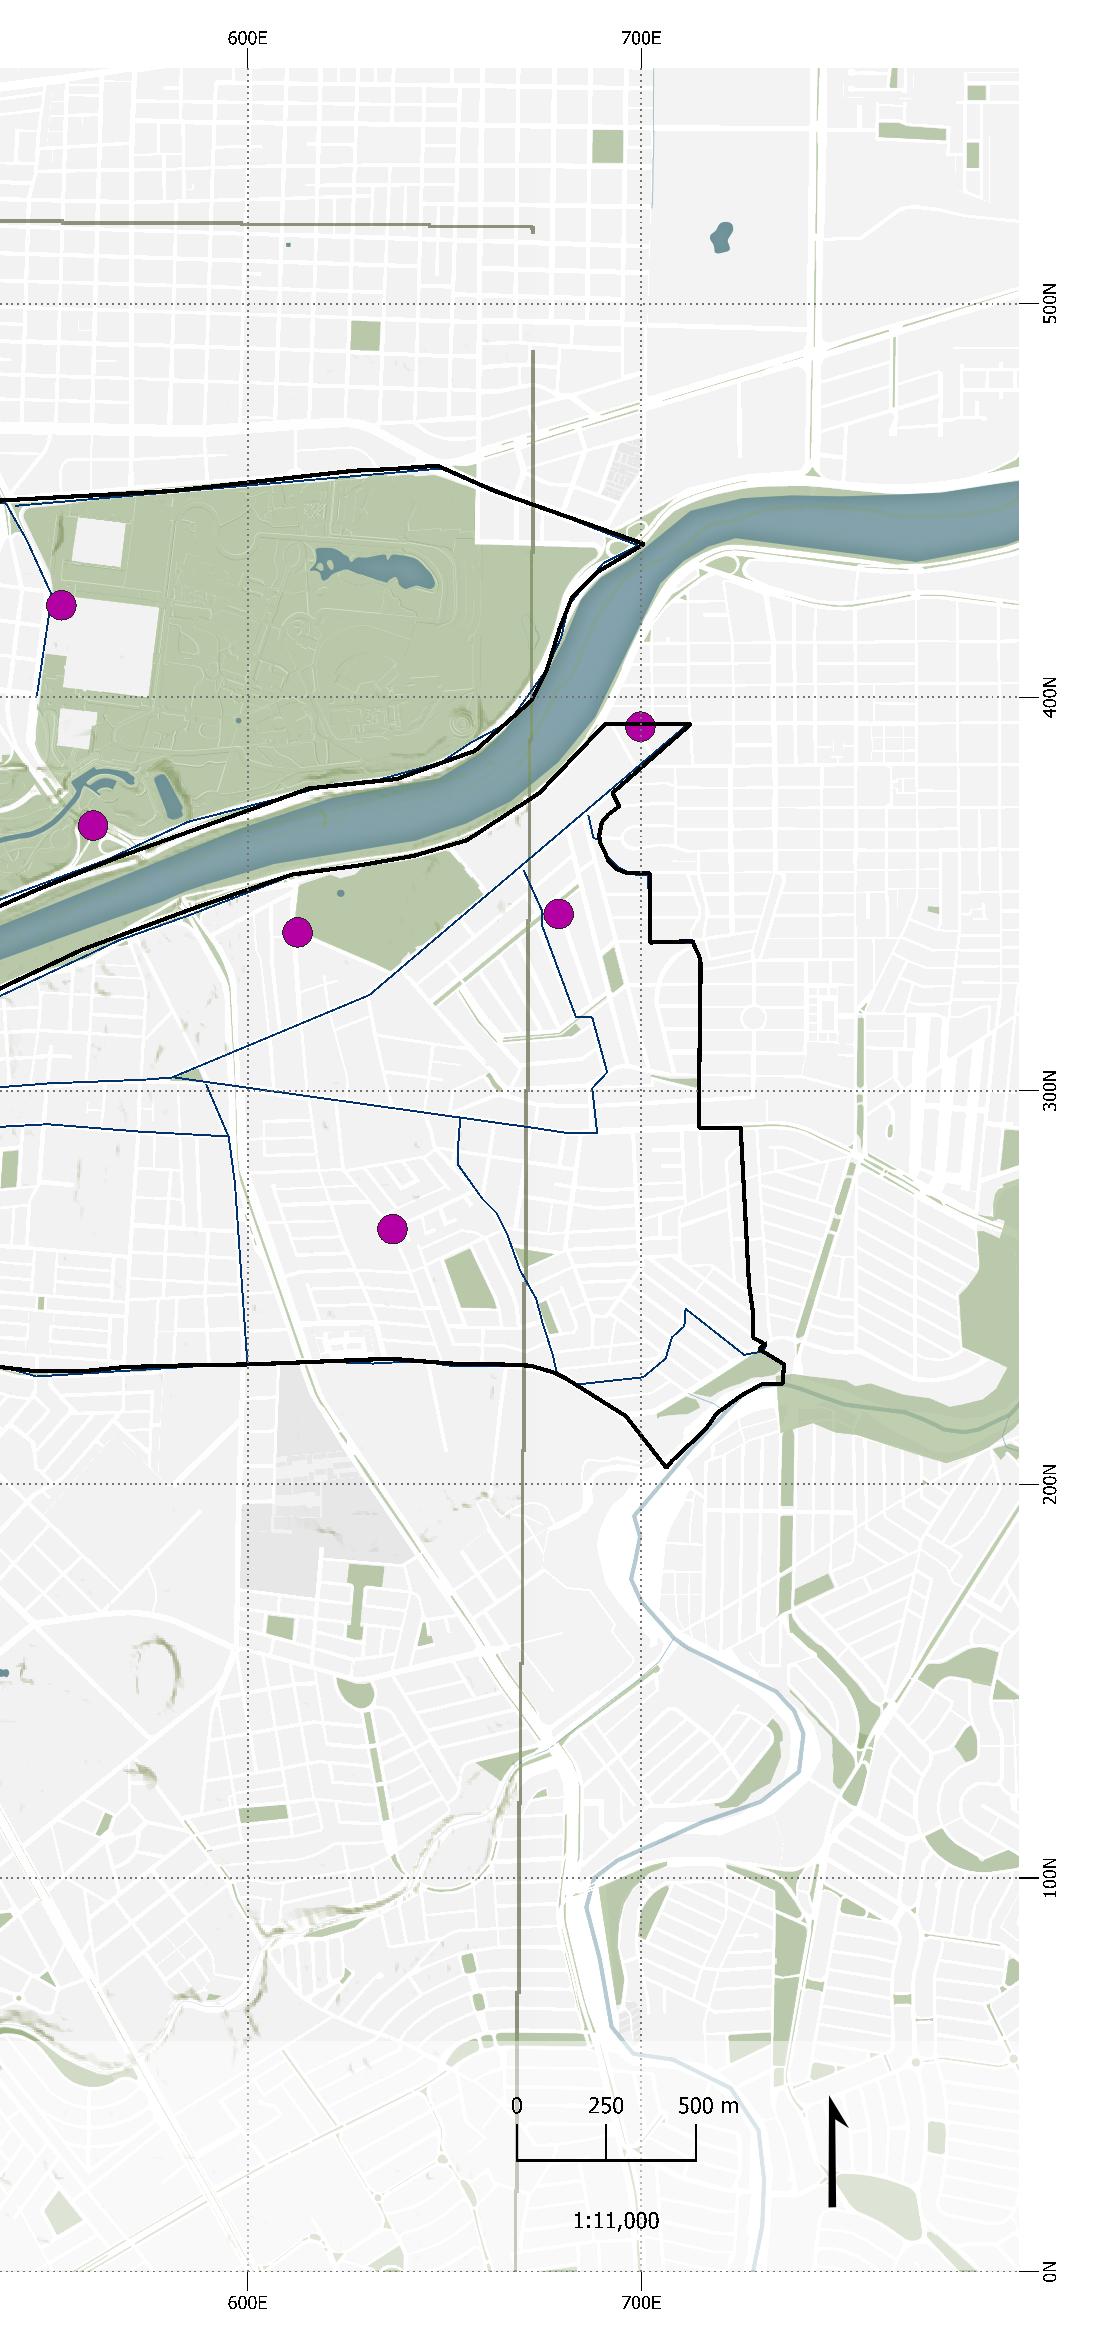
In this case, we are going to focus on some of the categories that compose this dimension, such as utilities (electricity, gas, water supply and sanitation) and food.
As we’ll see, the utilities in our polygon have a very high percentage, all of them close of reaching a full coverage. Also, according to a government report, the food basket in Monterrey Centre is ranked as the fifth with the cheapest price in Mexico.
71
Drinking water
72
“...neighbors in Independencia have reported that the water relief pipes don’t go past Libertad street.”
According to INEGI statistics, within the polygon there is 96.6% coverage of this essential service among the people that lives in the area. (INEGI, 2020)
However, due to the current water scarcity situation in the city, naturally, the area has been negatively affected in this aspect; especially high zones, where due to its topography it’s not possible to take water relief pipes, according to El Horizonte, neighbors in Independencia have reported that the water relief pipes don’t go past Libertad street, which causes people to have to walk multiple blocks to collect their water, which they also report is not drinkable. (El Horizonte, 2022)
73
Elaborated by Fernando Rodríguez with information from IMPLAN MTY (2013)
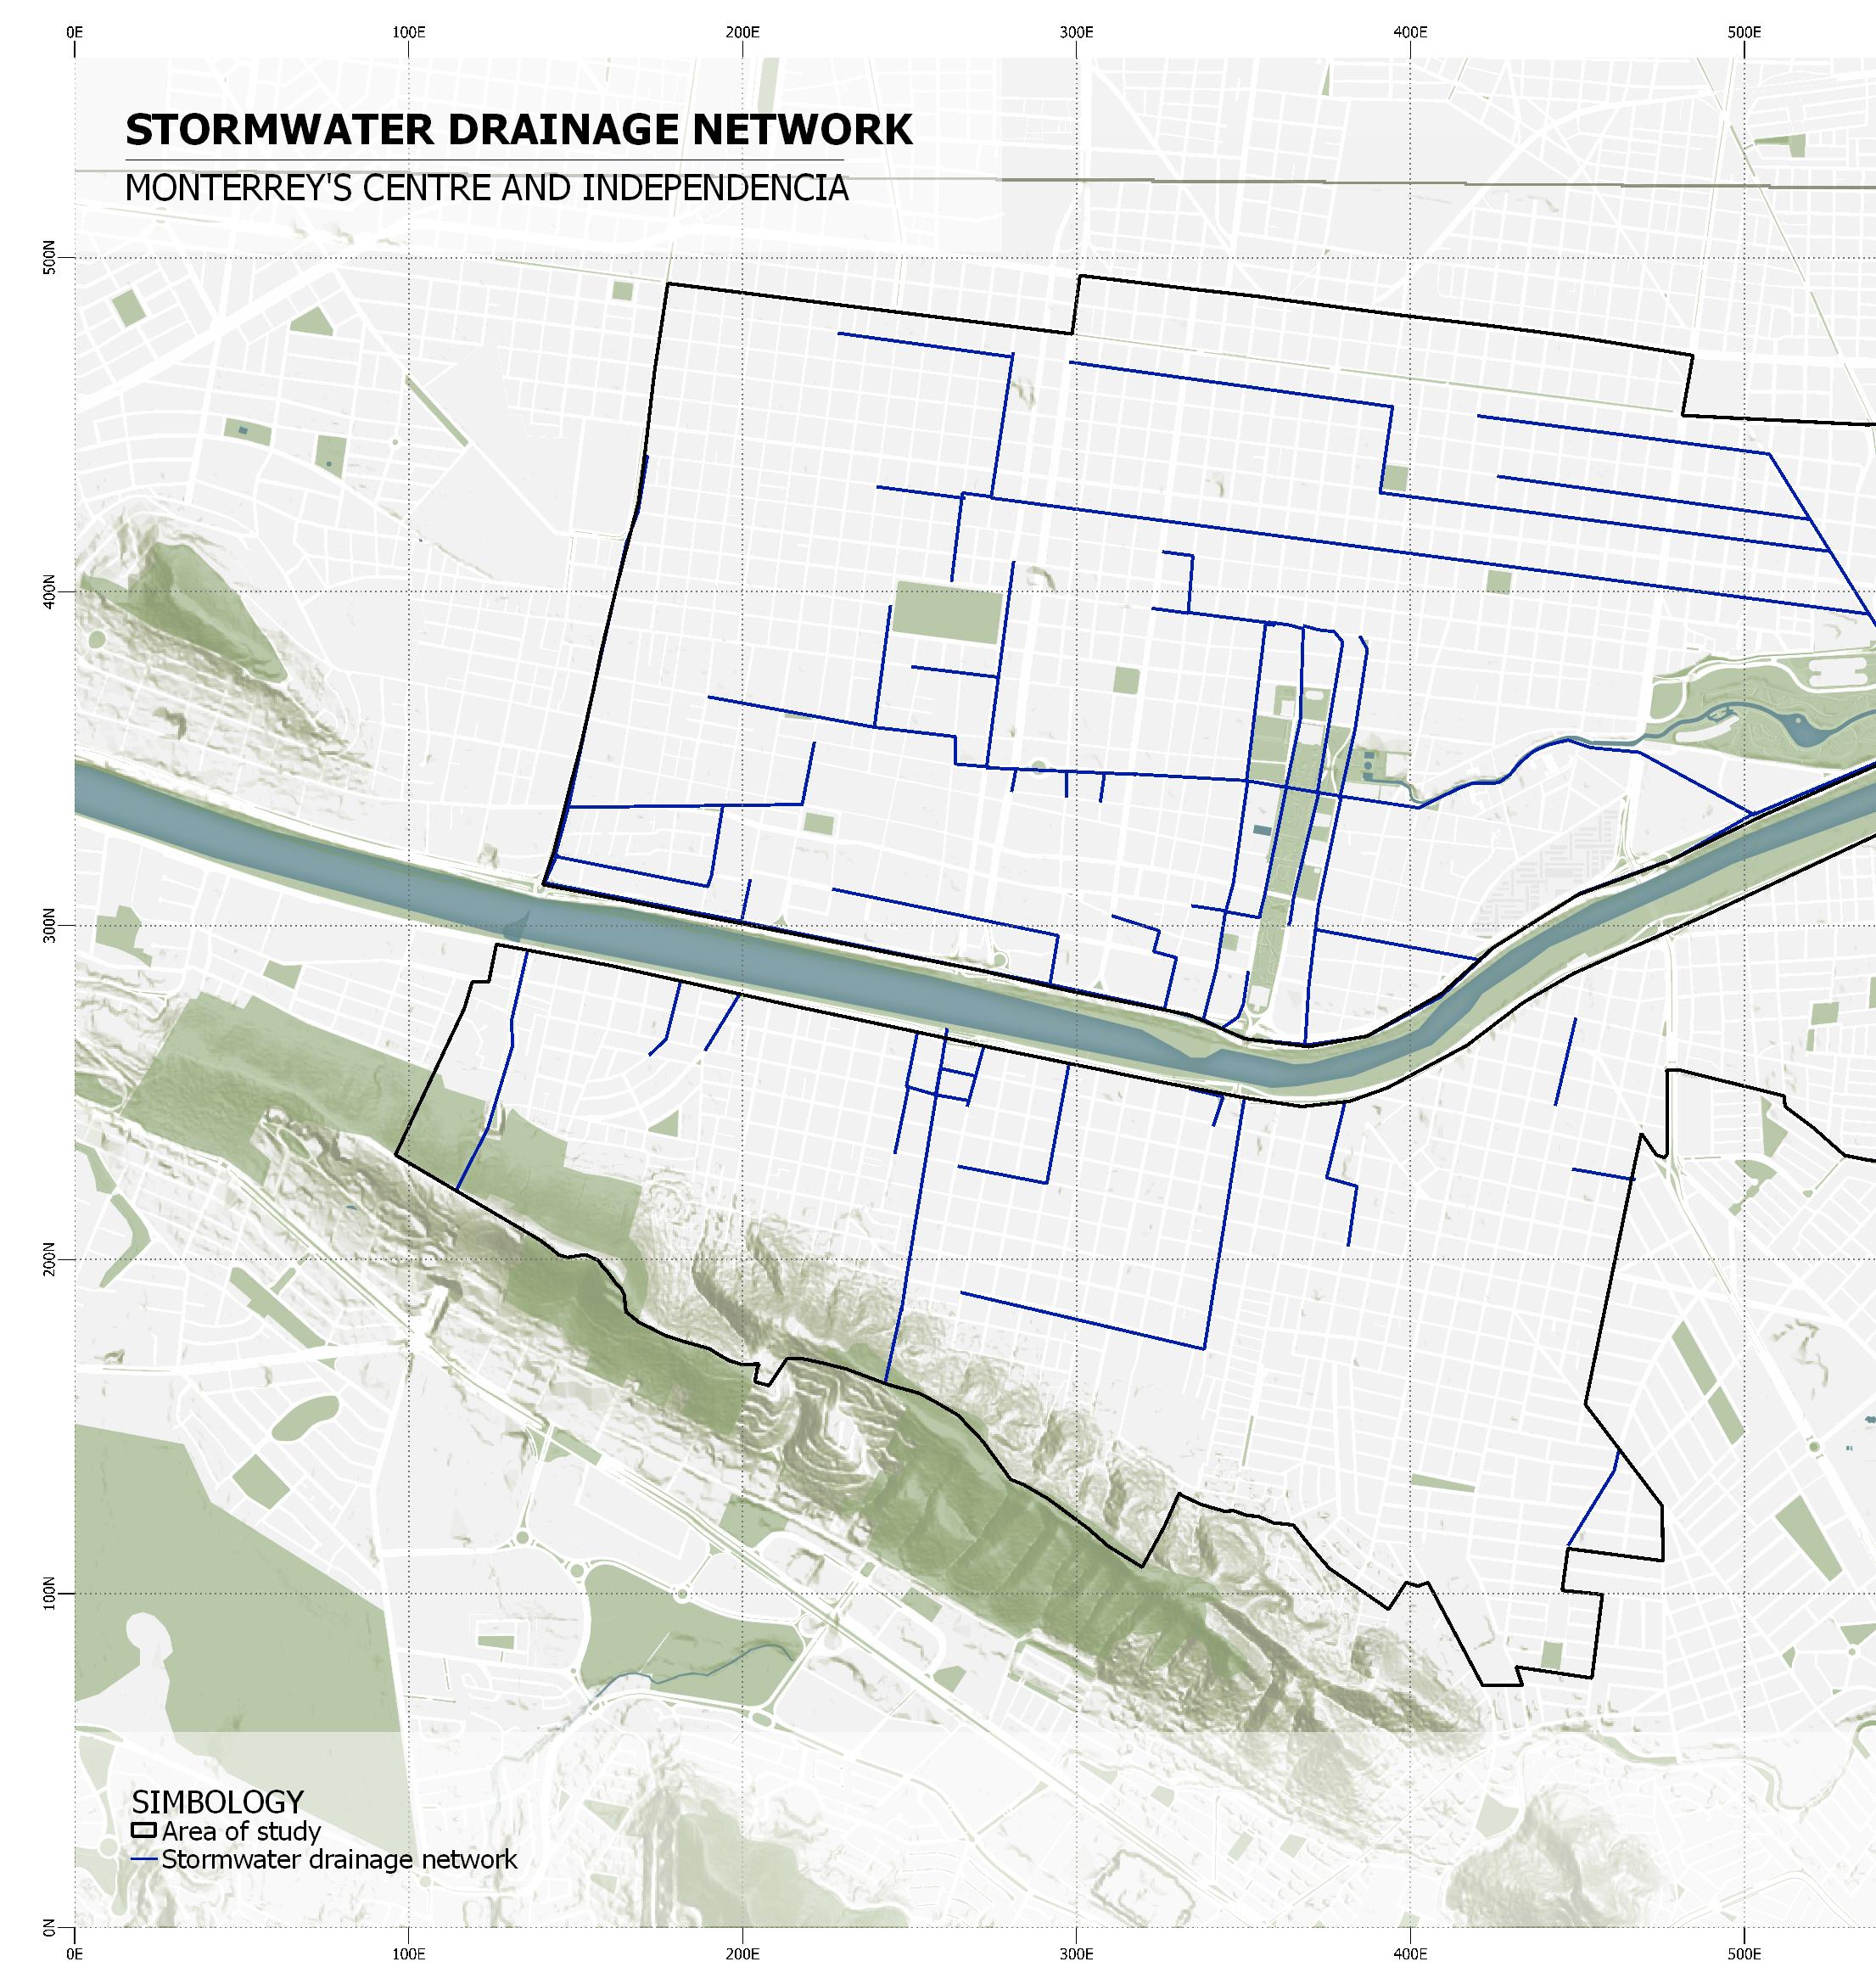
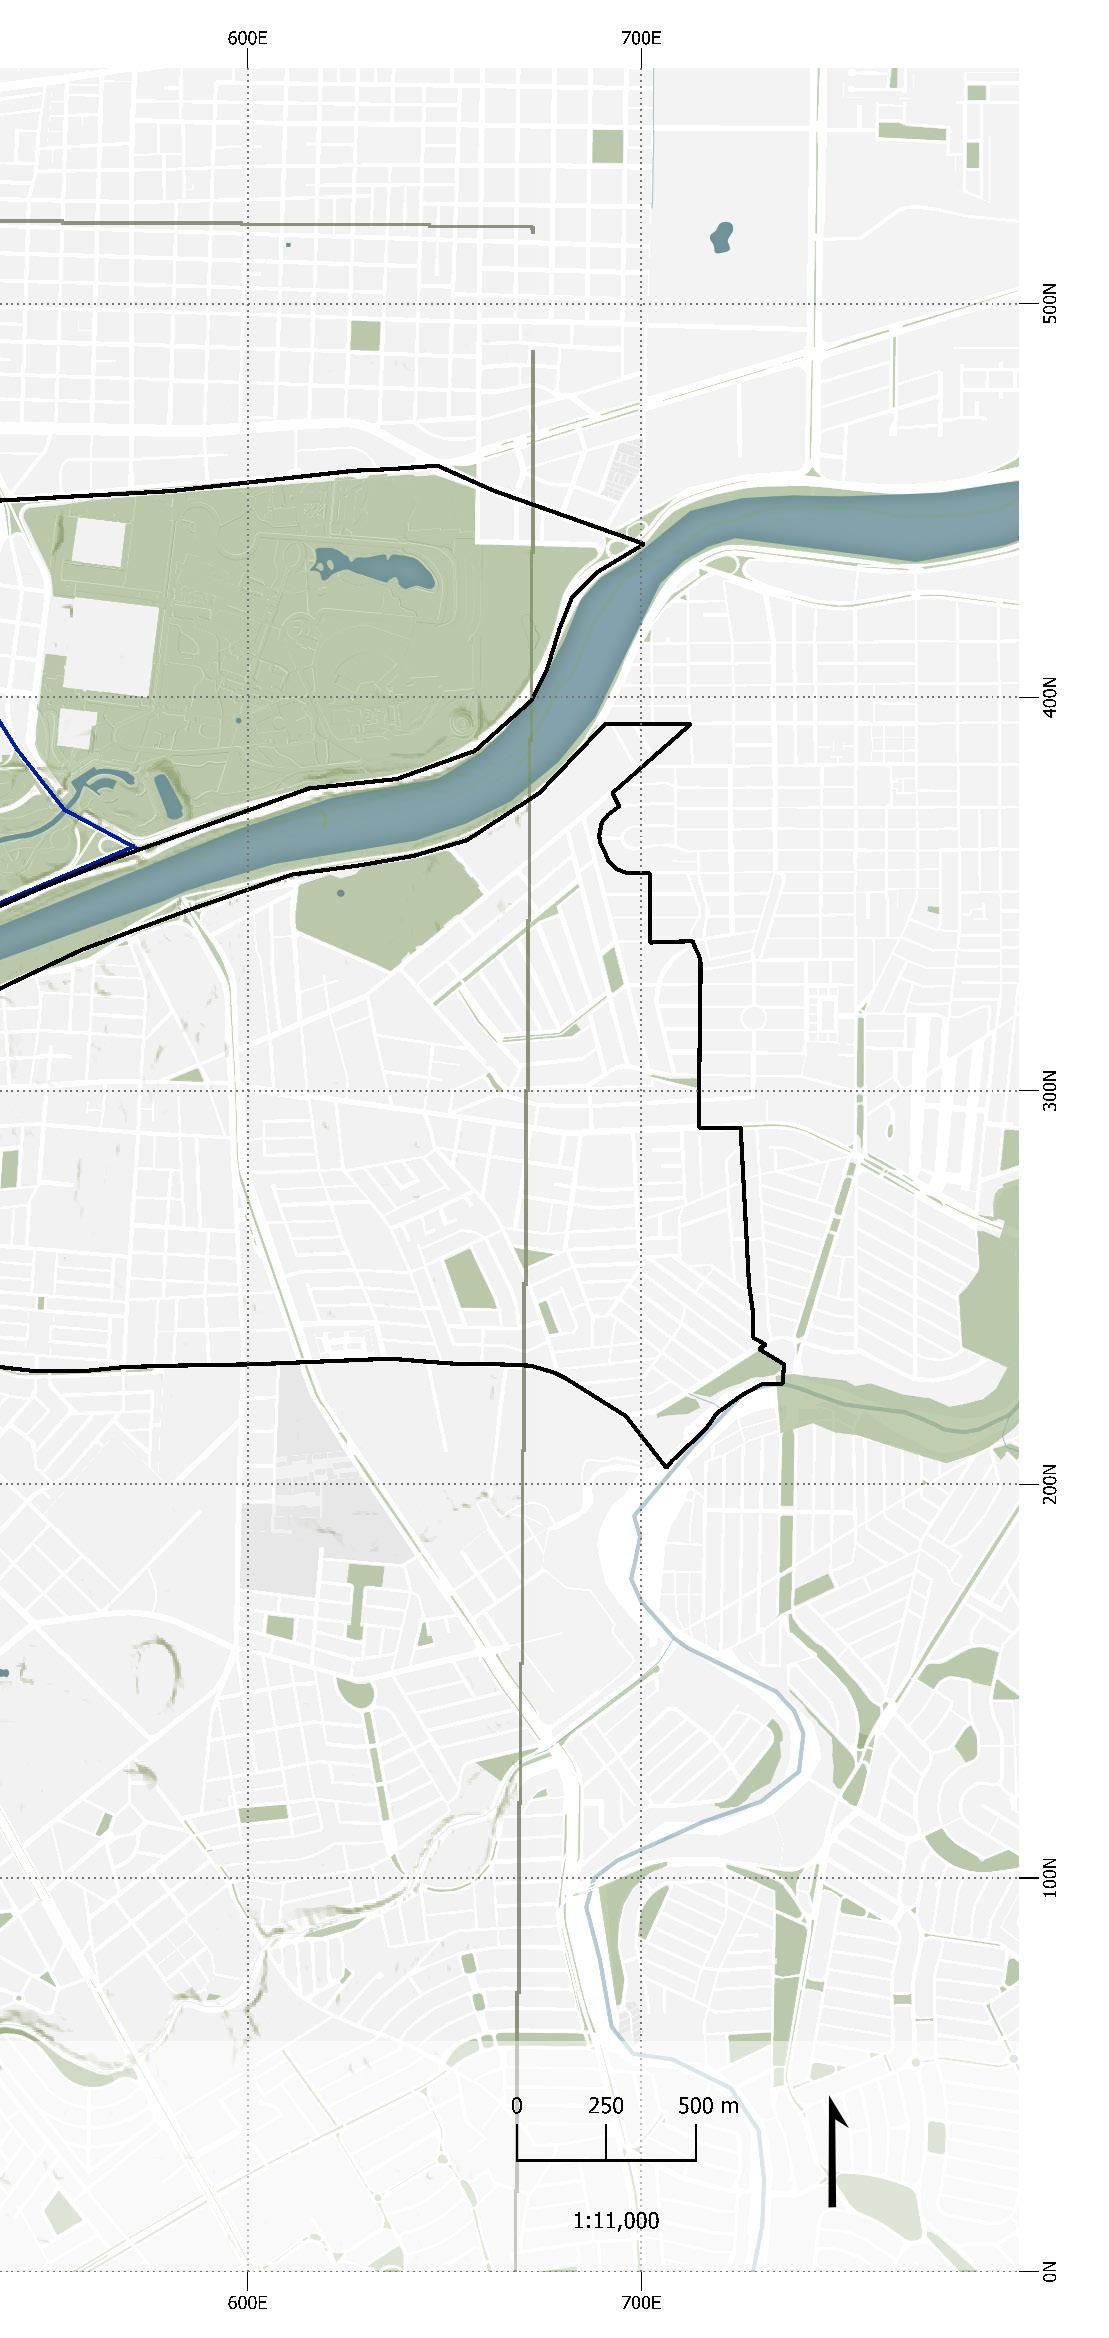
Stormwater drainage
74
“...problems with the functionality of the stormwater drainage due mainly to the lack of coverage in areas with slopes that would benefit said functionality...”
According to the document Agua para Monterrey, “every user of the water network in Monterrey Metropolitan Area has connection to the sewerage network, which is configured to take the entirety of residual water recollected to the treatment plants in the metropolitan area”. (ITESM, 2021)
As acknowledged by the Plan de Desarrollo Urbano del Municipio de Monterrey 2013-2025, elaborated by IMPLAN MTY, there are problems with the functionality of the stormwater drainage due mainly to the lack of coverage in areas with slopes that would benefit said functionality and lack of slopes in other areas where the coverage is slightly higher.
75
Elaborated by Fernando Rodríguez with information from IMPLAN MTY (2013)
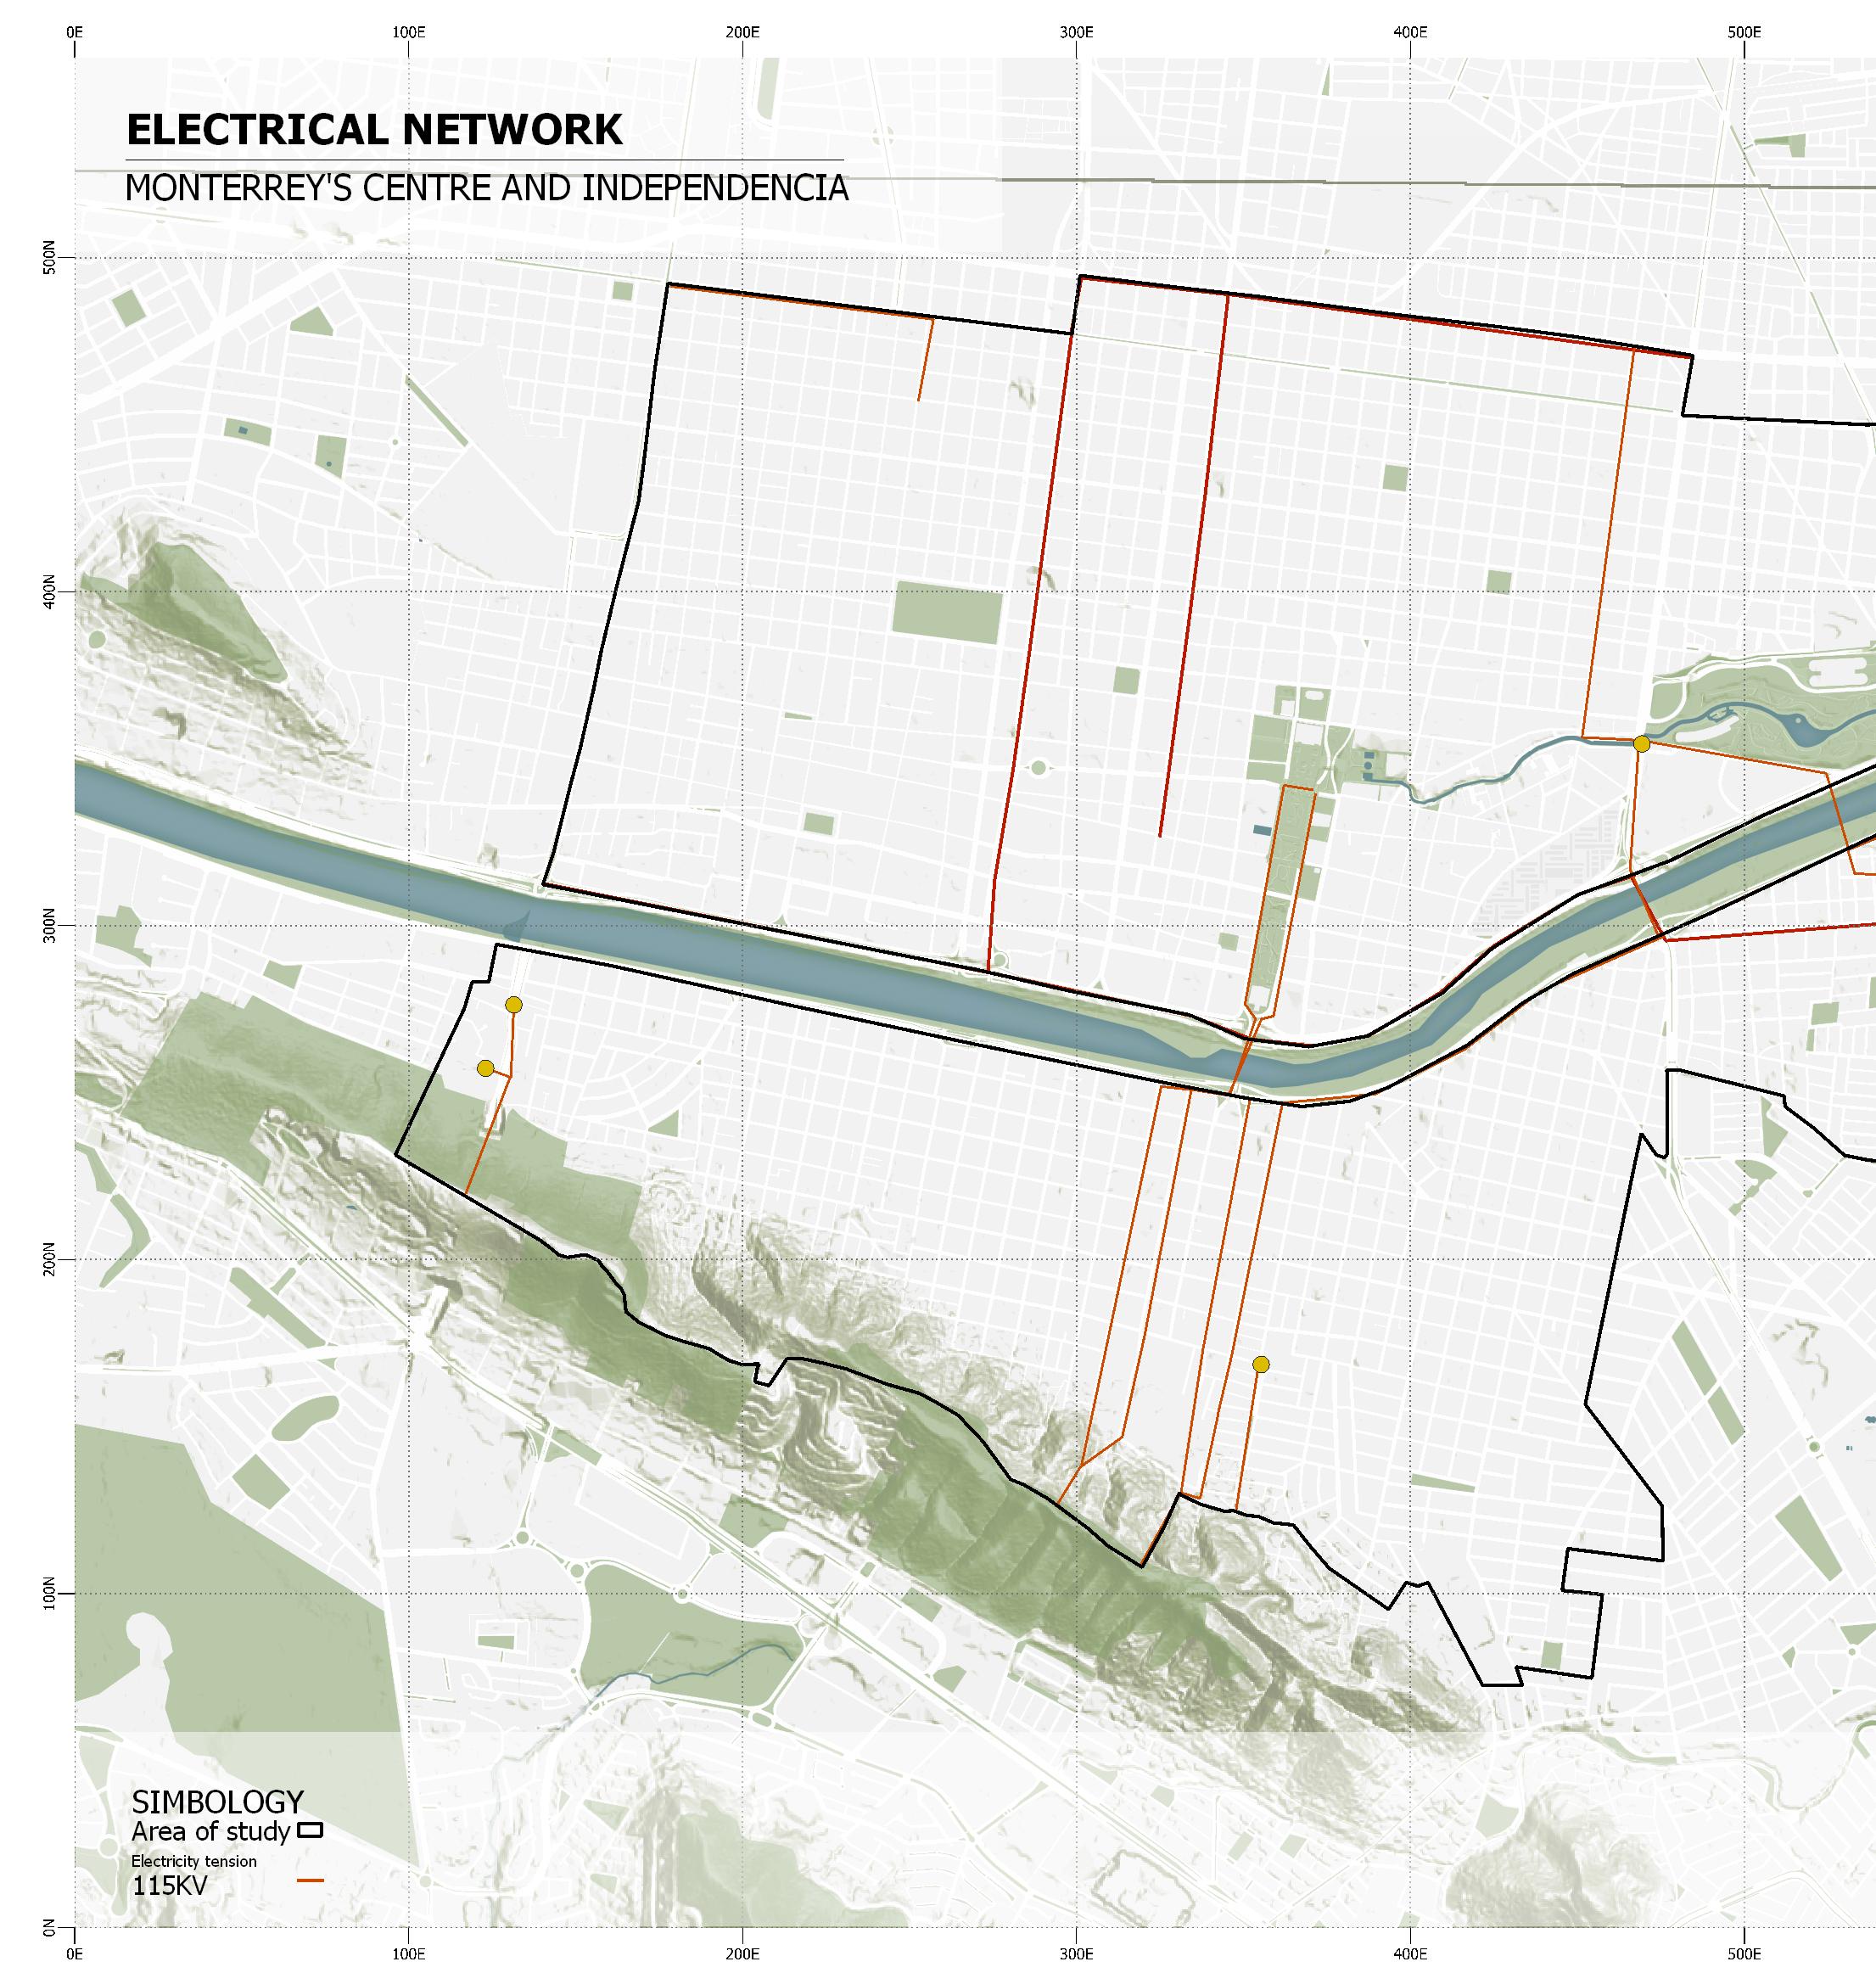
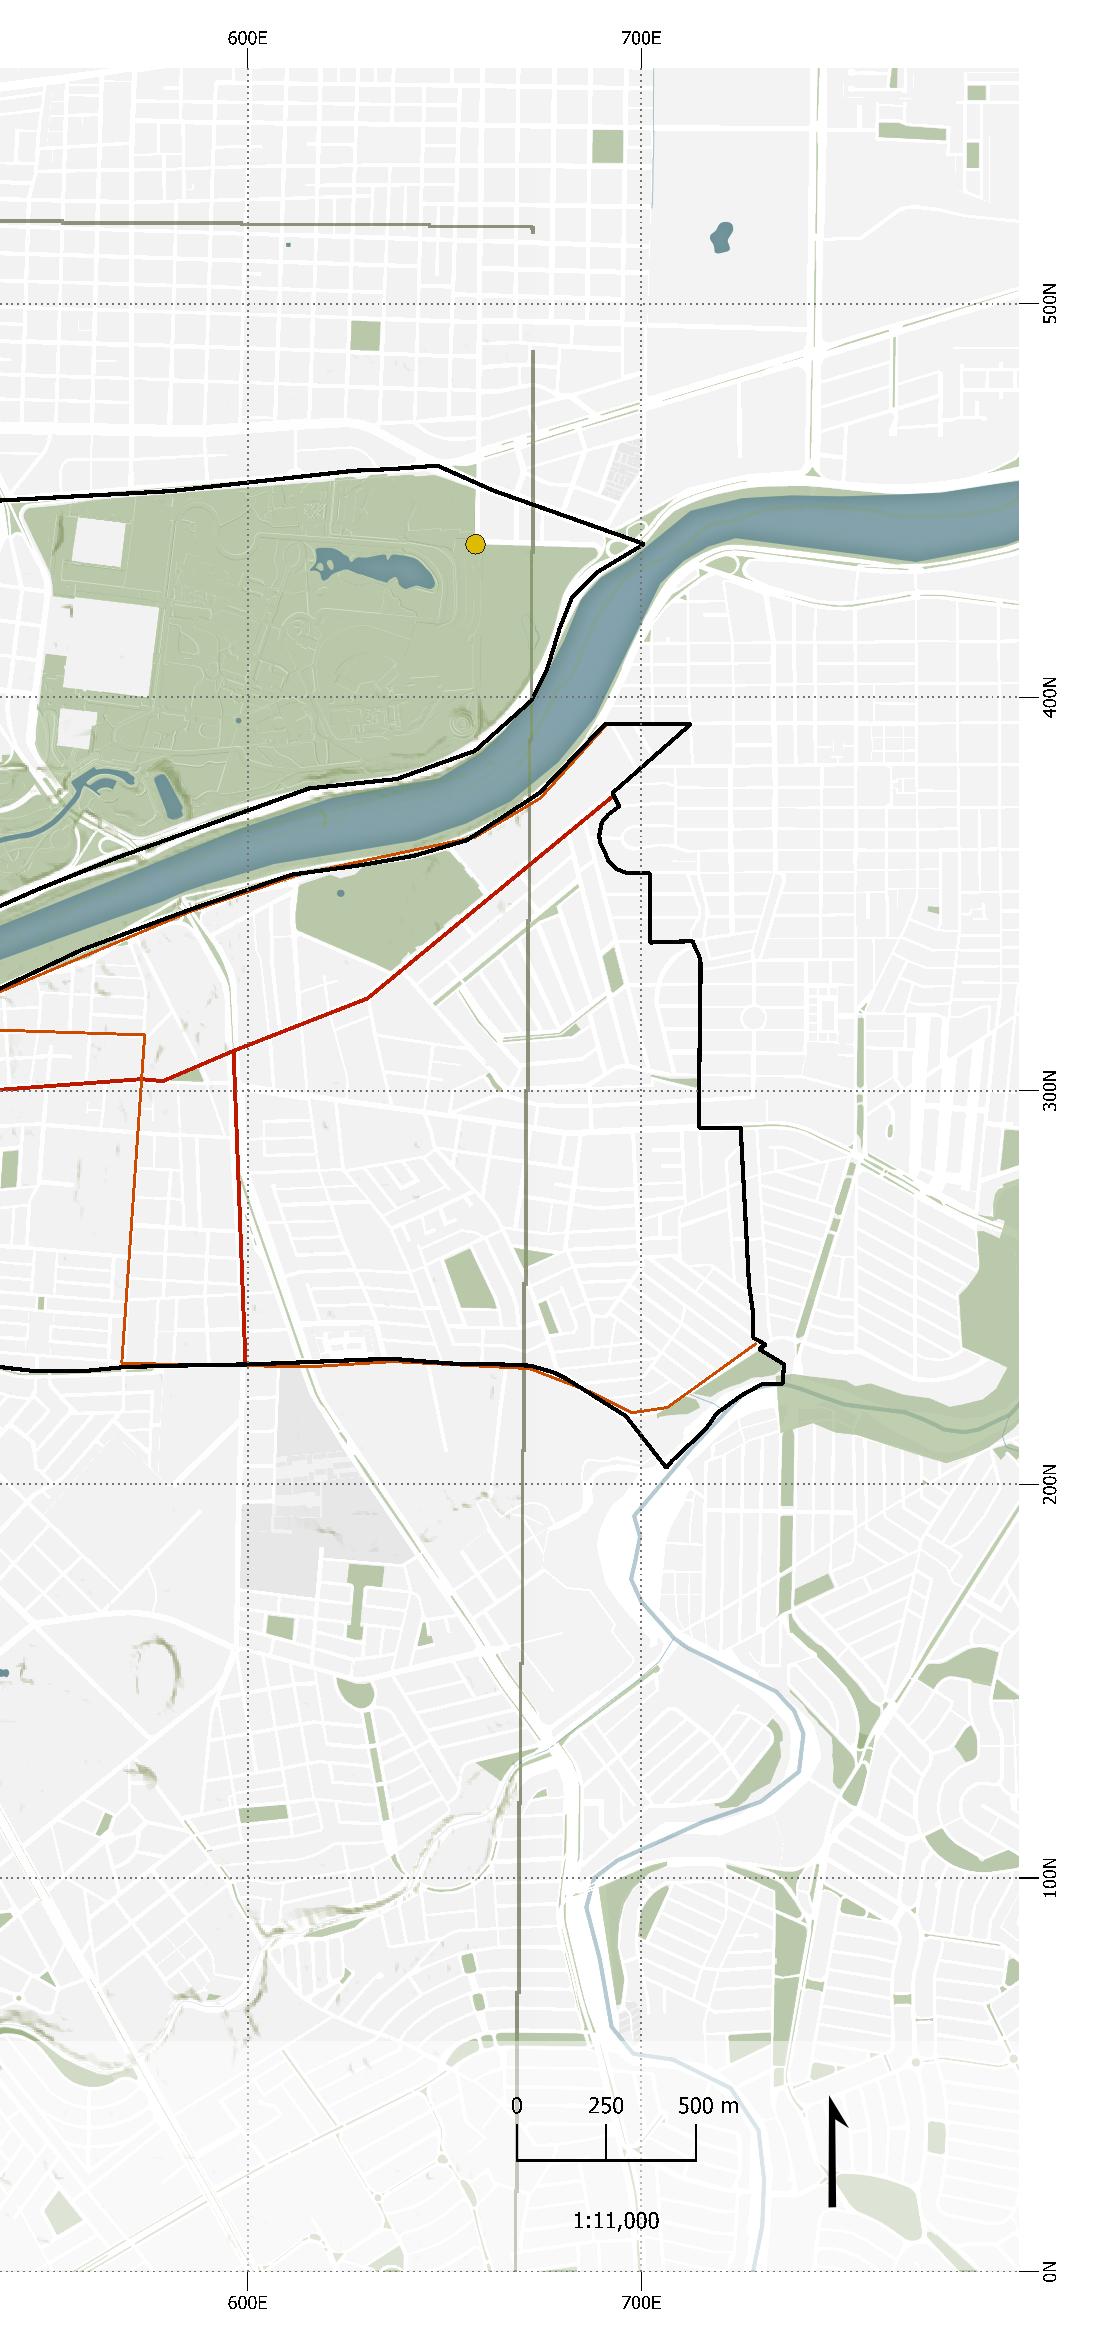
Electrical network
76
Elaborated by: Fernando Rodríguez Omaña
Source: IMPLAN MTY (2013)
According to INEGI statistics, within the polygon there is 99.7% coverage of this service in the area.
A recurring problem that represents a risk for the inhabitants of Colonia Independencia is the state of the physical electric infrastructure on the streets: recently, in the month of august 2022, neighbors have reported a CFE electrical post in poor state with risk of falling. (Telediario, 2022)
77
78
Leadership and strategy
79
Leadership and strategy
CITIZEN PARTICIPATION & AWARENESS
The Neighborhood Associations of City Center Monterrey serve to defend the common interests of the residents by helping and participating in the management. They also promote solutions to neighborhood problems and satisfactory answers to social demands.

Citizen Participation and Awareness Legal and Justice Governance
The foundation of Leadership and Strategy in the City Center of Monterrey is the belief that strong leadership is essential for a city to proactively adapt to major changes and provide
The following associations have a great sense of commitment toward their neighborhoodThey also are actively involved in activities to improve the quality of life in City Center: Association of Neighbors of Barrio Antiguo Monterrey A.C., Neighbors of Barrio de la Luz “Barrio de La Luz Live Culture”.
The following publication was prepared in the framework of a Collaboration Agreement signed in December 2017 between the State Institute of Women of Nuevo León and UN Women Mexico for the implementation of the
Global Program Safe Cities and Public Spaces for Women and Girls in five municipalities of the Metropolitan Area of Monterrey includes a Diagnosis on sexual harassment and other forms of sexual violence against women and girls in public transport in the Metropolitan Area of Monterrey (MAM), as well as a proposal for a Metropolitan Program for Safe Public Transport for Women and Girls in the MMA. Both documents are a fundamental tool to know the situation of public transportation users in the MAM concerning sexual violence, as well as to identify areas of opportunity to prevent, eliminate, address and punish this type of violence and generate a roadmap to guarantee the right of women and girls to a life free of violence in public transportation. The findings of the diagnosis are taken as the basis for the development of a proposed program based on
80
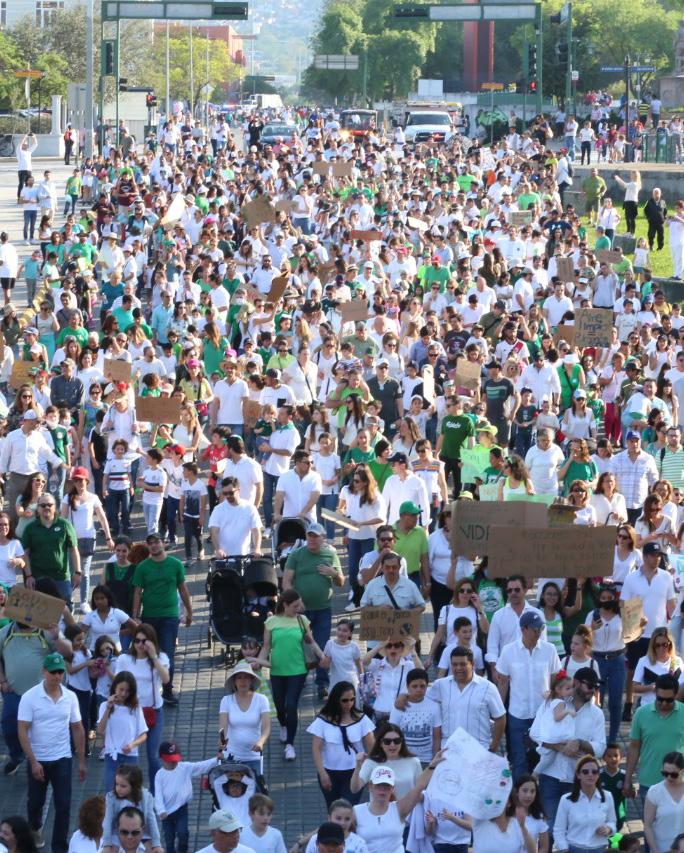
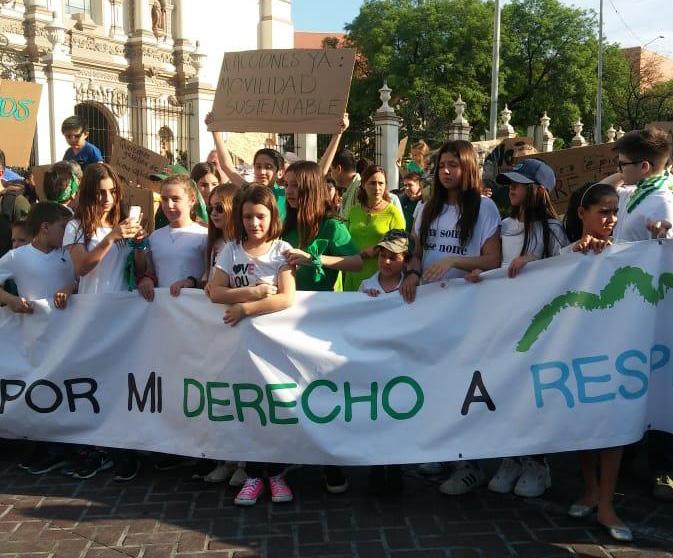
Neighbors of La Independencia Neighborhood manifesting in City Center. (ABC NEWS 2021)
Citizn Participation in a march located in City Center of Monterrey. (MILENIO NEWS, 2020)
a participatory approach in which users, civil society organizations (CSOs), specialists, and public servants contributed their experiences and concerns to shape a vision of the future in which women and girls in the MAM can travel safely, freely and comfortably on public transport. It spreads awareness about sexual harrasment and violence: DIAGNOSIS AND PROGRAM DOCUMENT: SEXUAL HARASSMENT AND OTHER FORMS OF SEXUAL VIOLENCE IN PUBLIC TRANSPORTATION:
MONTERREY METROPOLITAN AREA LEGAL AND JUSTICE
This dimension is taken into the part as the key leader that has the power to implement the urban norms that structure and influence the center of Monterrey.
GOVERNANCE
This categorization has been defined to
refer to the key actor who structures and processes that are designed to ensure accountability, transparency, responsiveness, rule of law, stability, equity and inclusiveness, empowerment, and broad-based participation.
MTY’S MUNICIPAL INSTITUTE OF MOBILITY AND URBAN MANAGEMENT
IMPLANc deals with issues related to urban development in Monterrey. It is a Decentralized Public Organization, with a legal personality and assets, whose main purpose is to be the technical instance for the integral planning of municipal development, urban sustainability, risk prevention, and environmental care.
SEDUSU Department of Urban Development and Ecology
To prepare and propose to the City Council general provisions on urban development, human settlements, and land use planning. Monterrey Office of Extreme Heat (Rockefeller)
The Office aims to promote research and analysis on climate change and extreme heat in the city so that we can understand the problem and adapt from all sectors.
81
Right: Etiam egestas, dui vel facilisis consequat, massa nibh ultrices nisl, sed sollicitudin diam odio non ante
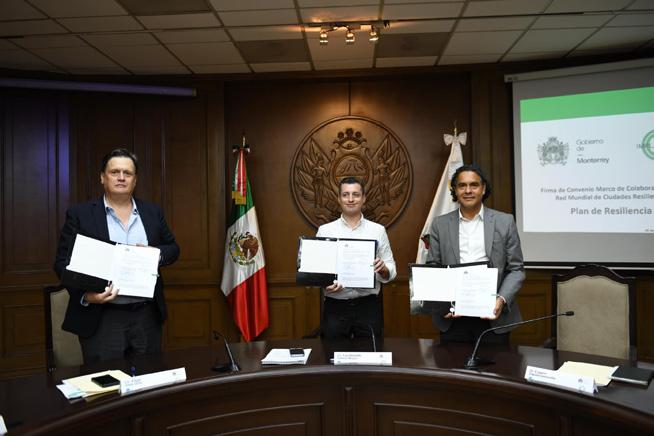
Luis Donaldo Colosia (Mayor of Monterrey 2022) and General Director Edgar Olaiz (IMPLANc).
Citizn Participation in a march located in City Center of Monterrey. (MILENIO NEWS, 2019)
ACTORS
This section lists the actors that influence (perform some activity) within the zone in three categories: leading actors, extreme actors, and archetype actors.
The purpose of the leading actors is to understand how these different actors interact with their space, the needs they have, and the patterns and problems they present. The types of actors that are identified in the center of Monterrey are defined below:
Leading Actors: Are those users who are interested and intuitive to develop projects that generate changes in the quality of life of other users.
Extreme Actors: Users with much greater or much lesser needs, who demand specific things in the area.
Archetypical Actors: Those actor profiles that are present in a circumstance with specific behaviors within the zone.
Leading Actors:
Luis Donaldo Colosio - Mayor of Monterrey
• Mtra. Laura Iraís Ballesteros Mancilla - Secretary of Urban Planning and Development
• Director IMPLAN Monterrey Edgar Olaiz
• Fundidora Park Board of Trustees
• MARCO Museum Board
• Representatives of Neighborhood Associations
Centro Inmobiliario IDEI (NOVUS development)
Extreme Actors: Parents
• Children
• Seniors
• Adults
• Youth
People with disabilities
• Neighbors of Barrio Antiguo and La Luz neighborhoods
Floating population of the area
• Emergency services
• Students in the area Schools
• Pedestrians Bicyclists
• Motorists
Archetypical Actors: Commercial Workers
• Service Workers (electricians, plumbers, etc.)
Medical Personnel
• Office Workers
• Merchants
• Food and grocery delivery workers
• Transporters
Emergency Services
• Vendor truck drivers
• Inhabitants of apartments in the area Inhabitants of houses in the area
• Non-inhabitants of the area
• Public transport users
• Users of private transportation services
• Motorists
Pedestrians for transportation
• Cyclists for transportation
• Tourists
Market customers
Picture of Barrio Antiguo (UNIVISION, 2017).
82
83
84
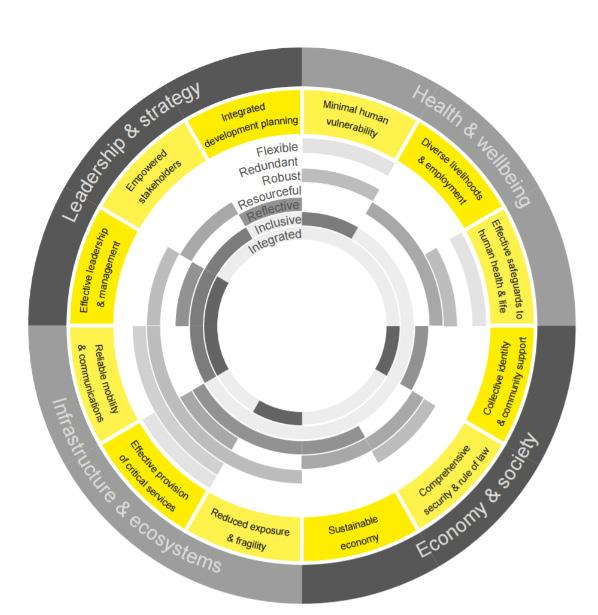
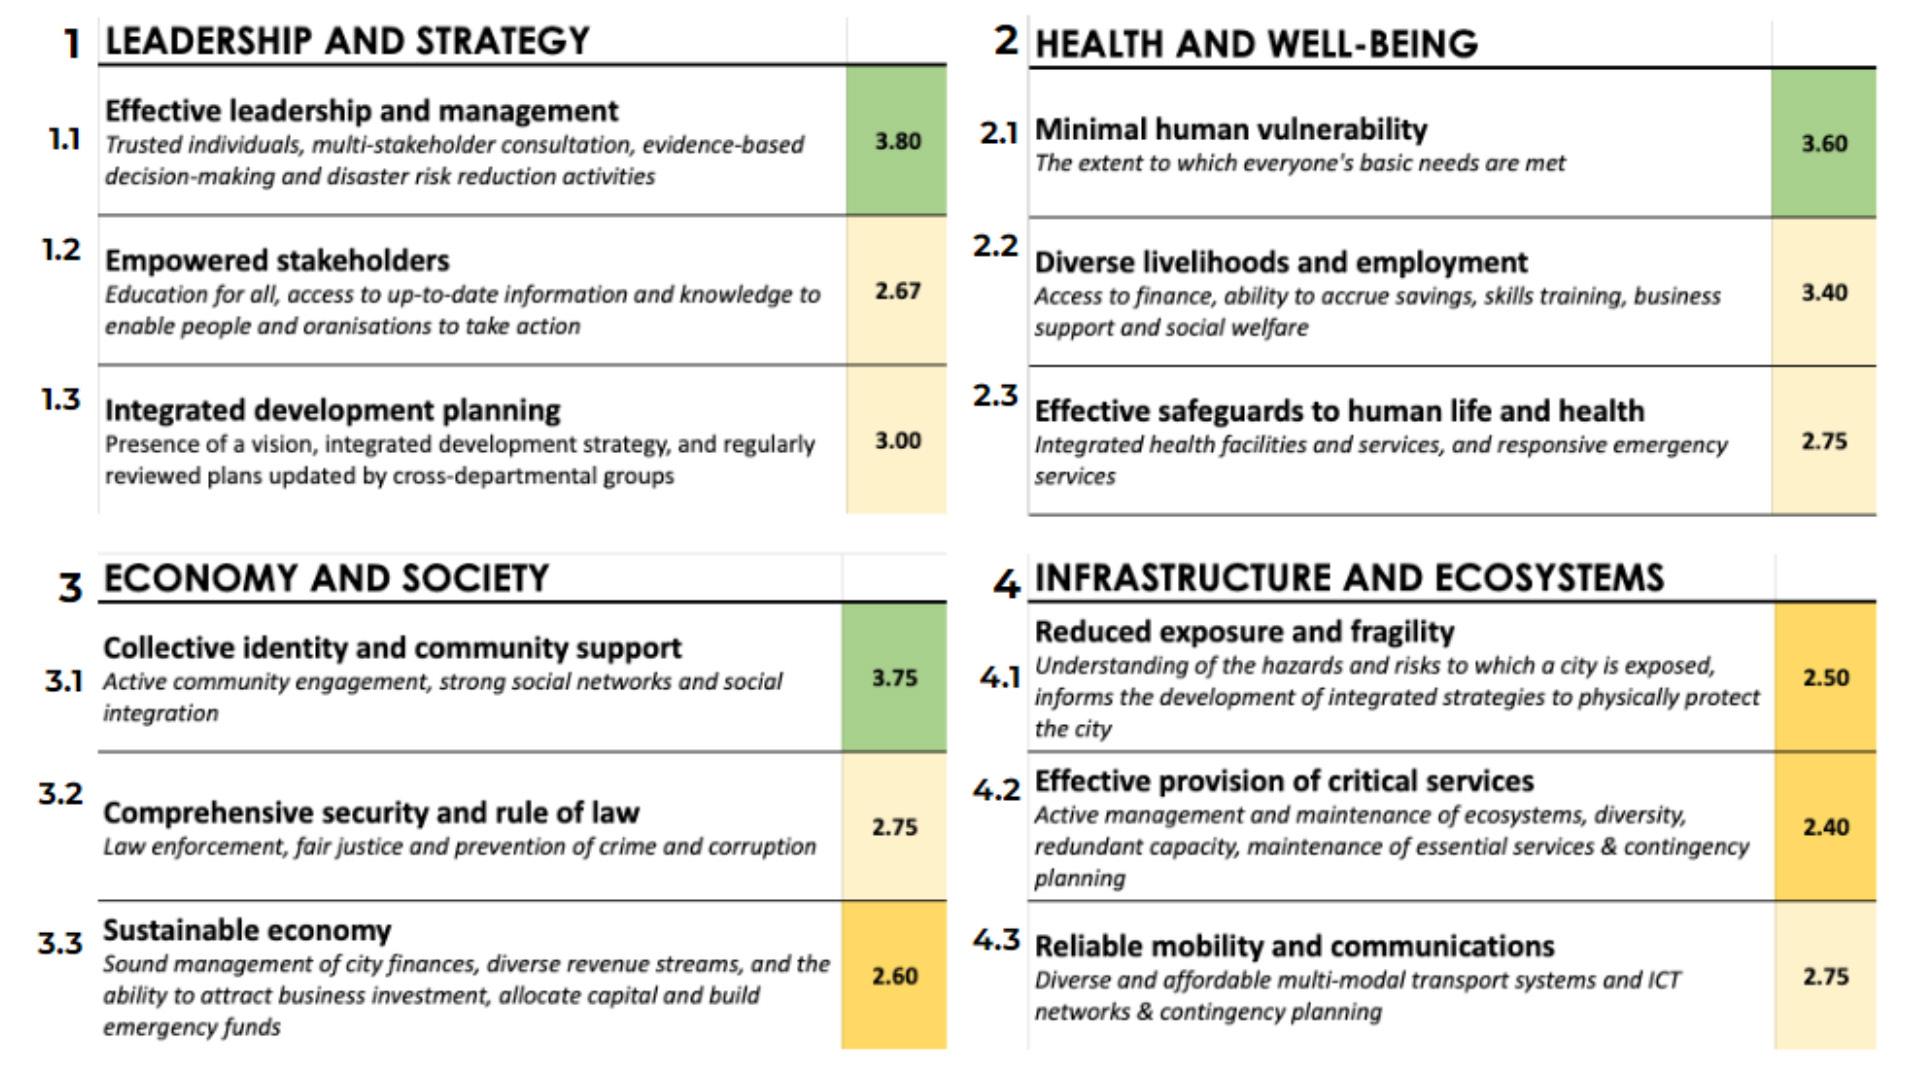
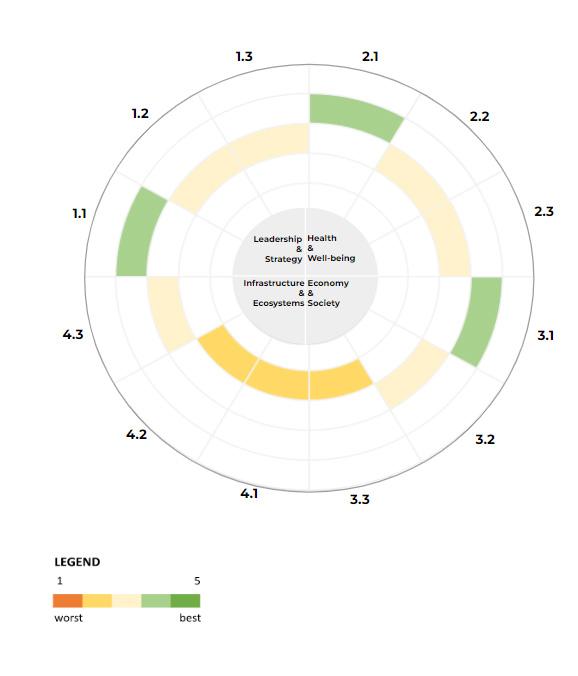
City Resilience Index by ARUP.
A Rapid Resilience Review was conducted for the two zones of the study area: the north of the Santa Catarina river and the south of the Santa Catarina River, using the format created for the City Resilience Index.
According to the City Resilience Index, the tool is designed for carrying out a quick resilience assessment of the urban systems in any city, by rating its performance on the 12 goals of resilience.
The methodology for this tool is answering qualitative questions, which will lead to an analytical output of the resilience rate of the city.
The purpose of using this tool is to show and compare how these two zones of our study zone are actually based on their urban resilience and think about how they can reach an overall resilience.
The urban systems that were analyzed and rated in this resilience tool were the following:
rAPID rESILIENCE rEVIEW
Budget
• Business and Economy
• Business, Finance & Economy Citizen participation and Awareness
• City data
• Crime and Policing Culture
• Disaster Management
• Drainage and Sanitation
• Education
• Employment Energy
• Environment
• Food Governance
• Health
• Housing
• Information and Communication Technology Legal and Justice
• Protective Infrastructure
• Support and Welfare
Transport
• Urban Planning
• Utilities Water supply
85
“the tool is designed for carrying out a quick resilience assessment of the urban systems in any city, by rating its performance on the 12 goals of resilience. “
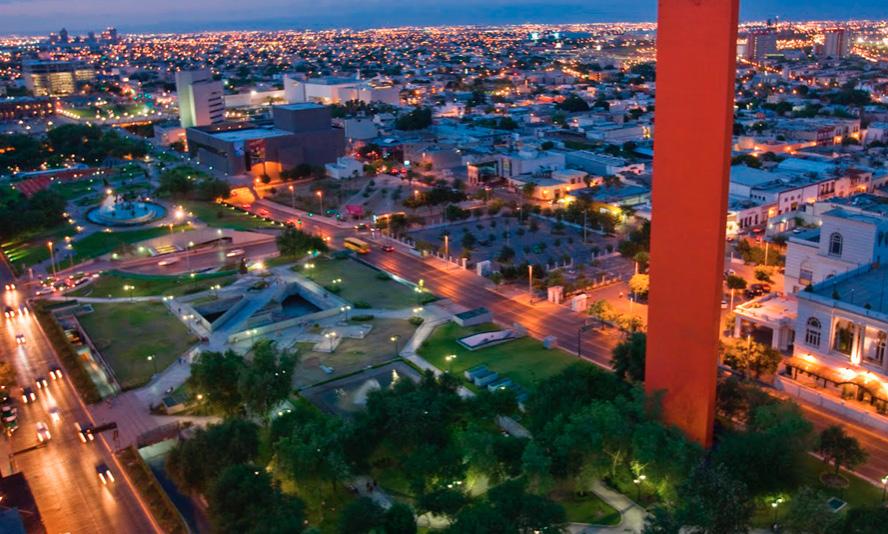
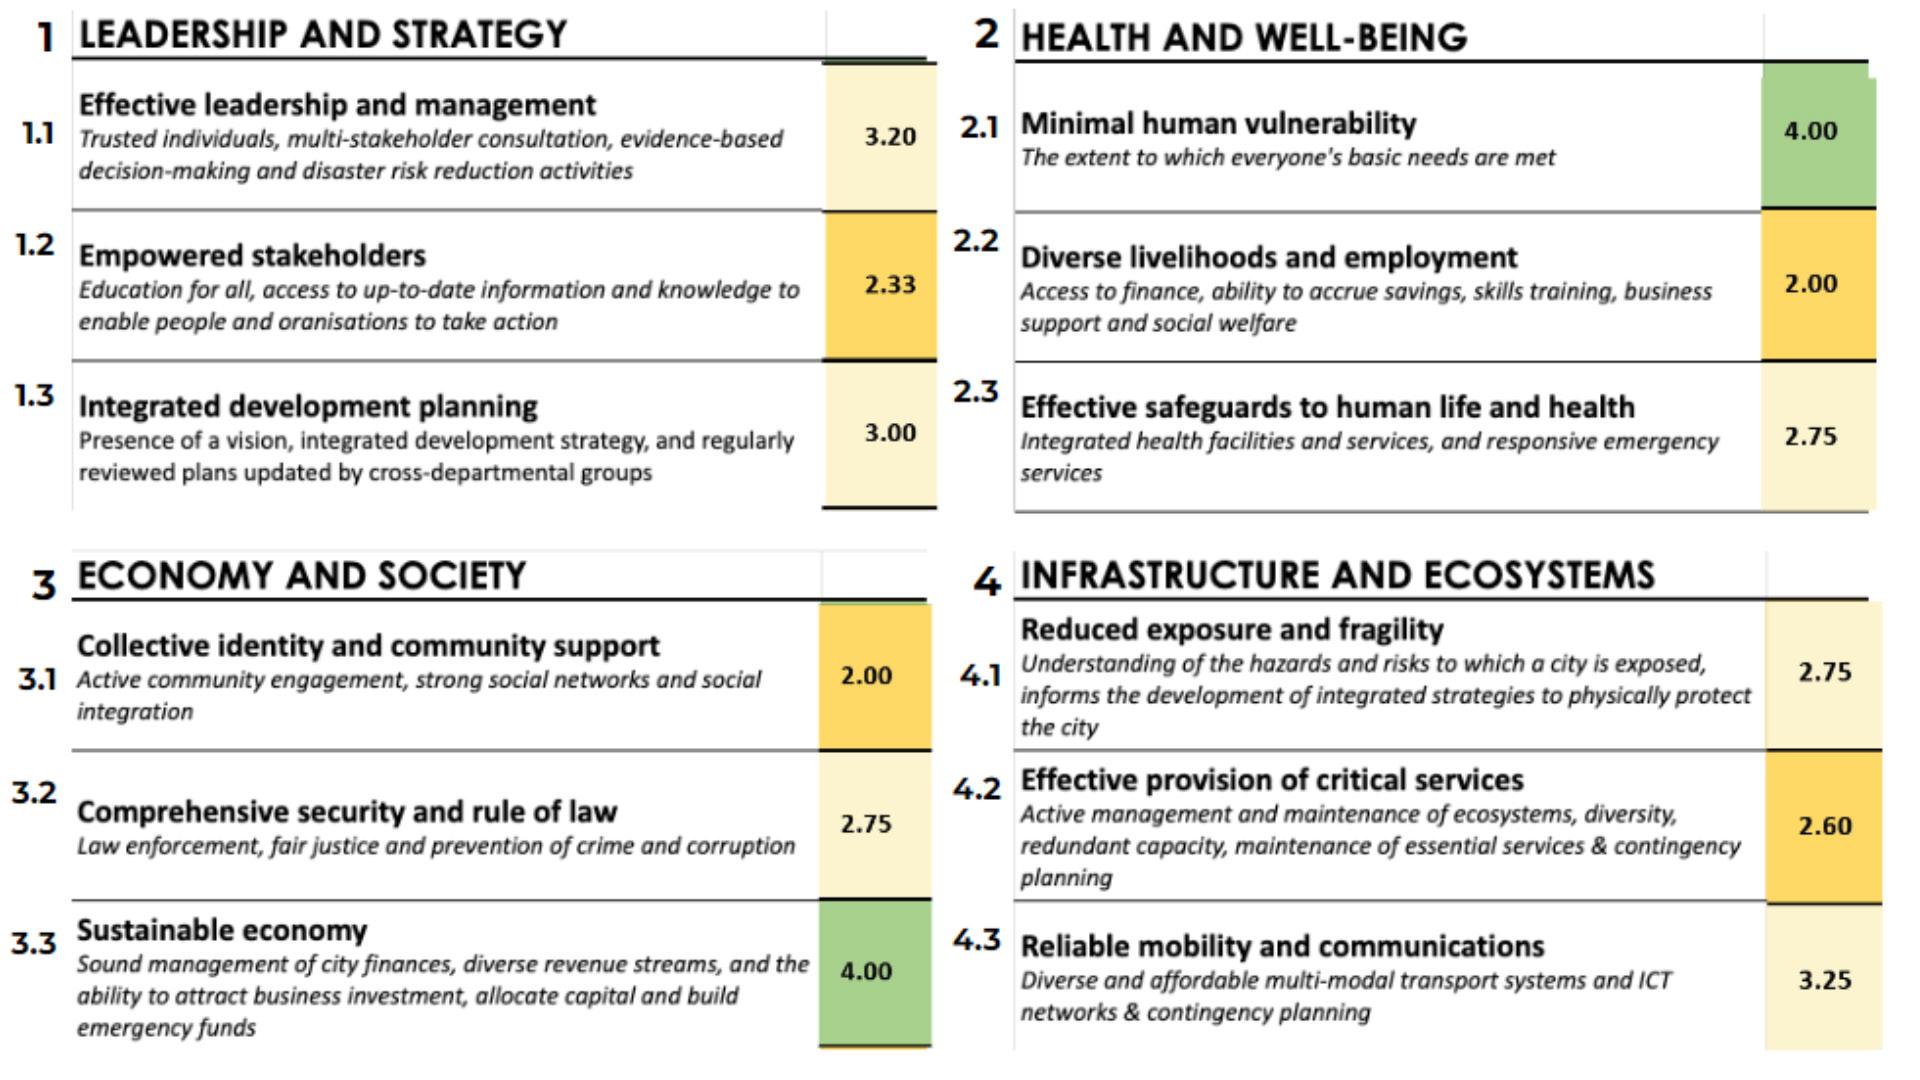
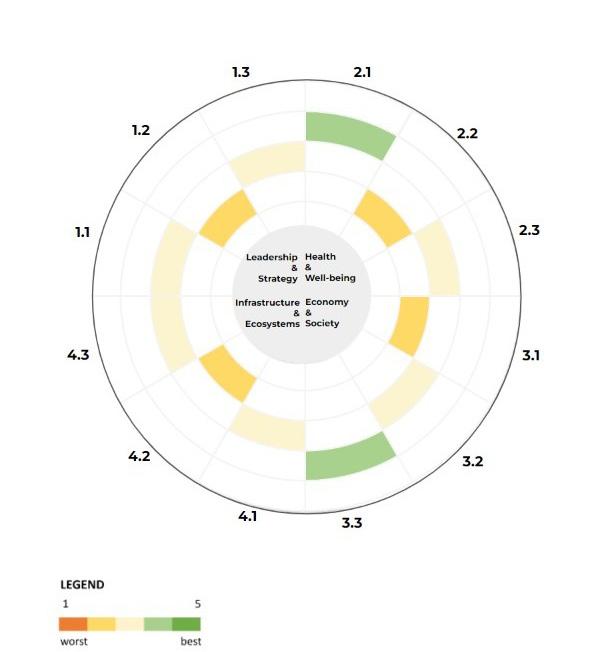
NORTH OF THE RIVER
The city center stands out for having a variety of activities, mainly commercial. Some of the most attractive tourist destinations are here, such as Río Santa Lucía, the pedestrian street Morelos, Barrio Antiguo, and many other cultural value places. Due to this, the dimensions that stand out are those that influence the concept of commerce and leadership because of the advantage and value both these represent for the zone. This can be related to the weakness in empowered stakeholders, which is derived from the power high-ranked government officials have over decision-making because of the overly demanded zone that the center is, not
considering the actual inhabitants. Comparing this to citizens’ safety and planning there is a difference shown graphically on the index. These two factors could be correlated due to the effects that deficient risk management has on the danger to citizens. Both of these are influenced by the unsuitable infrastructure found in the zone. Contrary to this there’s overall coverage of services which means that citizens’ basic needs are covered.
86
“...the dimensions that stand out are those that influence the concept of commerce and leadership...”
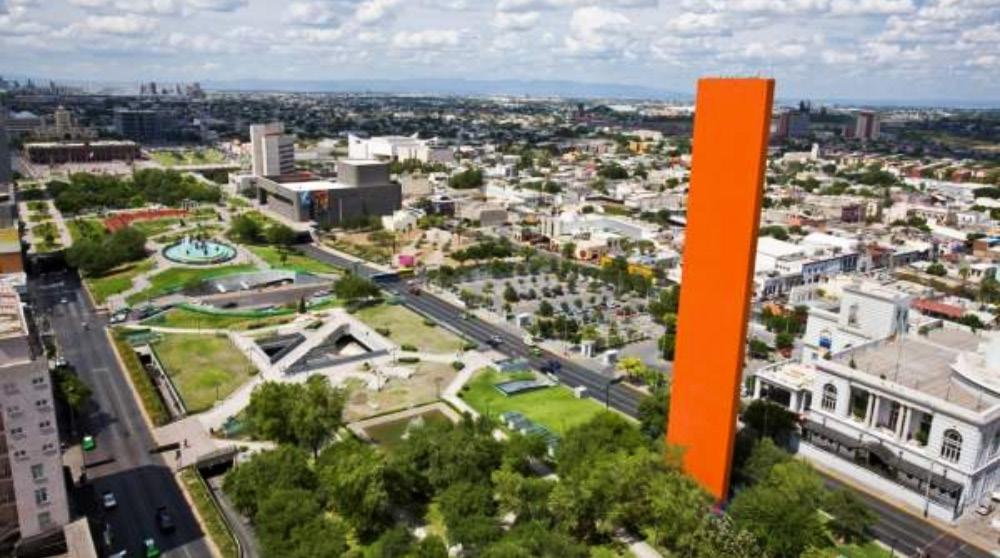
MacroPlaza Monterrey City Center located at the north of the River Santa Catarina. (NOMADA NEWS, 2022)
87
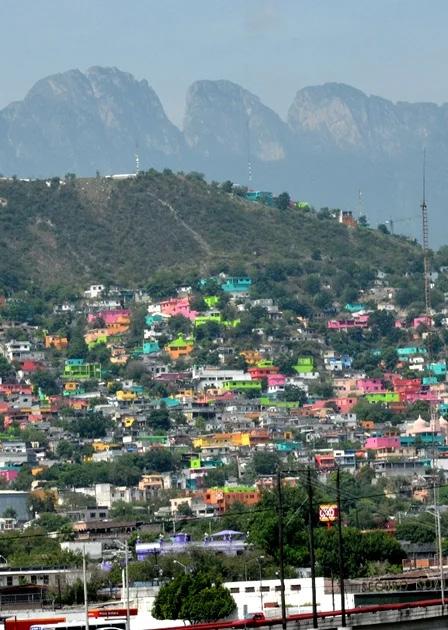
SouTH OF THE RIVER
Based on the general overview generated by the review, one of the main takeaways is the contrast that exists between the capacity to identify hazards and risks to which the zone is exposed and the incapacity to respond and/or adapt to said hazards and risks, particularly referring to floods. Another valuable observation obtained is the high level of vulnerability of the provision of critical services in situations of crisis, which is linked to aspects such as the topography of the zone and its irregular nature. Finally, it’s
important to identify as an asset the social aspects of the zone, as the categories related to identity, community, and leadership ranked among the highest, considering mainly the different groups formed by neighbors which represent an important role in the actor system of the zone.
88
“...the high level of vulnerability of the provision of critical services in situations of crisis...”
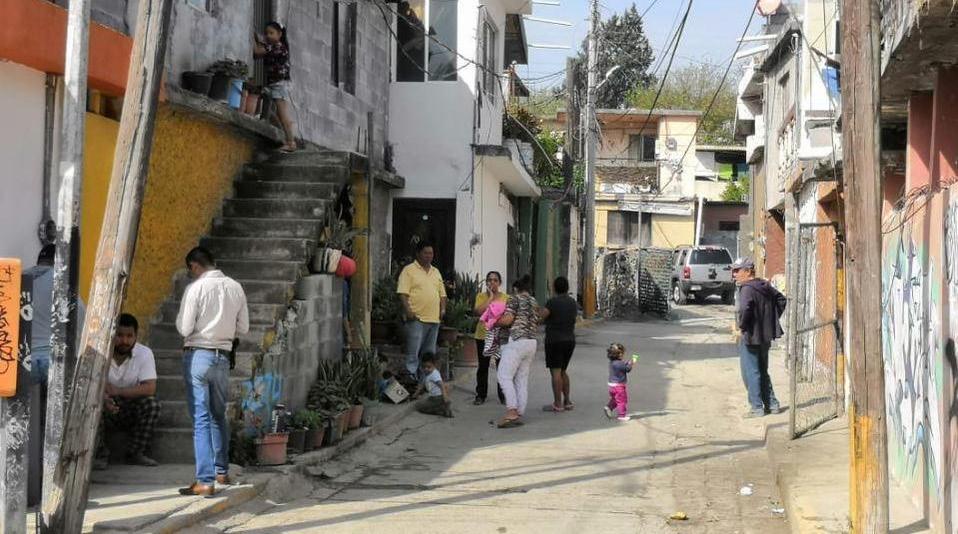
La Independencia Neigborhood at the South of the Santa Catarina River. (EL HORIZONTE, 2020)
89
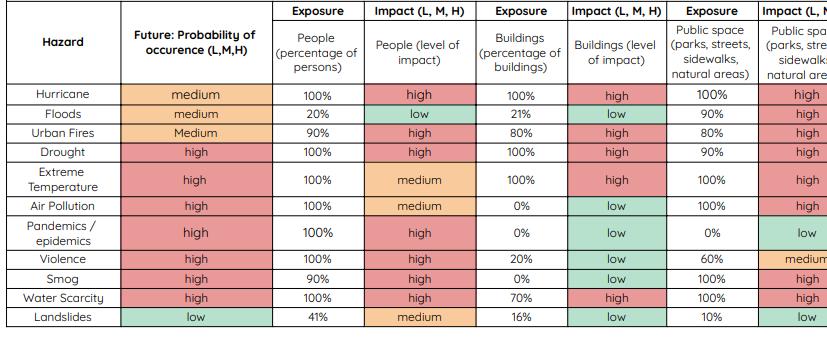
QUALITATIVE RISK ASSESMENT
The qualitative risk assessment table for North and South Santa Catarina River has identified some overarching risks that deem require management action. As it shows, the table has eleven hazards, which are: hurricanes, floods, urban fires, drought, extreme temperature, air pollution, pandemics/epidemics, violence, smog, water scarcity, and landslides; each of these exposes and impacts the context referring to people, buildings, public spaces (parks, streets, sidewalks, natural areas), and the economy. The exposure units represent the
percentage of people and the impact depends directly on the percentage of the exposition. There are three levels: 0 - 30 % is low, 31 % - 60 % is medium, and 61 - 100 % is high.
The exposure and impacts to hazards for people are mostly high because they are related to the dangers that are present in the area, which exposes them to certain limitations, such as mobility, their state of health, and the economic problems they face. For hurricanes, the exposure is 100 %, therefore the impact level is high, but it doesn’t affect directly because in the
90
study zone there are no hurricane hazard zones identified. Nevertheless, the consequences are derived from floods, landslides, and water runoffs.
The buildings in the study zone have the lowest probability of impact and exposure to hazards. In addition to this, public spaces are the ones with the highest probability of impact and exposure to hazards because of the lack of space and inadequate environmental conditions.
The economy has a variety of levels of impact, in which hurricanes, urban fires, drought,
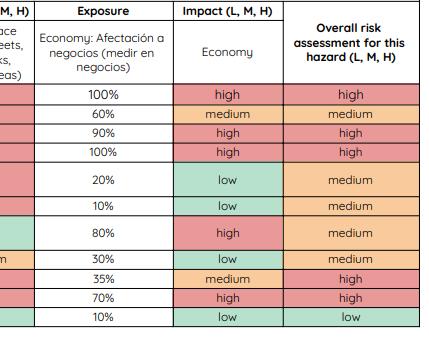
pandemics/epidemics, and water scarcity have high levels, these are shock events so the consequences are shown immediately; floods and smog have a medium level. Flood is categorized as a medium level because of the low percentage of territorial dimensions that present flooding; and extreme temperature, air pollution, violence, and landslides have a low level.
These hazards don’t provoke a high impact on people due to the lack of information on the severity of these long-term hazards. On average, the hazards’ probability of future occurrence goes from high to medium level, meaning that in terms of predictions, the North and South of Catarina river can have extreme situations in which their context would be affected. On the other hand, regarding the overall risk assessment for hazards, the majority goes from medium to high, and only landslides appear with a low probability.
91
cONCLUSIONS
City resilience refers to the ability of a city to withstand potential disaster through a planned and supported system that maintains or recovers functionality in extreme situations, so that the people living in it, regardless of their social and economic status, can handle the shocks and the stresses’ impacts. A resilient city can deliver basic functions in both good and bad times, to everyone. Currently, the majority of the world’s population is now living in cities and increasing constantly, so the scale of urban risk is increasing; therefore, for cities to have the capacity to function, their development strategies must be enhanced.
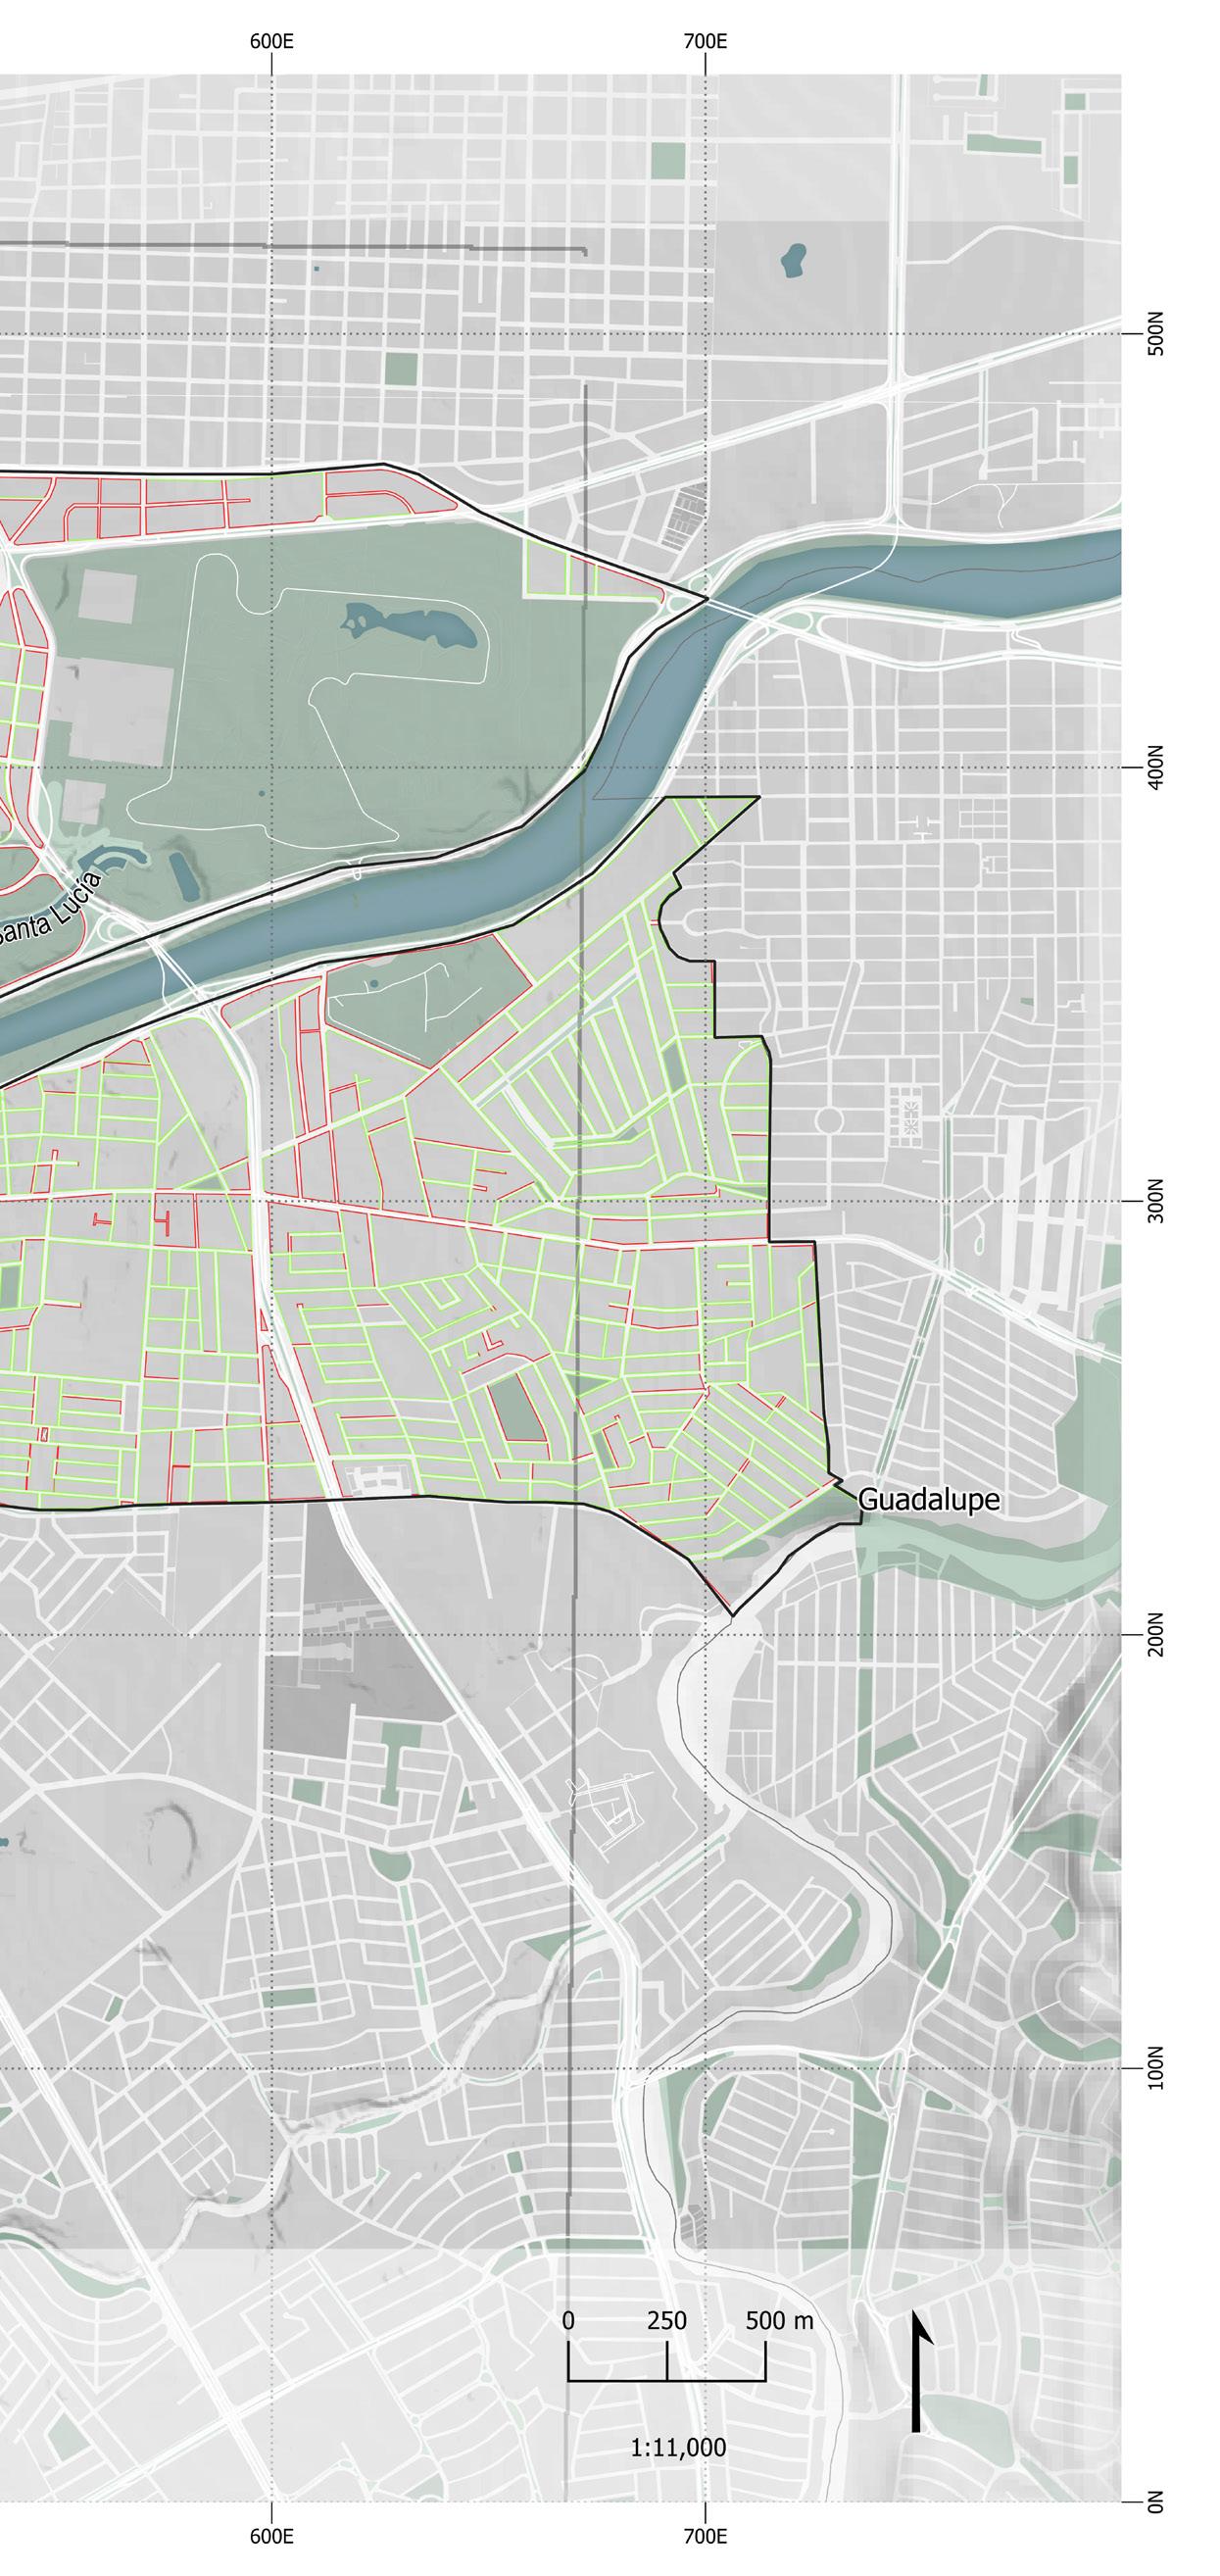
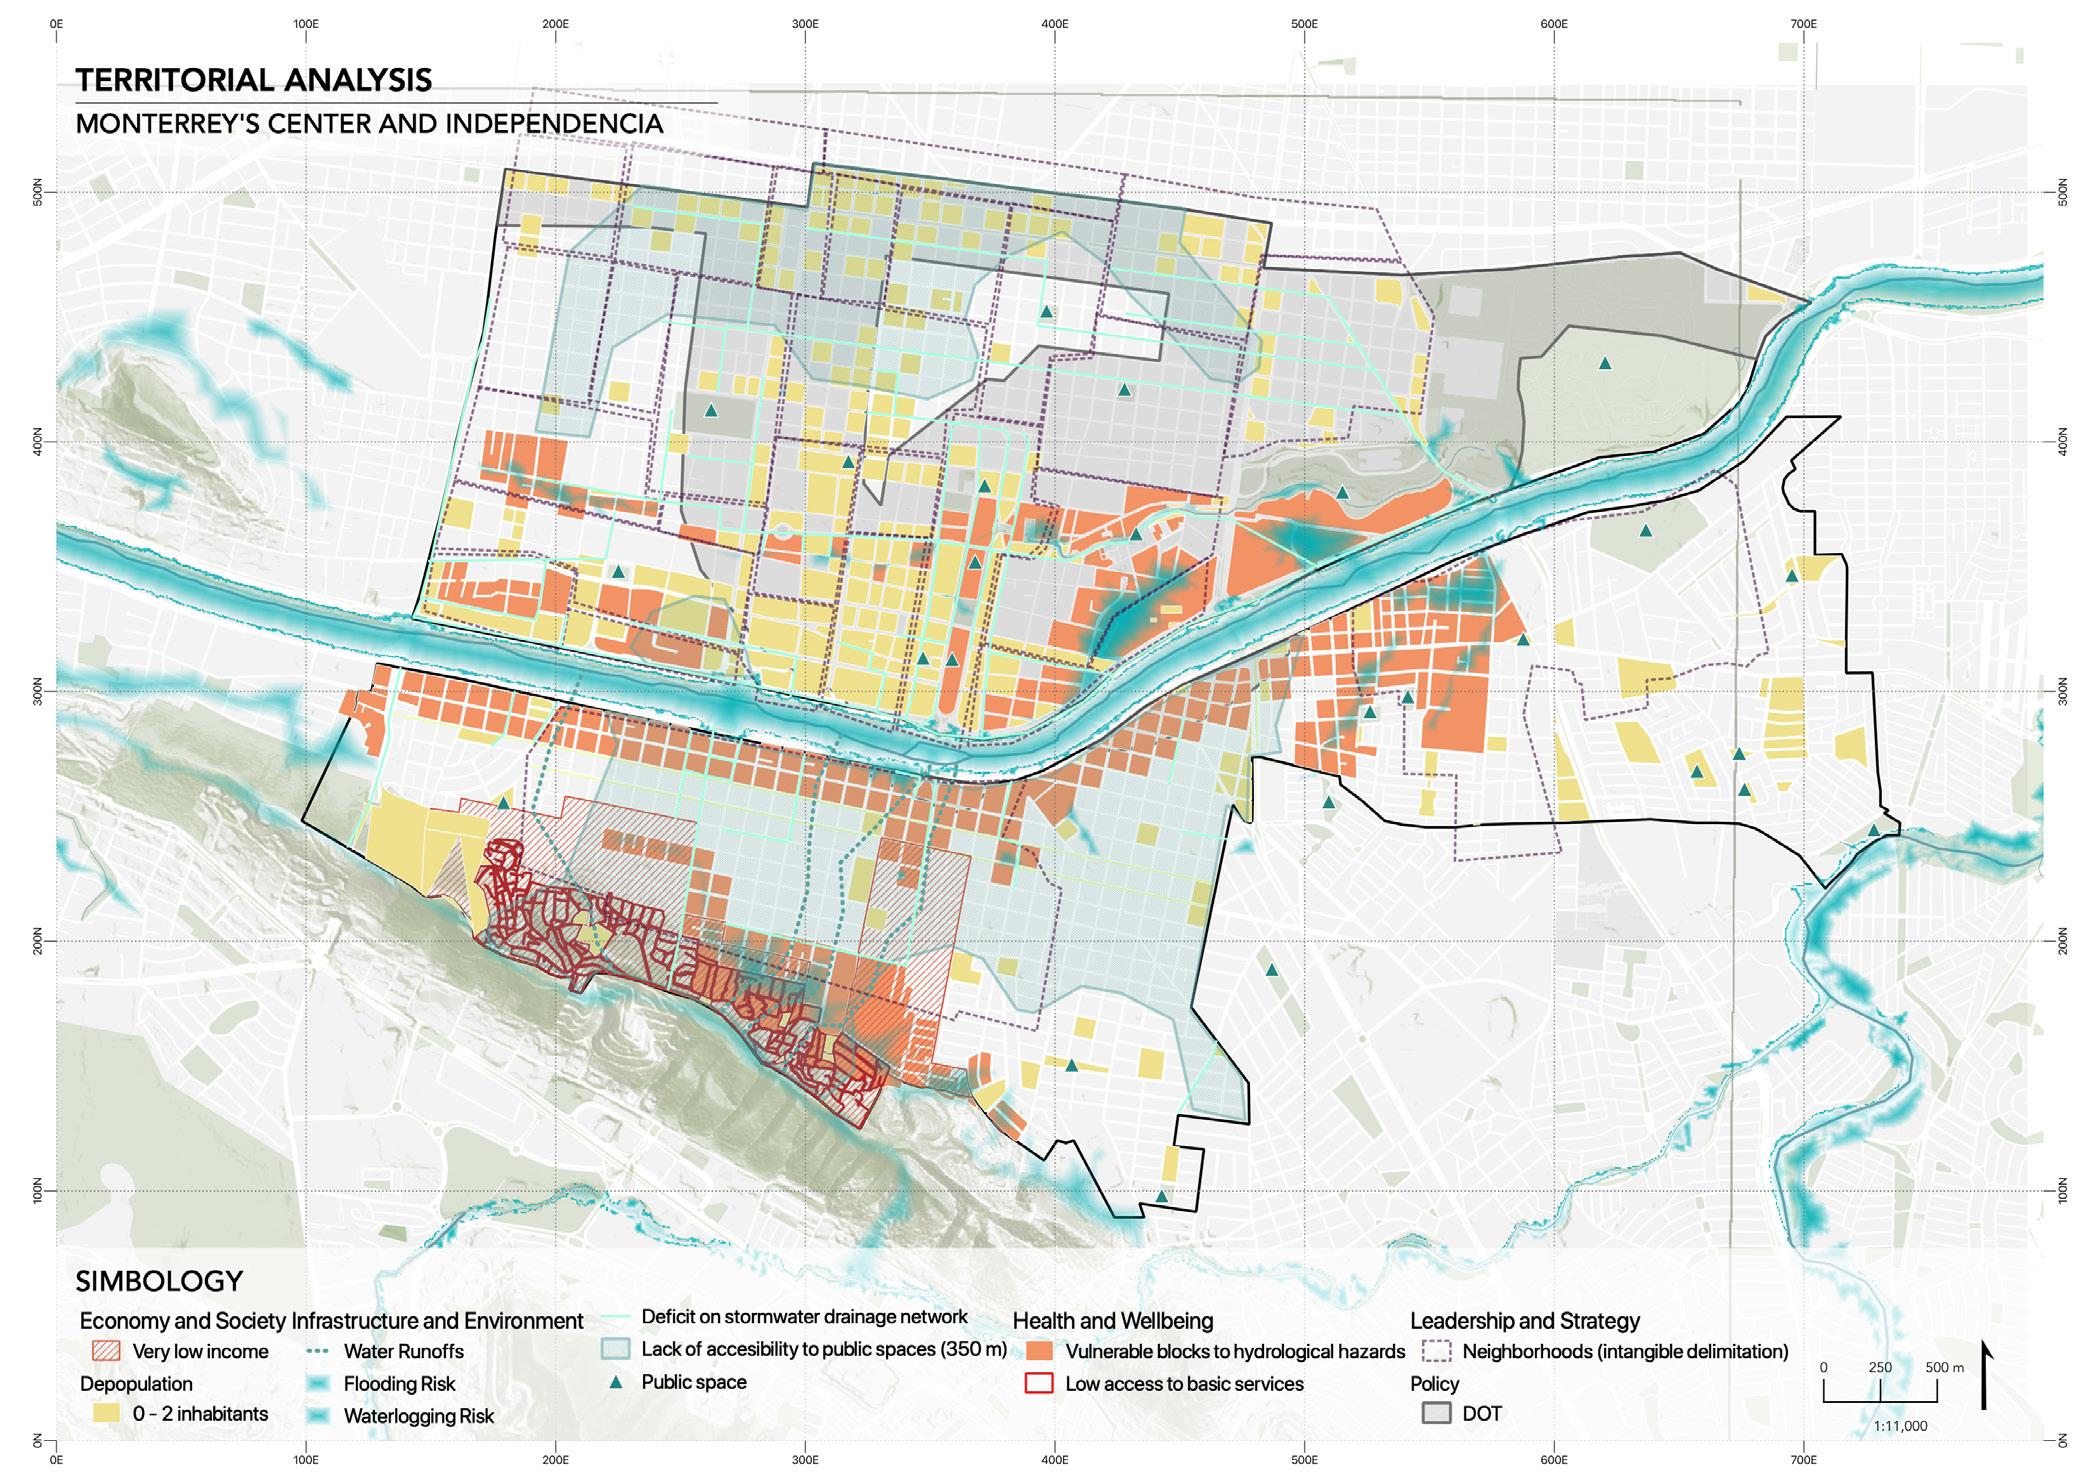
Monterrey’s city center represents an area of approximately 885 hectares with a wide historical context that includes the foundation of the municipality of Monterrey and its industrial development, starting North of the Santa Catarina River in 1769. Similarly, around 1894 a more structured development in the south and up the hill of the Loma Larga was seen.
Then, in the 20th century, two main events that
Territorial map of the study zone. Elaborated by Paulina Ramírez Leal.
still shape the dynamic of the area happened: the channeling of the Santa Catarina River in 1950 and the construction of Macroplaza in 1982, which meant the demolition of some of the oldest edifications in the city.
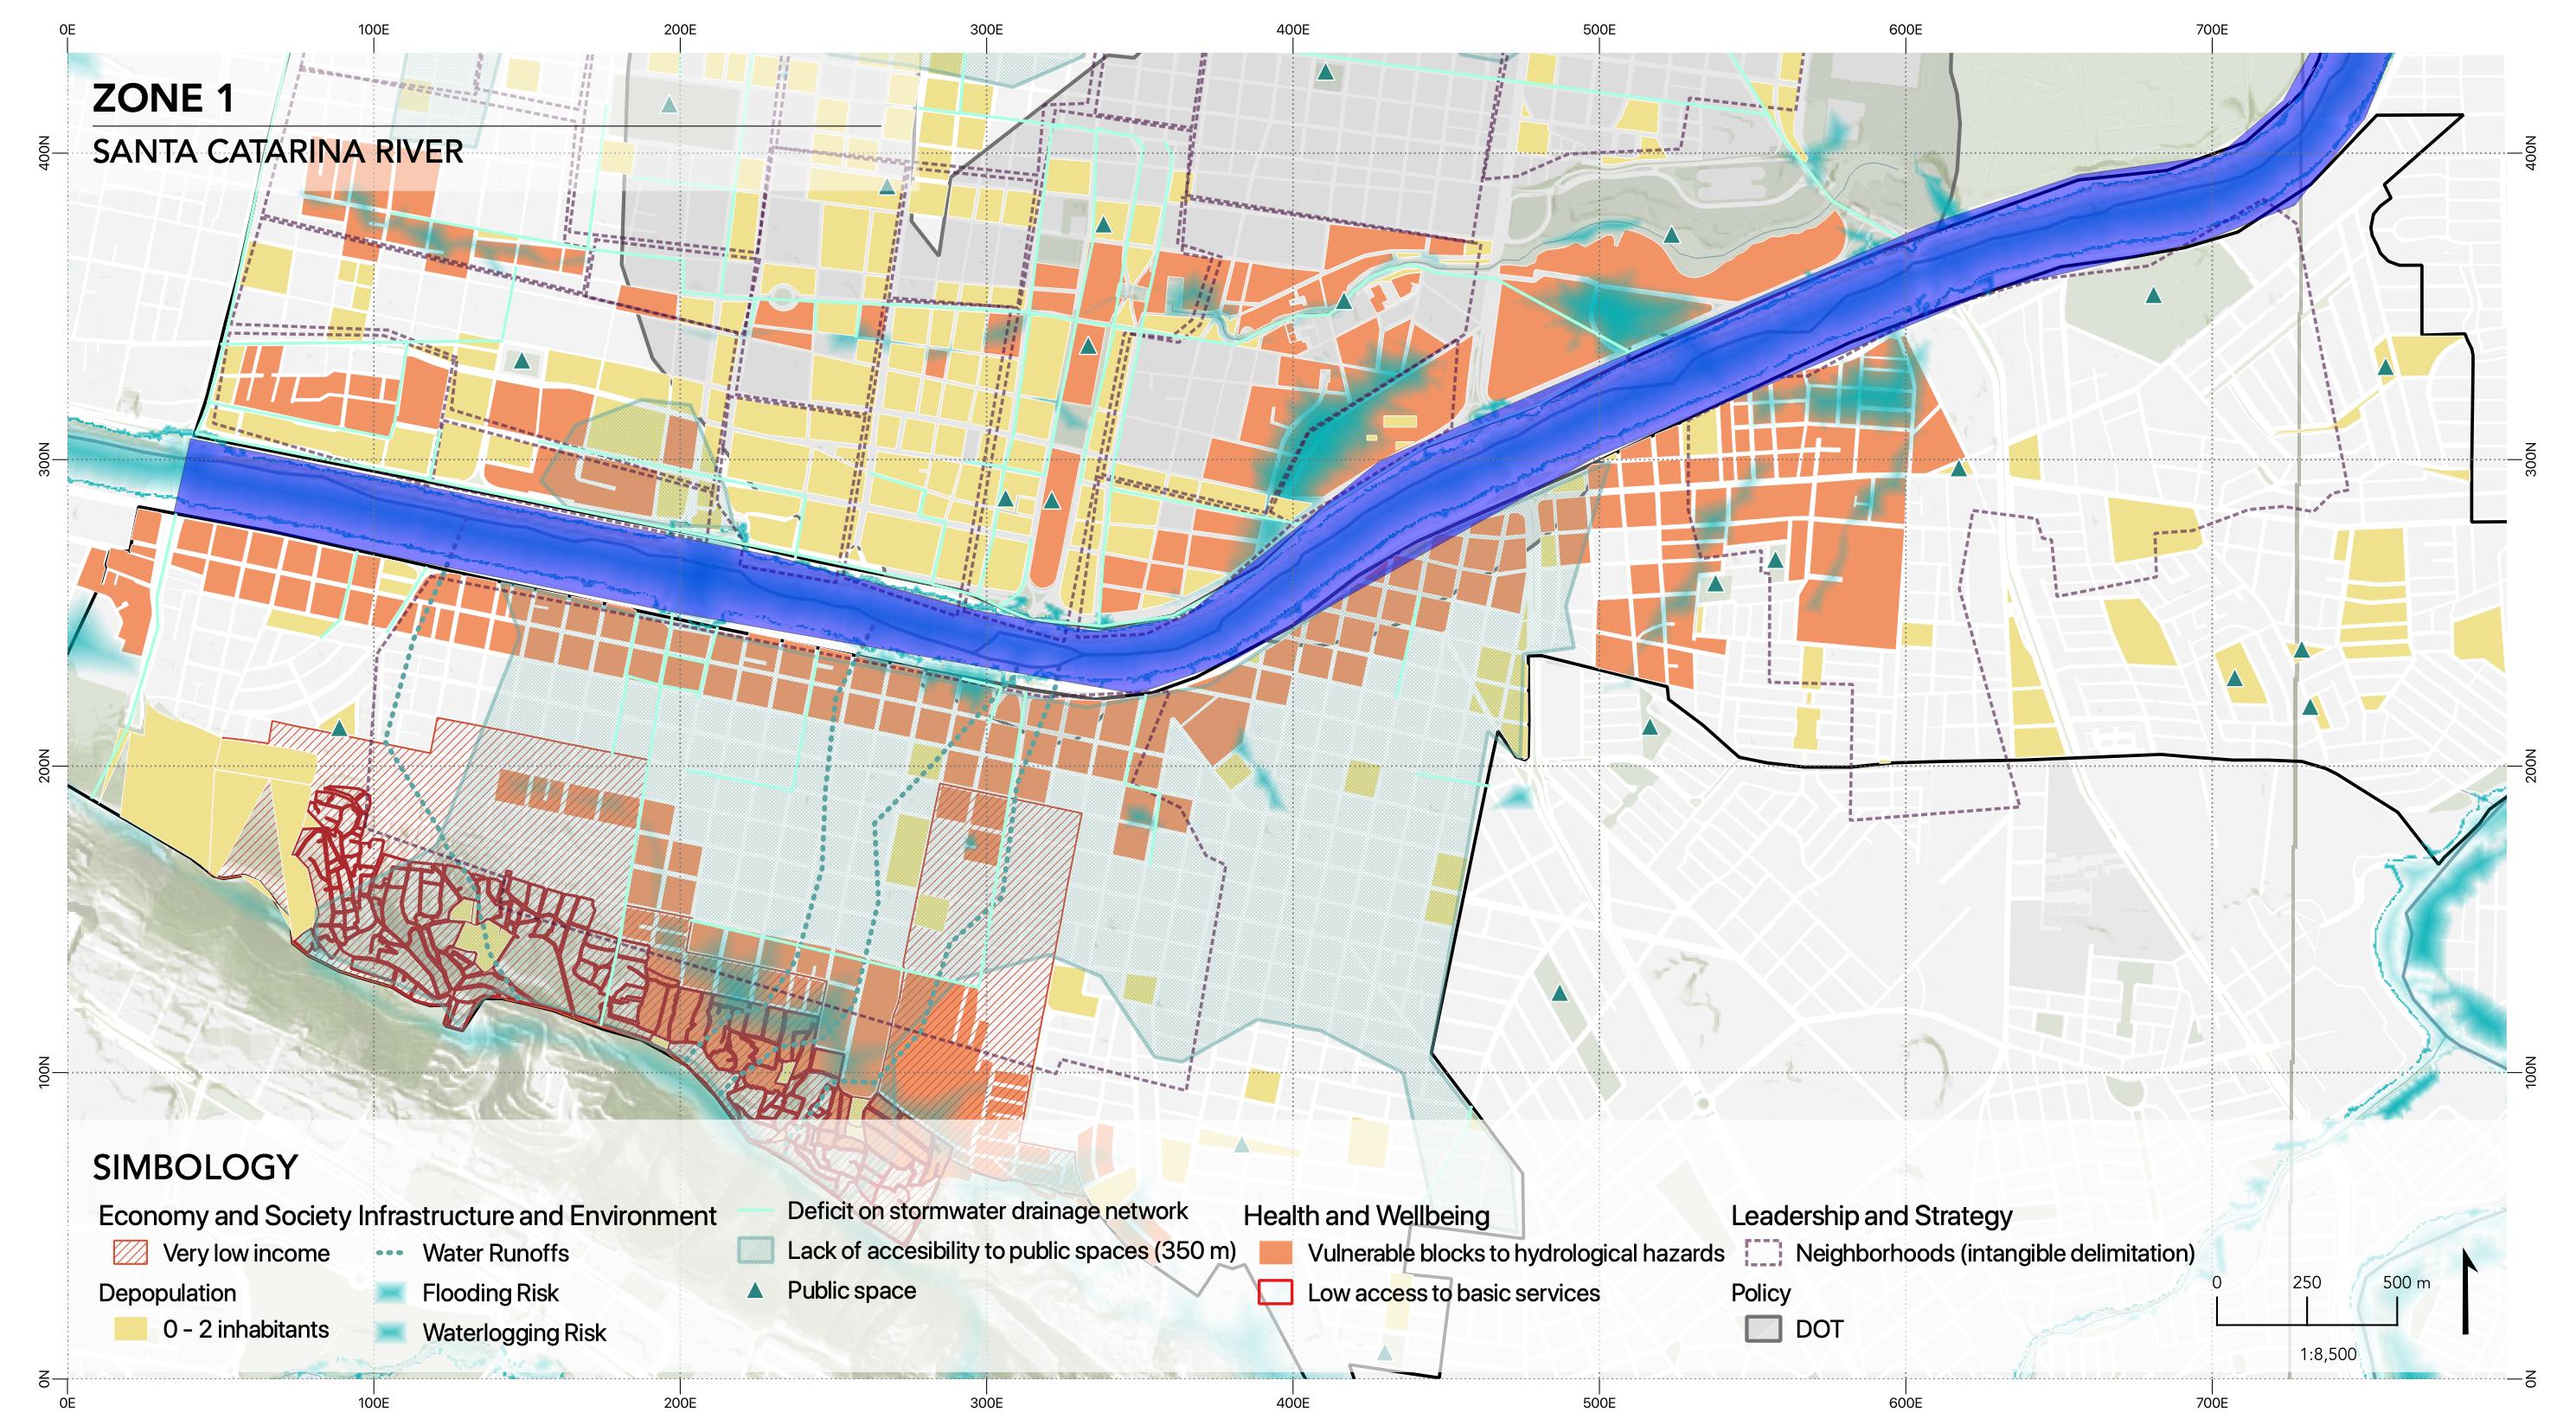
The city center has a concentration of services and economic activities that give service to different municipalities of the Monterrey Metropolitan Area through an extensive offer of public transport and roads, where the 56% of the bus routes pass by the site, across the Santa Catarina River sits Independencia Neighborhood, Pio X, El Realito, Nuevo Repueblo, Roma, Roma Sur and 33 more neighborhoods. The Santa Catarina River is both a connector and a divider between north and south with 127 m in width and 10 bridges along the 6.9 km of the study area
The area has a significant amount of historical infrastructure and architecture on both sides of the river that gives historical and aesthetic value to the zone, contributing to a sense of belonging and coherence. The mentioned
92
“The mentioned sense of belonging is present in the neighbors’ capacity to organize to protect their homes. “
sense of belonging is present in the neighbors’ capacity to organize to protect their homes.
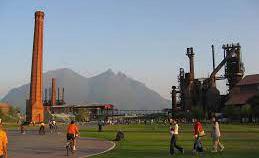
The accessibility of the citizens to Fundidora Park allows the increase of investment surrounding it and the inclusion of external people to come inside, increasing the recreational activities and economic activity of the number of commercials near the area.
The barriers adjacent to the area, mainly Independencia Neighborhood, are a significant disadvantage given the change in topographic level between the river and the Loma Larga, making it prone to hydrological and geological hazards.
The area has a problem regarding the contrast of complete monitoring of nature-related hazards, the unclear transmission of this information, and the capacity to respond to said hazards. As a consequence, these areas are vulnerable to issues such as gentrification, given the area’s history of dispossession, considering the historical infrastructure and architecture previously mentioned.
The infrastructure of critical services has high coverage in the area, even so, this infrastructure presents deficiencies; in the case of the water supply network, it isn’t capable enough to deal with shock events, one example of this is how the relief service vehicles aren’t able to provide to zones in topographically complicated zones due to the lack of action plans, and the demanding environmental conditions represent; regarding electricity, although also having high coverage, a recurring issue among reports of the neighbors is the danger and obstacle that the electrical infrastructure represents on the streets; meanwhile, the stormwater drainage has a problem of insufficiency of drainage and misalignment between the infrastructure and the topography.
The relationship between the Santa Catarina River, the water runoffs, the topography, and the deficiencies in stormwater drainage in the area contributes to the exposition of determining zones in the area to floods and waterlogging while the relationship between the topography and the built environment on zones with steep slopes contributes to the exposure of Loma Larga to landslides.
The zone represents a significant pole of economic activity as it concentrates on 50% of commercial areas; nevertheless, when the economy is being affected by shock events,
emergency funds are not allocated. Historical destruction and gentrification have impacted the collective environment, enabling distrust and resistance from inhabitants when external stakeholders consider the zone for future projects or investments. On the other hand, there is historical segregation and lowsecurity perception in the area, but mainly in Independencia Neighborhood. Regarding this, there is no reinforcement of the law to prevent crime and corruption throughout the whole zone.
The stakeholders with the highest incidence are precisely the leading stakeholders. However, this does not mean that they are more important than the archetypes or extremes but indicates that their involvement has a great weight for the realization of the projects, either because they have the legal tools for the authorization of proposals such as the IMPLANc or because of the capacity of available resources in the investment of these.
93
94
95 SECTION 03: MASTER PLAN
INTRODUCTION TO MASTER PLAN
This document is the master plan of Monterrey city center that will consider all mitigation and adaptation activities to achieve a resilient city.
In it, we will delimit and plan the development of a series of proposals in the downtown area of Monterrey, which will be in charge of fulfilling the established vision, on the other hand, the proposals will be guided by certain principles that will help us to guide our projects towards a resilient direction in the short, medium and long term, together with the objectives.
The proposals have been developed based on the conclusion obtained from the previously mentioned site analysis, seen from the 4 dimensions of the Rockefeller Resilience Index.
Covering topics such as vegetation, territorial regeneration, climate change, public space, architecture, and housing, among others.
96
97
methodology
vision
Looking forward the conditions of the site and how the diagnosis and objectives that emerge from this aims to recover values and make more resilient neighborhoods
Objectives guiding principles intervention areas
Goals that will improve the conditions of living on the site but focused on risk management, resilience, economy, opportunities and public space accesible for all population
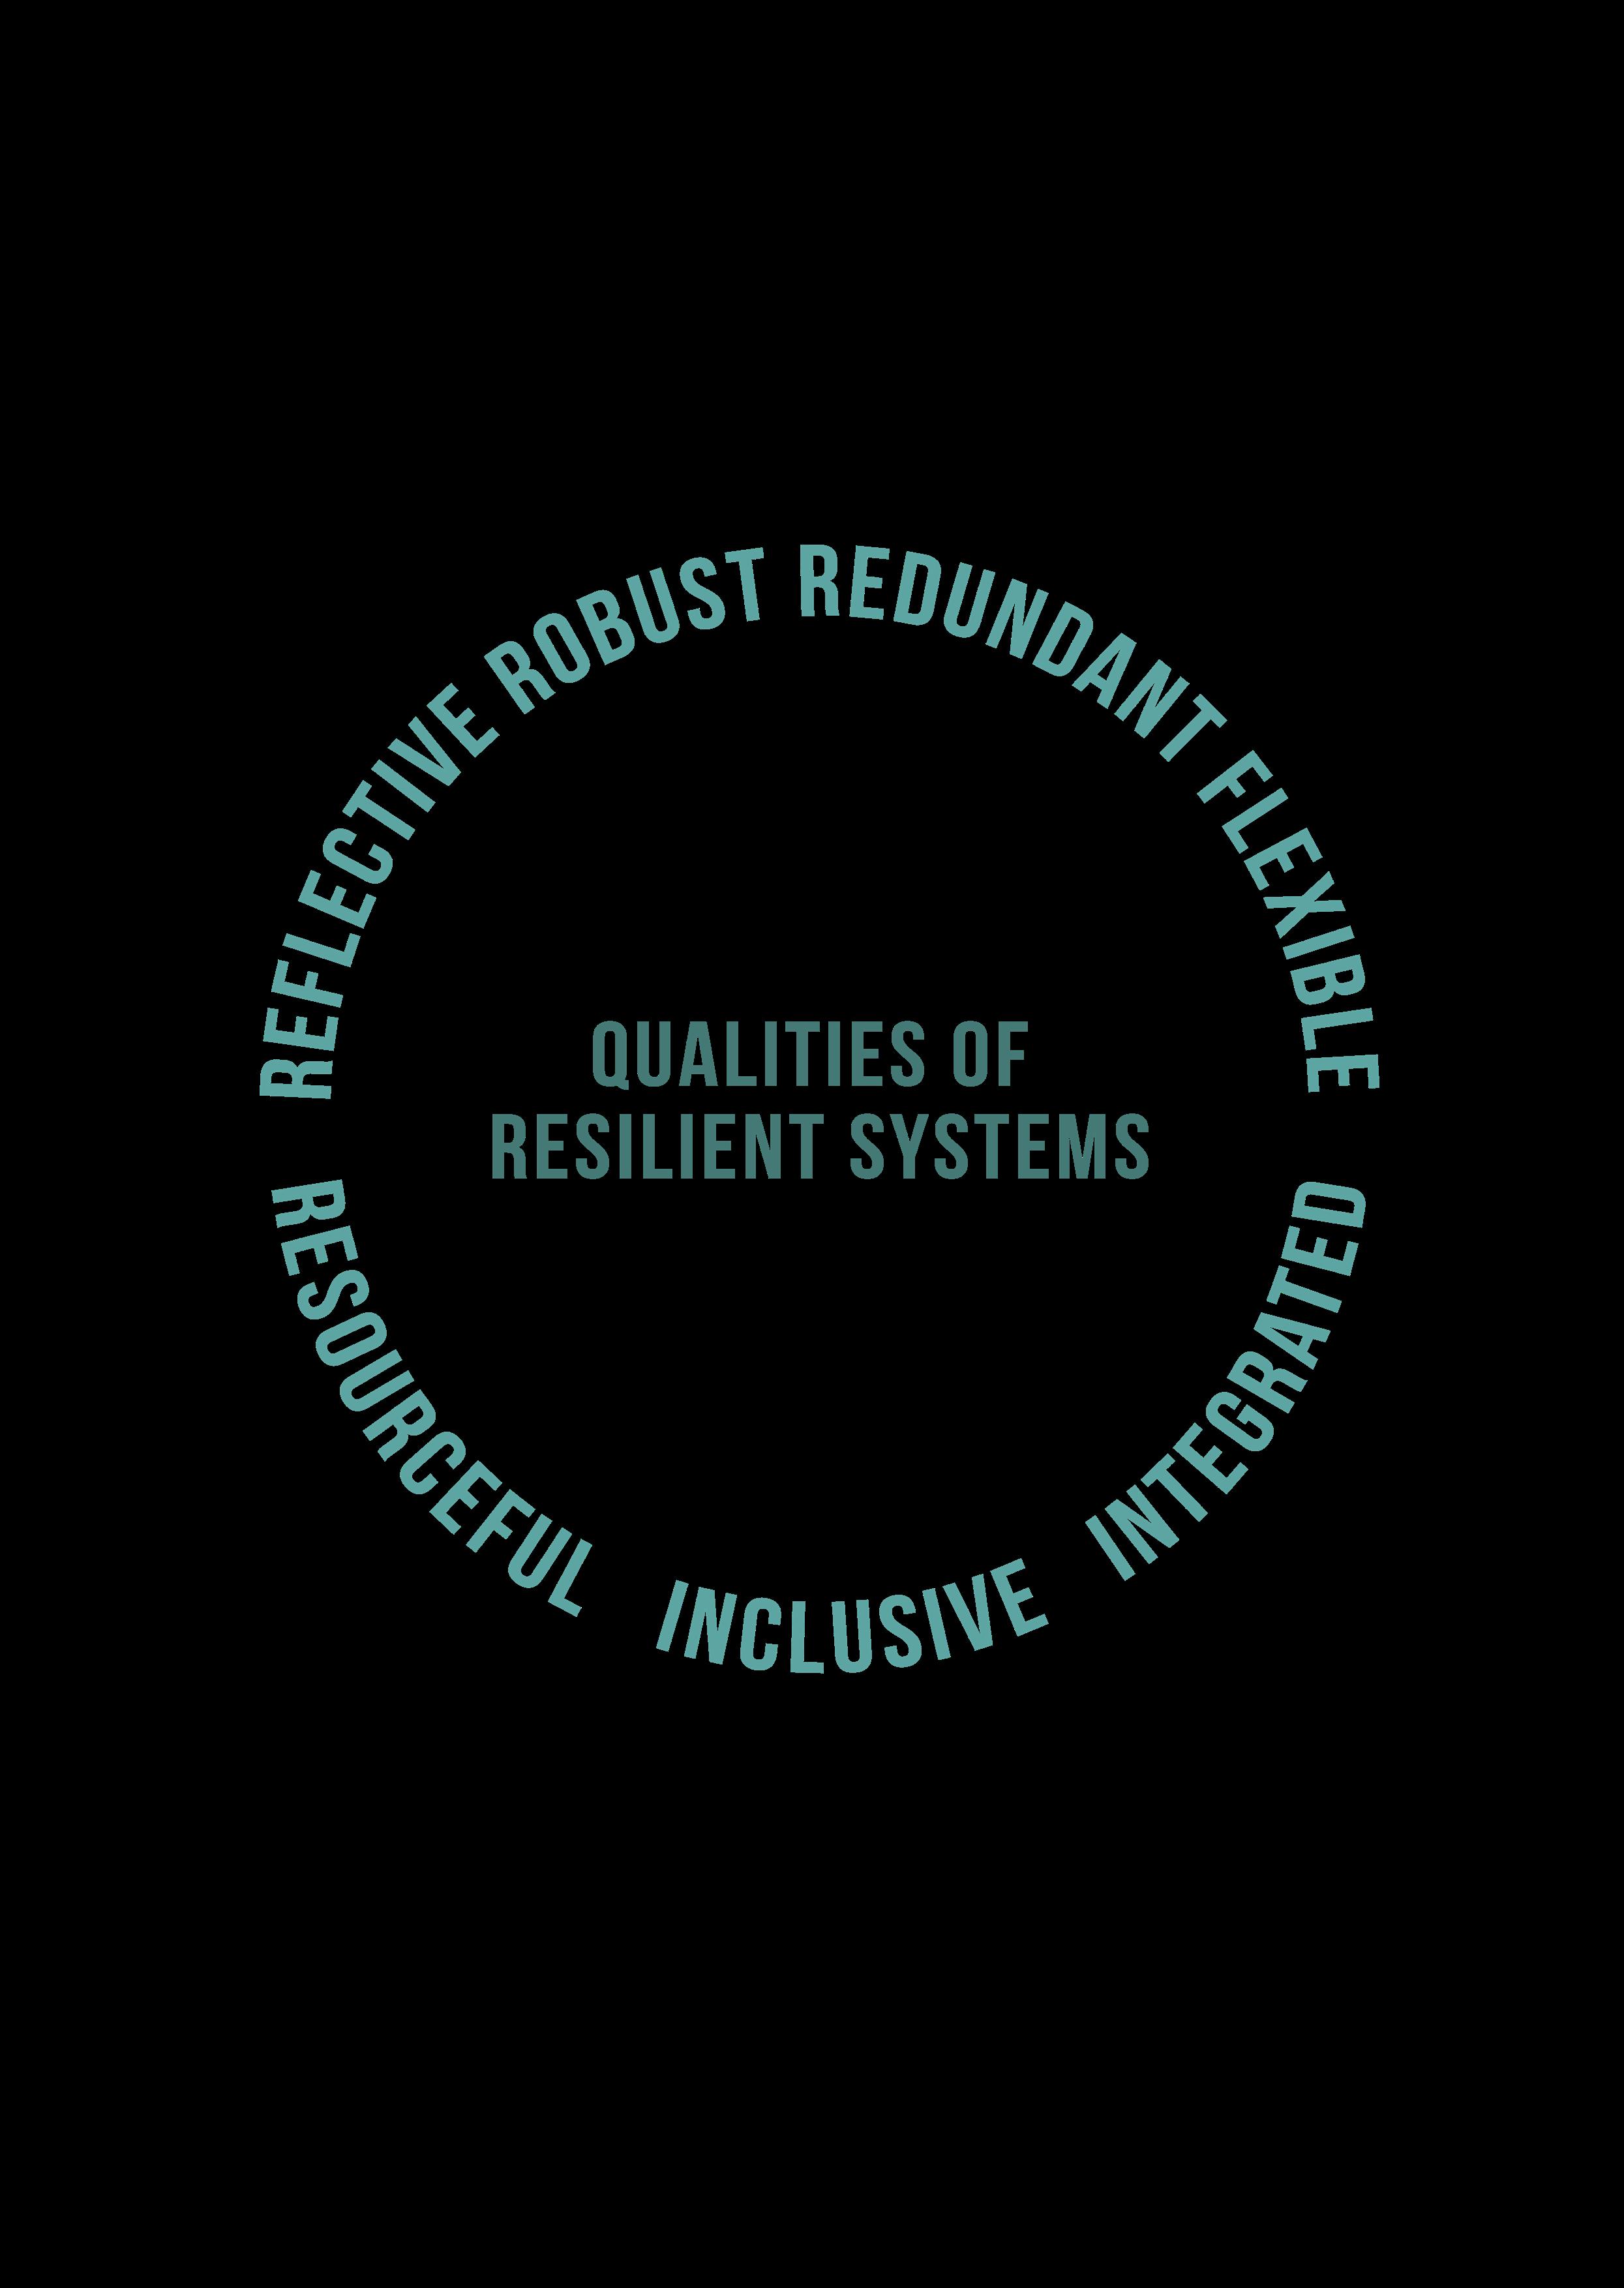
Principles that will guide the way of doing things, prioritizing certain aspects, elements and population groups for the definition of problems and strategies to be addressed. Those should be: reflective, robust, redundant, flexible, resourceful, inclusive and integrated
Definition of problematics according to what it’s conclude on the diagnostic but territorially, selecting specific areas that are in risk or presenting an specific situation
STRATEGIES proposals
Plans to adapt or mitigate a risk, choosing an intervention area to then take action. Those are aligned to all the past steps to have an integral focus.
Specific elements or actions part of a project that considers all the factors listed on the intervention area and the strategy. This projects could be in short medium or long term.
98
99
Legal FRAMEWORK
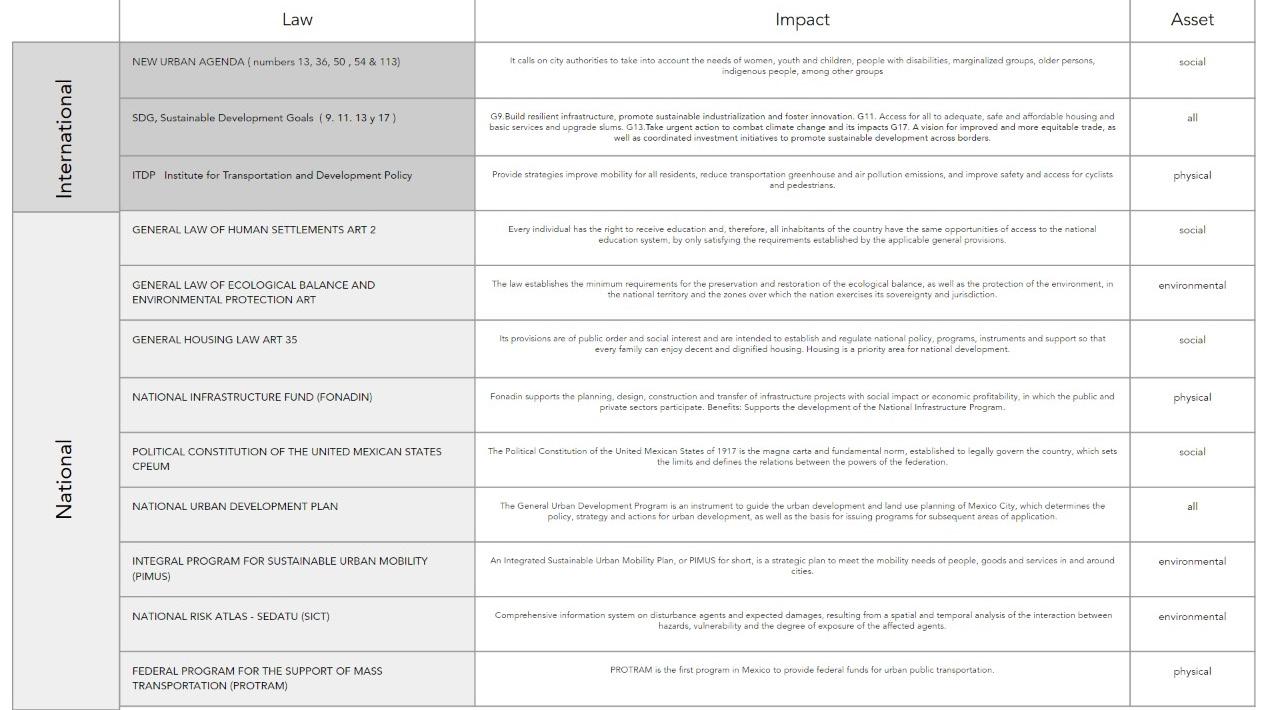
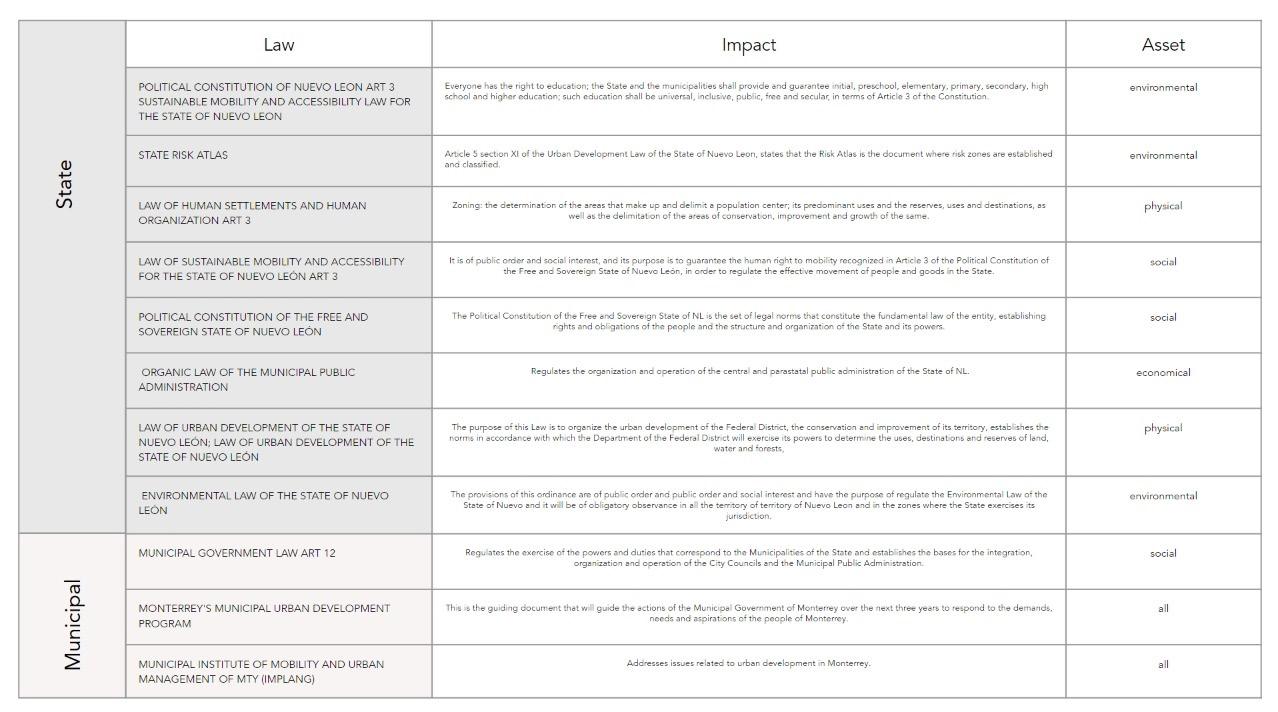
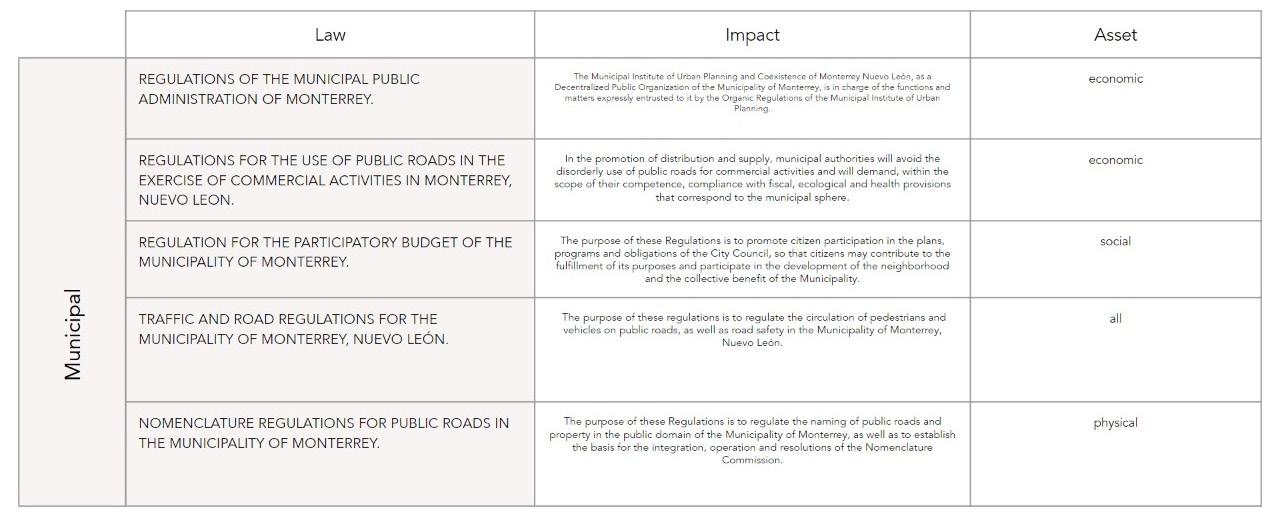
Urban growth and mobility in the nation are governed by a variety of standards, laws, and programs that are derived from them. Various scales or tiers of government have different standards, regulations, and programs (Federal, State, Metropolitan, and Municipal). Due to the fact that, despite having basic foundations, each municipality, city, or state can set policies and plans for its urban development as long as they abide by the laws and superior programs, each region’s urban form varies. The normative principles found in Federal, State, and Municipal legislation are integrated into the legal framework that provides support and foundation to the competence, attributions, and procedures for the formulation, approval, and administration of the urban development of the municipality of Monterrey. The various laws, rules, regulations, and programs of the various governmental levels that govern and have an impact on our study region, Center of Monterrey, are summarized here.
Internation Legal System
NEW URBAN AGENDA ( numbers 13, 36, 50 , 54 & 113)
• SDG, Sustainable Development Goals ( 9. 11. 13 y 17 )
• ITDP Institute for Transportation and Development Policy
Federal Legal System
GENERAL LAW OF HUMAN SETTLEMENTS
ART 2
• GENERAL LAW OF ECOLOGICAL BALANCE AND ENVIRONMENTAL PROTECTION ART 2
• GENERAL HOUSING LAW ART 35
• NATIONAL INFRASTRUCTURE FUND (FONADIN)
• POLITICAL CONSTITUTION OF THE UNITED MEXICAN STATES CPEUM
• NATIONAL URBAN DEVELOPMENT PLAN
• INTEGRAL PROGRAM FOR SUSTAINABLE URBAN MOBILITY (PIMUS)
• NATIONAL RISK ATLAS - SEDATU (SICT)
• FEDERAL PROGRAM FOR THE SUPPORT OF MASS TRANSPORTATION (PROTRAM)
State Legal System
• POLITICAL CONSTITUTION OF NUEVO LEON ART 3 SUSTAINABLE MOBILITY AND ACCESSIBILITY LAW FOR THE STATE OF NUEVO LEON
• MOBILITY LAW STATE RISK ATLAS
• LAW OF HUMAN SETTLEMENTS AND HUMAN ORGANIZATION ART 3 LAW OF SUSTAINABLE MOBILITY AND ACCESSIBILITY FOR THE STATE OF NUEVO LEÓN ART 3 POLITICAL CONSTITUTION OF THE FREE AND SOVEREIGN STATE OF NUEVO LEÓN
• ORGANIC LAW OF THE MUNICIPAL PUBLIC ADMINISTRATION
• LAW OF URBAN DEVELOPMENT OF THE STATE OF NUEVO LEÓN; LAW OF URBAN DEVELOPMENT OF THE STATE OF NUEVO LEÓN
ENVIRONMENTAL LAW OF THE STATE OF NUEVO LEÓN
Municipal Legal System
• MUNICIPAL GOVERNMENT LAW ART 12 MONTERREY’S MUNICIPAL URBAN DEVELOPMENT PROGRAM
• MUNICIPAL ECOLOGY PROGRAM
MUNICIPAL INSTITUTE OF MOBILITY AND URBAN MANAGEMENT OF MTY (IMPLANG)
• REGULATIONS OF THE MUNICIPAL PUBLIC ADMINISTRATION OF MONTERREY.
• REGULATIONS FOR THE USE OF PUBLIC ROADS IN THE EXERCISE OF COMMERCIAL ACTIVITIES IN MONTERREY, NUEVO LEON.
• REGULATION FOR THE PARTICIPATORY BUDGET OF THE MUNICIPALITY OF MONTERREY.
• TRAFFIC AND ROAD REGULATIONS FOR THE MUNICIPALITY OF MONTERREY, NUEVO LEÓN.
• NOMENCLATURE REGULATIONS FOR PUBLIC ROADS IN THE MUNICIPALITY OF MONTERREY.
The tables above showed the relationship between the different legal systems (international, federal, state and municipal) and their impact on downtown Monterrey, as well as the law’s asset. These assets are categorized in four branches: social, economic, cultural, physical and environmental.
Prepared by Sara Car dona with information from the official web site of the Government of Monterrey.
100
101
vision
Monterrey’s city center develops closely to its historical and territorial identity with a perspective that embraces the preservation and regeneration of the environment. It evolves with an understanding of the social diversity that exists within its neighborhoods and interventions that prioritize resilience through adaptation and mitigation of hazards.
102
103
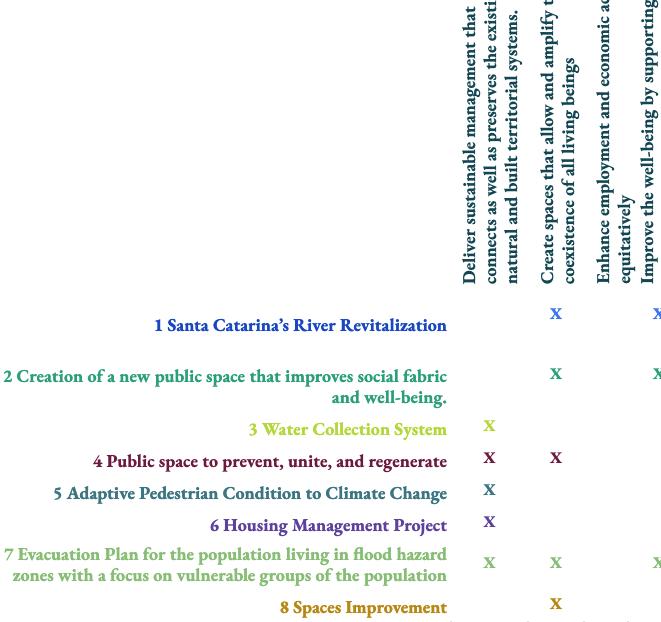
objectives
Decisions and actions regarding the existing space development should have an environmental perspective through regenerative interventions, trying to share these values and knowledge with the next generations. Enhancing critical services management and accessibility.
Creating and developing public spaces for all people considering their age, gender, or physical characteristics, so that the environment perceived in these places should be as inclusive and secure as possible. This requires analyzing the needs of each of the population groups to adapt them to the different spaces. It is important to take into account places such as the river, Loma Larga hill, and its surroundings for planning and developing strategies to create habitat areas large enough to support native functioning ecosystems. This requires protecting areas with high biodiversity; enhancing, expanding, and adding habitat in strategic locations, and creating linkages between habitat areas.
The Economic activity shall reinforce sustainable development toward equitable opportunities and local competitiveness by improving the quality of public education within the area. This requires the enhancement of employment, improvement in public investment at educational institutions, and the complement of healthy and innovative economic growth.
104
Deliver sustainable management that connects as well as preserves the existing natural and built territorial systems
1
Create spaces that allow and amplify the coexistence of all living beings2
Enhance employment and economic activity equitatively3
Locate the strategic areas of the polygon that provide the most social, health, economic and recreational benefits to people inside and outside the polygon using public space, with an inclusive, accessible, and safe infrastructure.
Connect with the vision and priorities to understand the lived experiences in the area. Solving the ongoing depopulation and gentrification by strengthening the relationship between internal and external stakeholders. This requires the creation of different activities to reduce the barriers to participation, such as virtual chats, breakout groups, surveys, and sketching.
Communicate and inform the public of danger zones by creating awareness of locations and timing prone to hazards. With the guidance of key elements such as plans and procedures that would contribute to minimizing the risks and fatalities when dealing with adverse circumstances.
105
Improve the well-being by supporting public spaces that provide benefits to all citizens4
Strengthen social connections within stakeholders5 Minimize human and city exposure to water-related and extreme temperature risks.
6

106
Elaborated by Catalina Salinas

Decisions and actions regarding the existing space development should have an environmental perspective through regenerative interventions, trying to share these values and knowledge to the next generations. Enhancing the critical services management and accessibility.
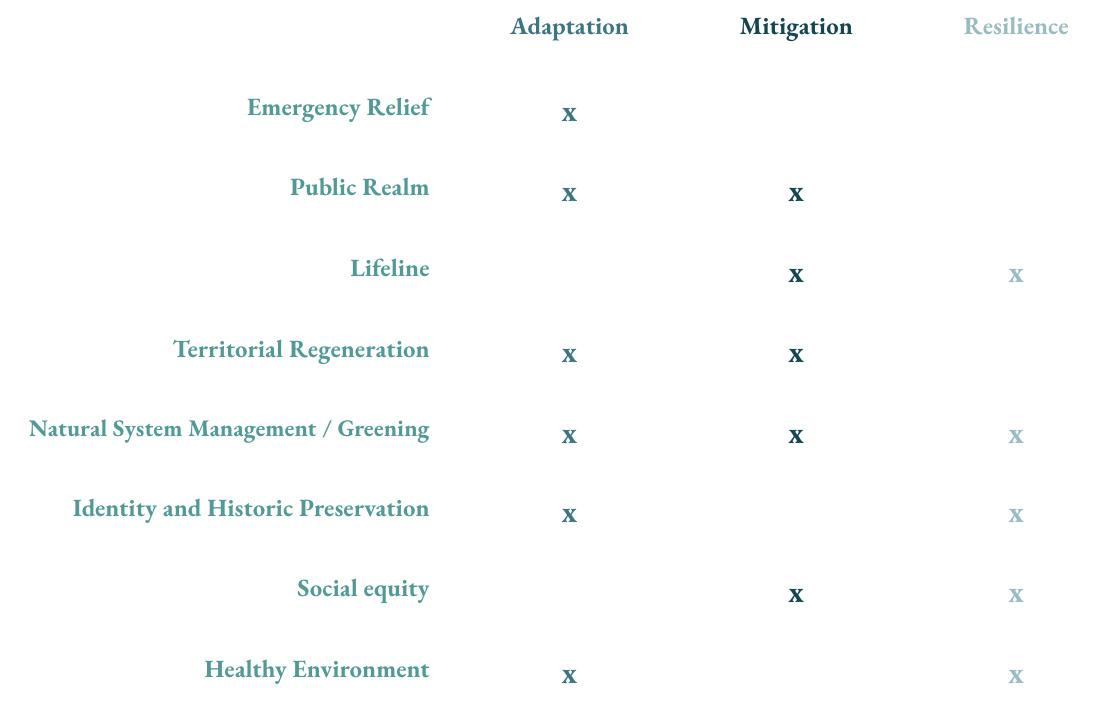
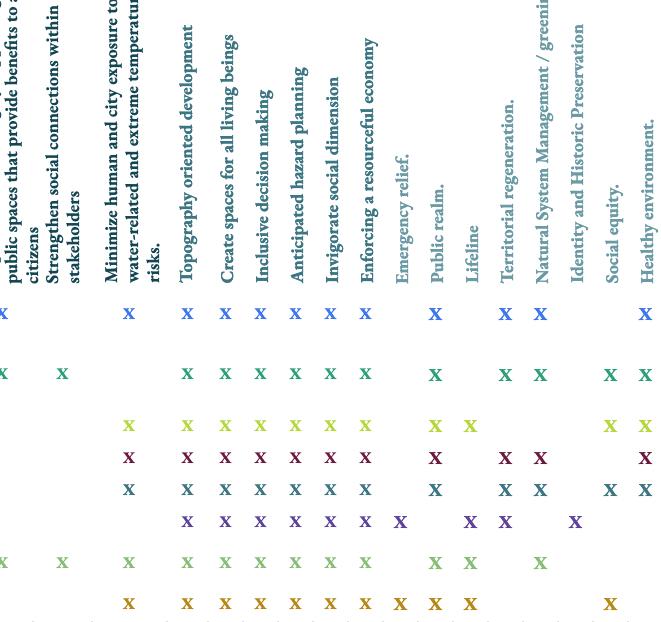
Emergency relief1 Public realm2
Creating and developing public spaces for all people regardless of their age or physical characteristics, so that the environment perceived in these places should be as inclusive and secure as possible. This requires analyzing the needs of each of the population group. It is important to take into account places such as the river, loma larga hill for planning and developing strategies to create habitat areas large enough to support native functioning ecosystems.
This requires protecting areas with high biodiversity; enhancing, expanding, and adding habitat in strategic locations, and creating linkages between habitat areas.
Lifeline3
Economic activity shall reinforce a sustainable development toward equitative opportunities and local competitiveness by improving the quality of public education within the area. This requires the enhancement of employment, improvement in public investment at educational institutions and the complement of healthy and innovative economic growth.
Territorial regeneration
Locate the strategic areas of the polygon that provide the greatest social, health, economic and recreational benefits to people inside and outside the polygon with the use of public space, with an inclusive, accessible and safe infrastructure.
Natural System Management / greening
Locate the strategic areas of the polygon that provide the greatest social, health, economic and recreational benefits to people inside and outside the polygon with the use of public space, with an inclusive, accessible and safe infrastructure.
108
5 STRATEGIES
4
Connecting with the vision and priorities to understand the lived experiences in the area. Solving the on-going depopulation and gentrification by strengthening the relationship between internal and external stakeholders. This requires the creation of different activities to reduce the barriers to participation, such as, virtual chats, breakout groups, surveys, and sketching.
Identity and Historic Preservation6 Social equity7
Communicate and inform the public of danger zones by creating awareness of locations and timing prone to hazards. With the guidance of key elements such as plans and procedures that would contribute in minimizing the risks and fatalities when dealing with adverse circumstances.
Healthy environment8
Communicate and inform the public of danger zones by creating awareness of locations and timing prone to hazards. With the guidance of key elements such as plans and procedures that would contribute in minimizing the risks and fatalities when dealing with adverse circumstances.
109
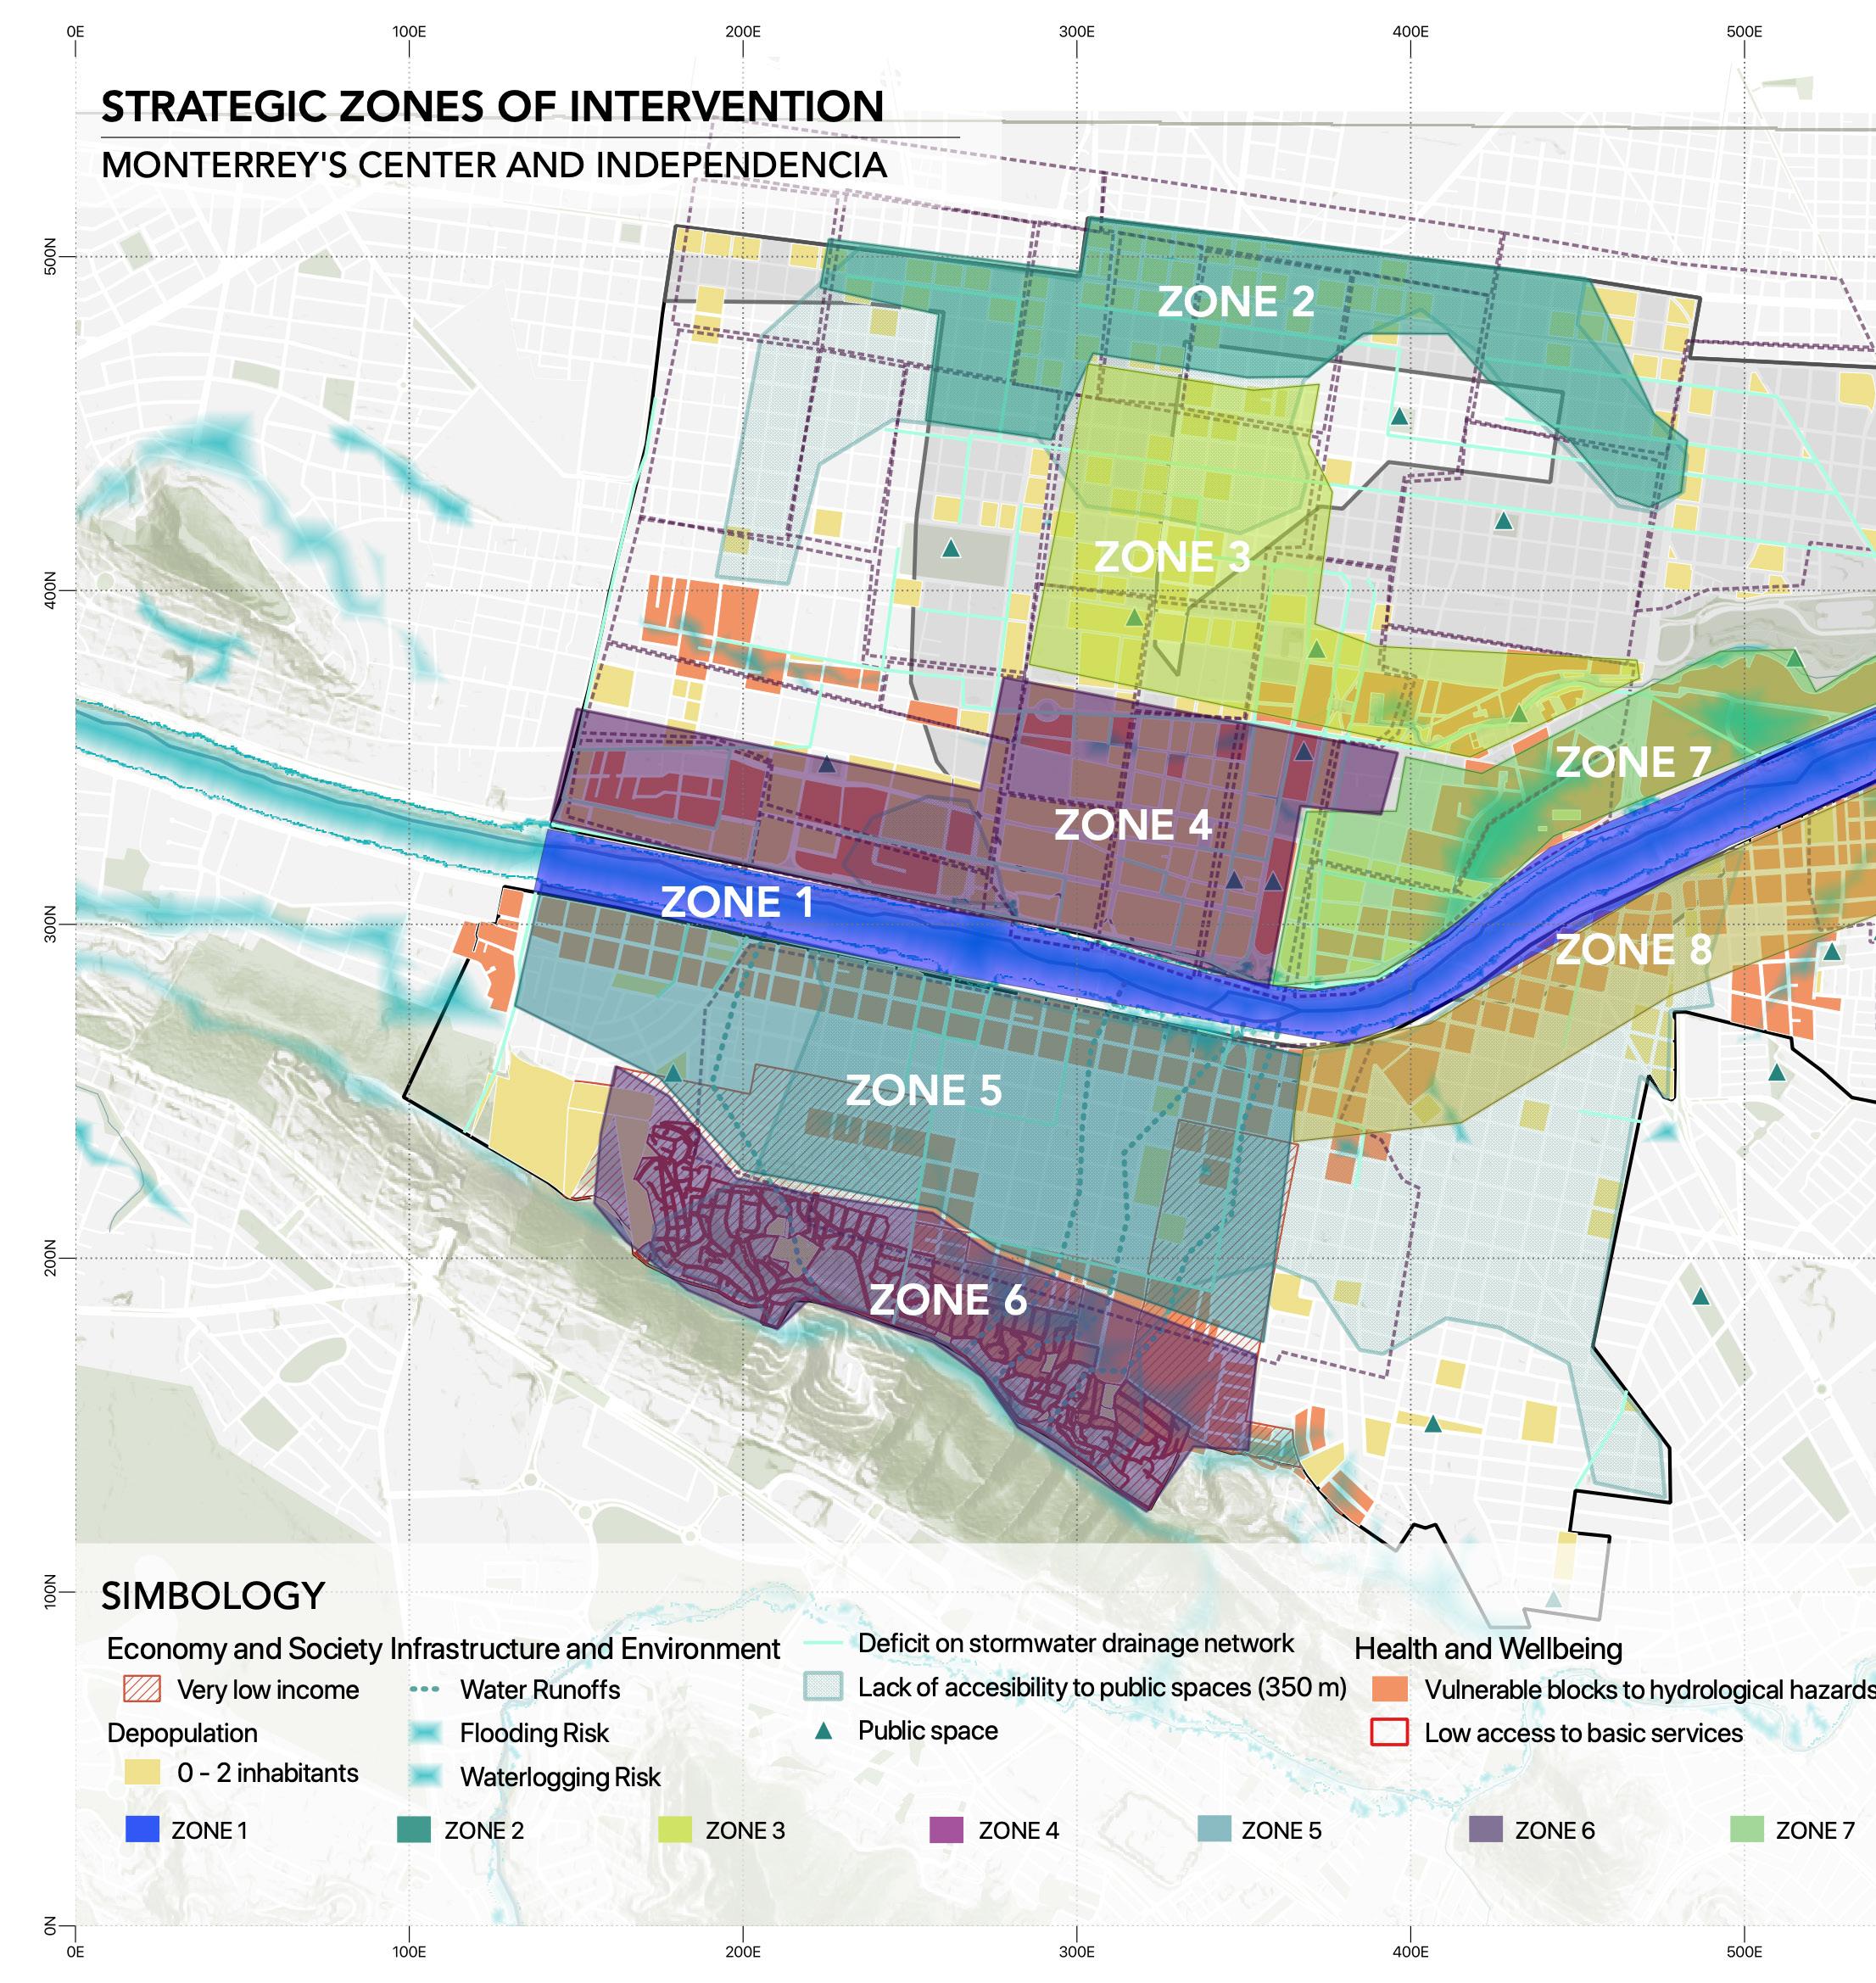
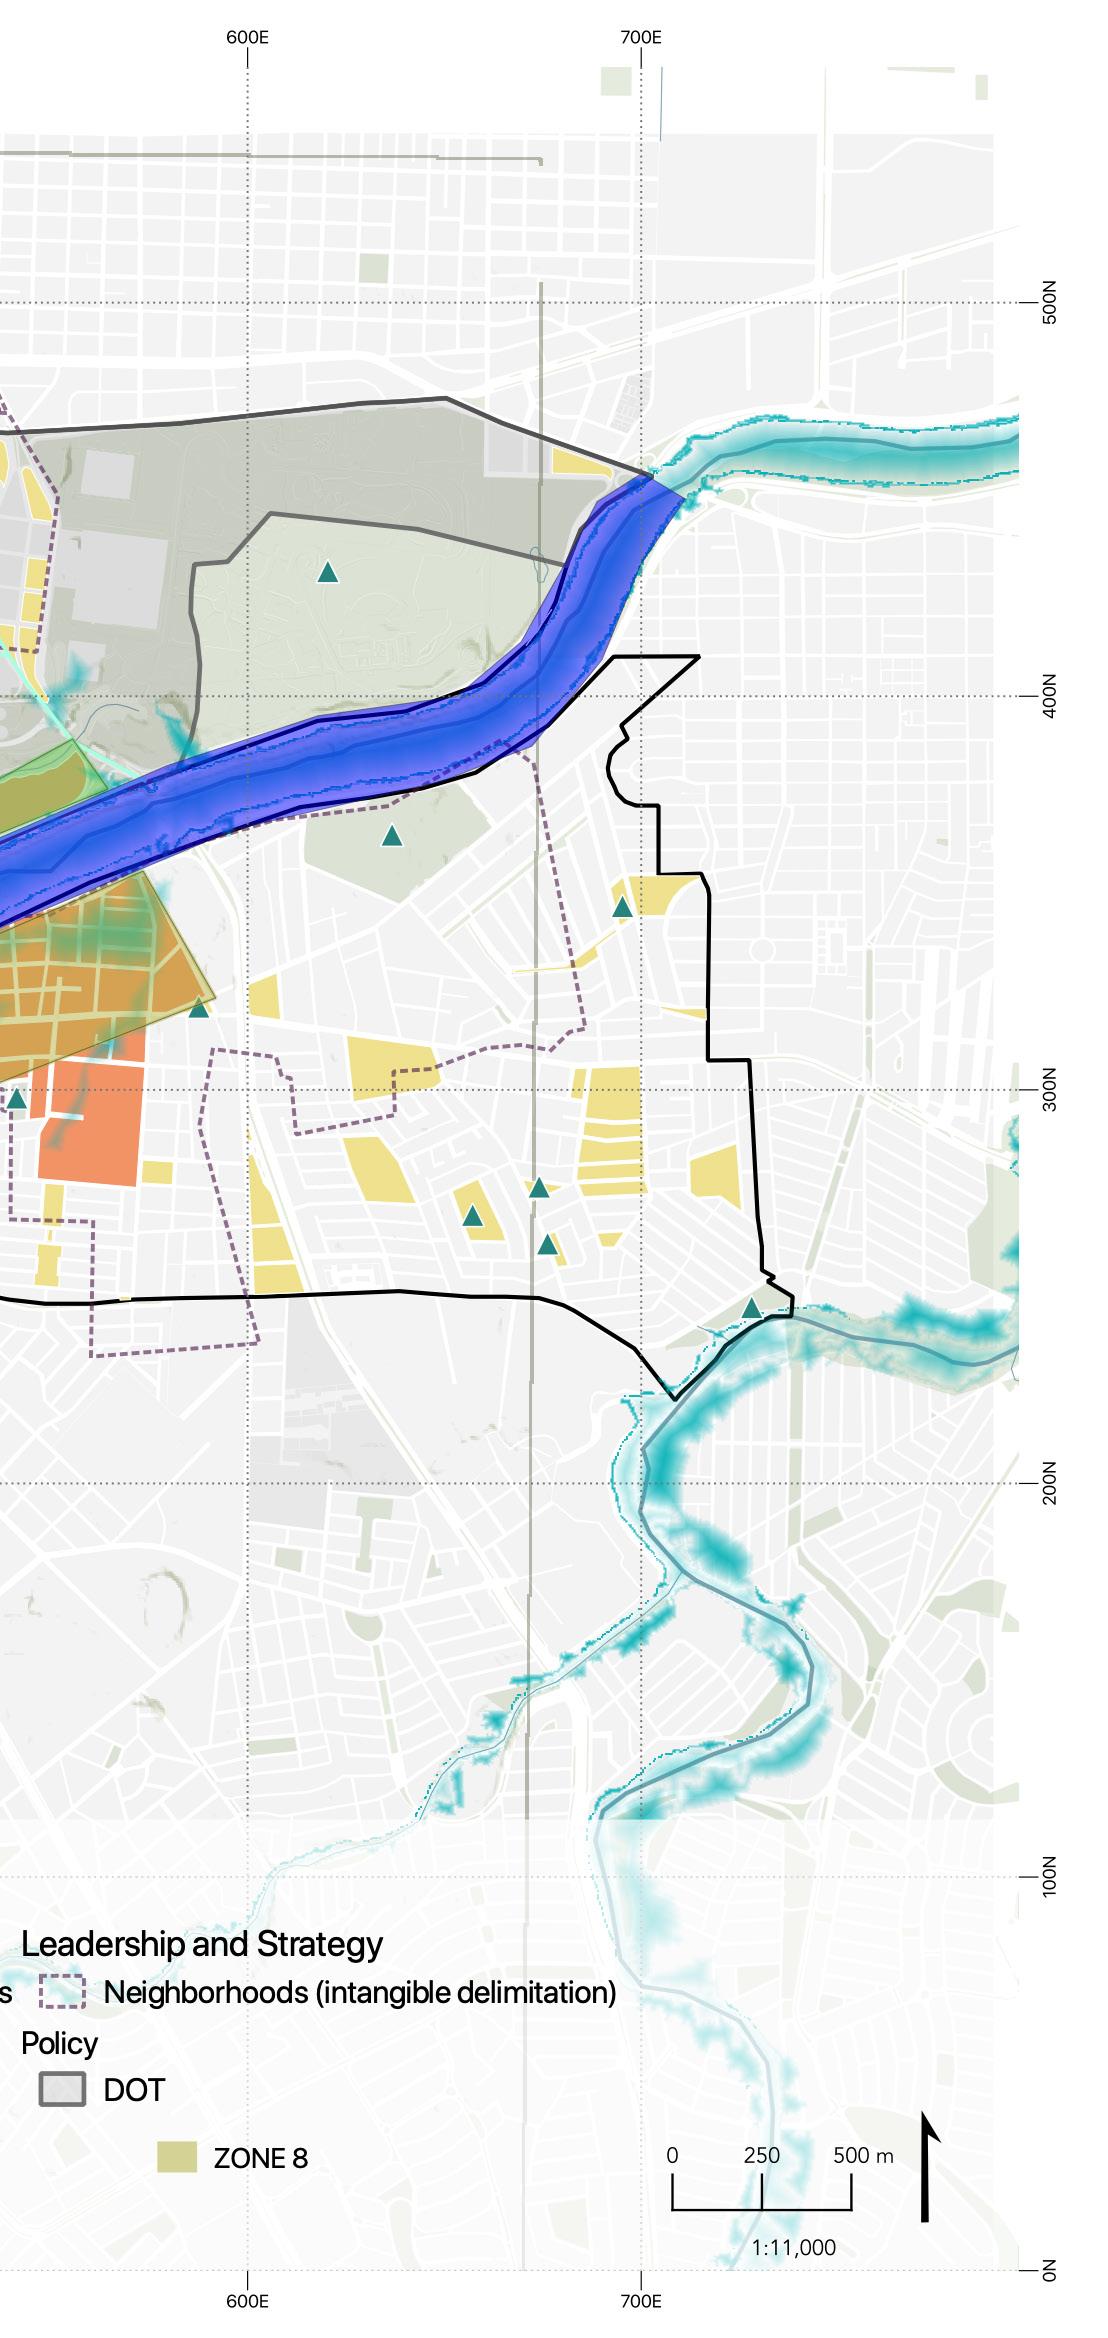
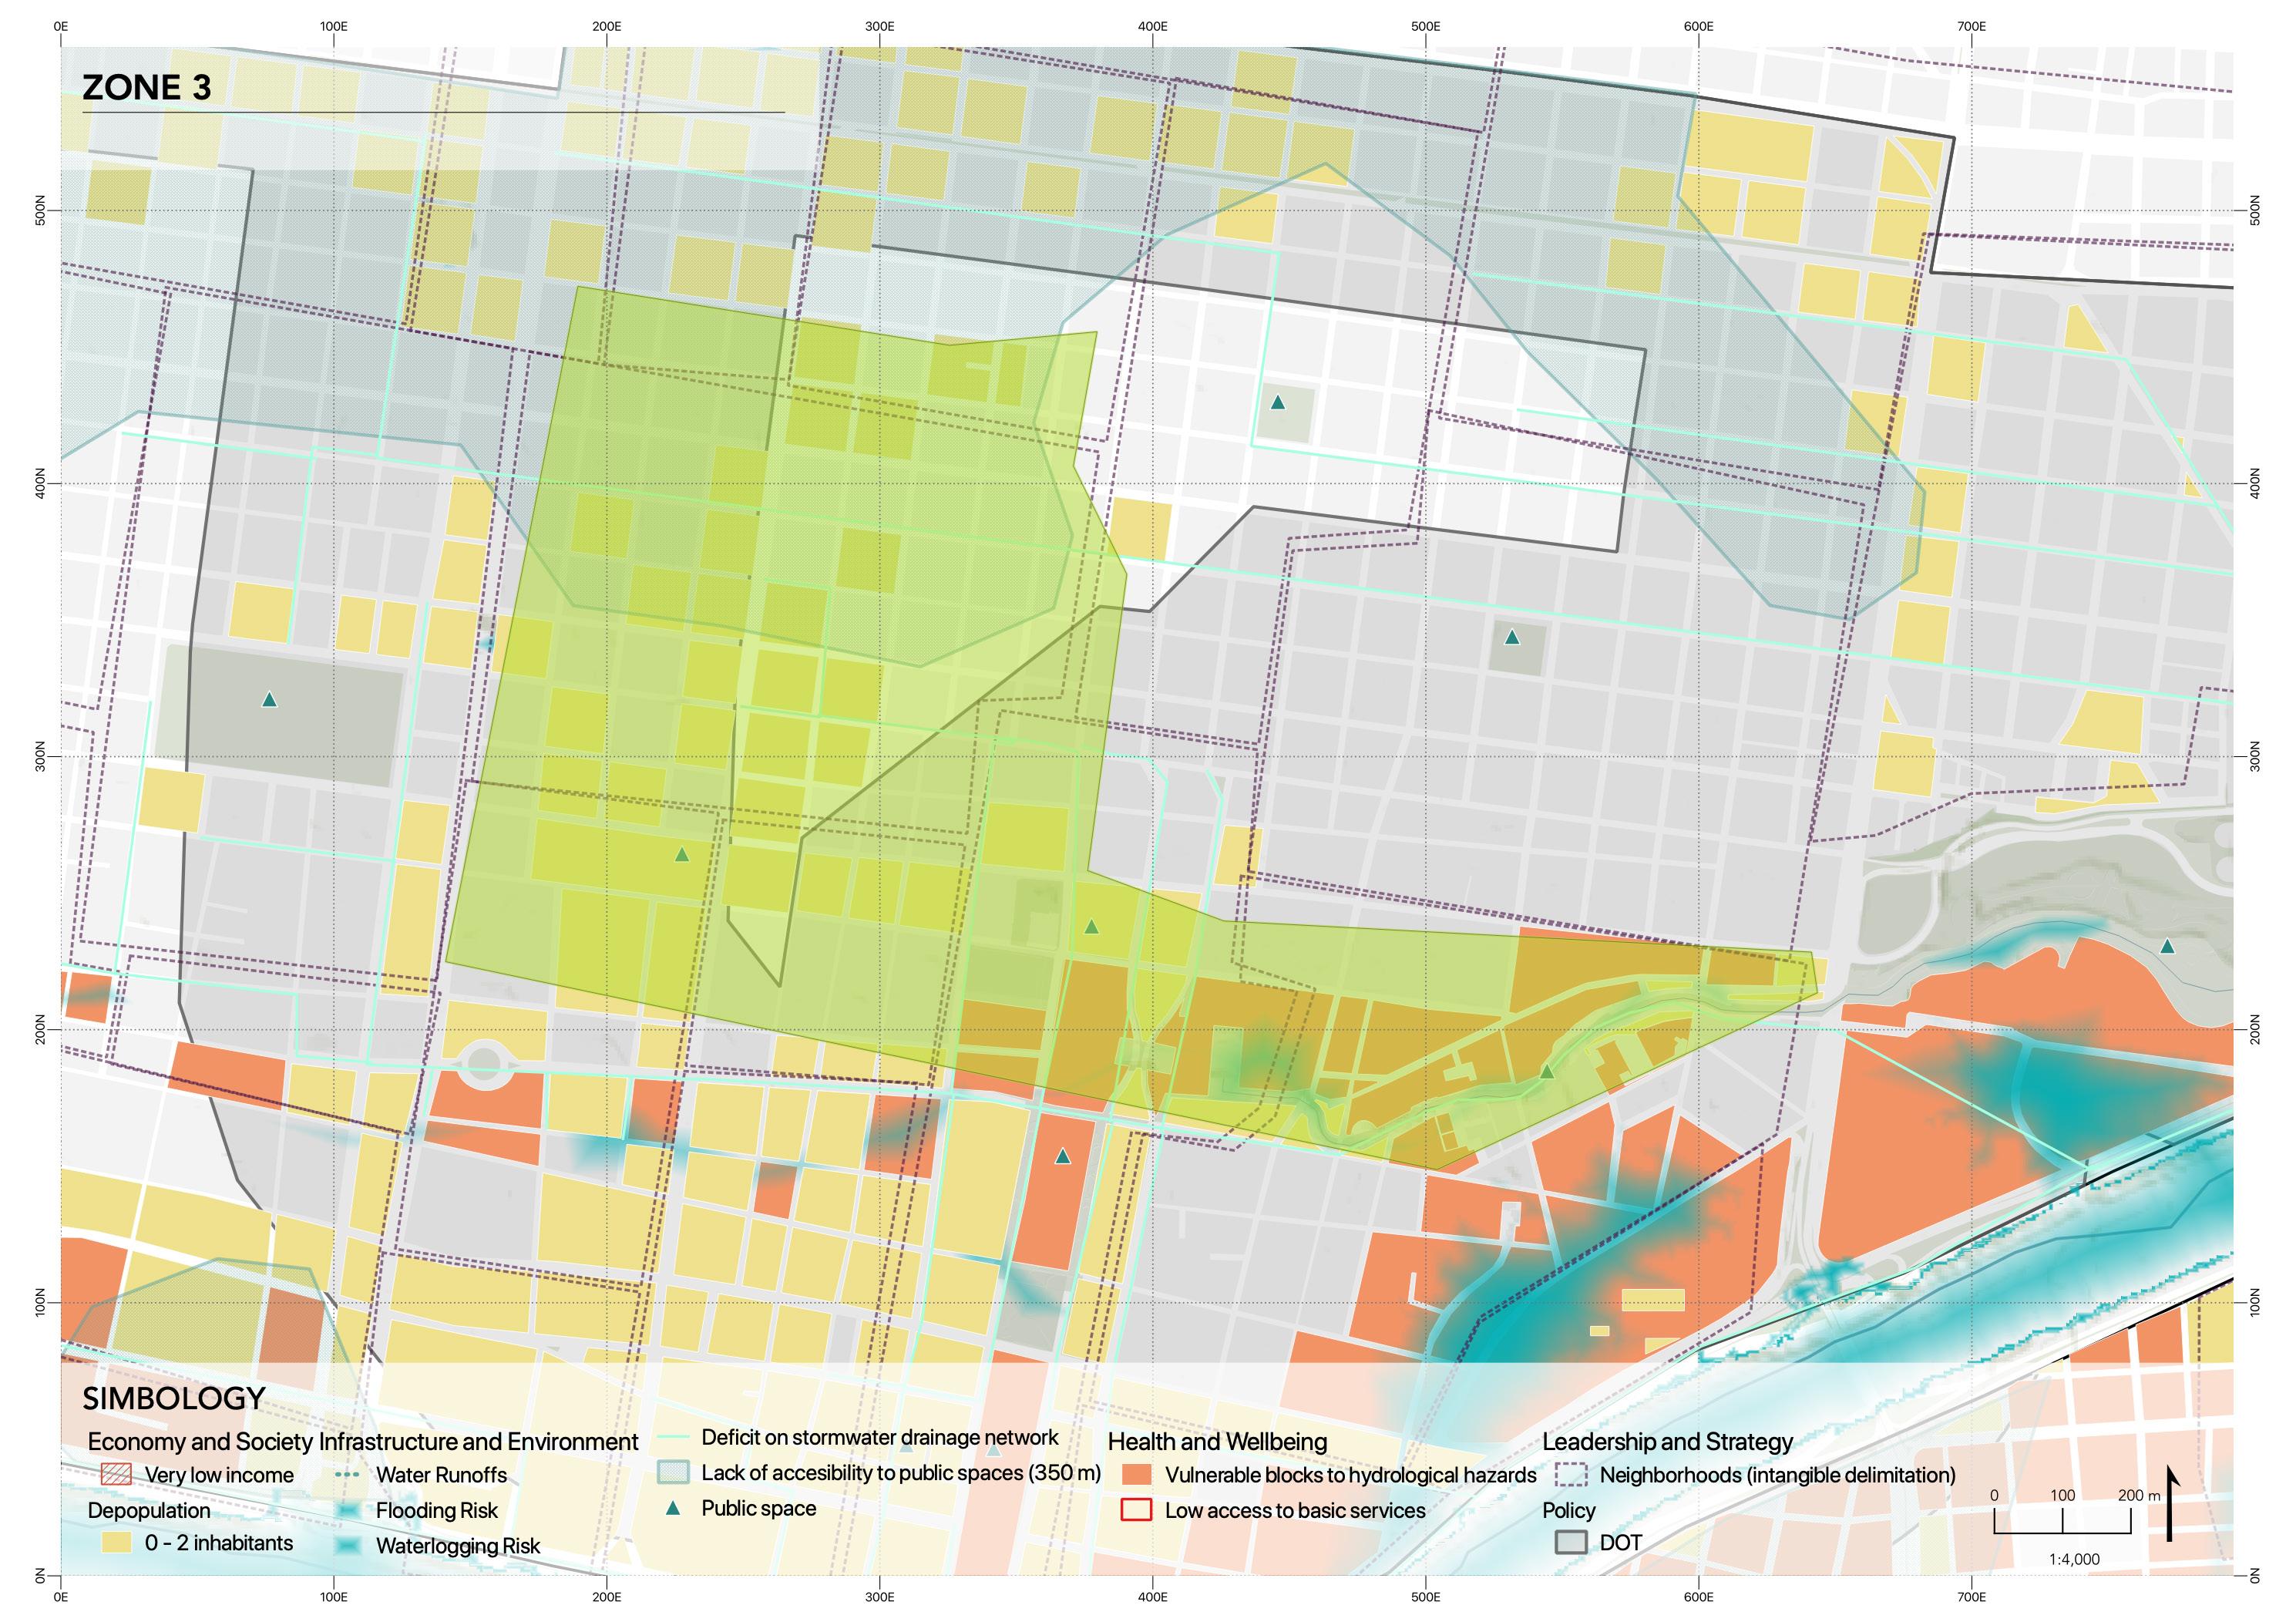
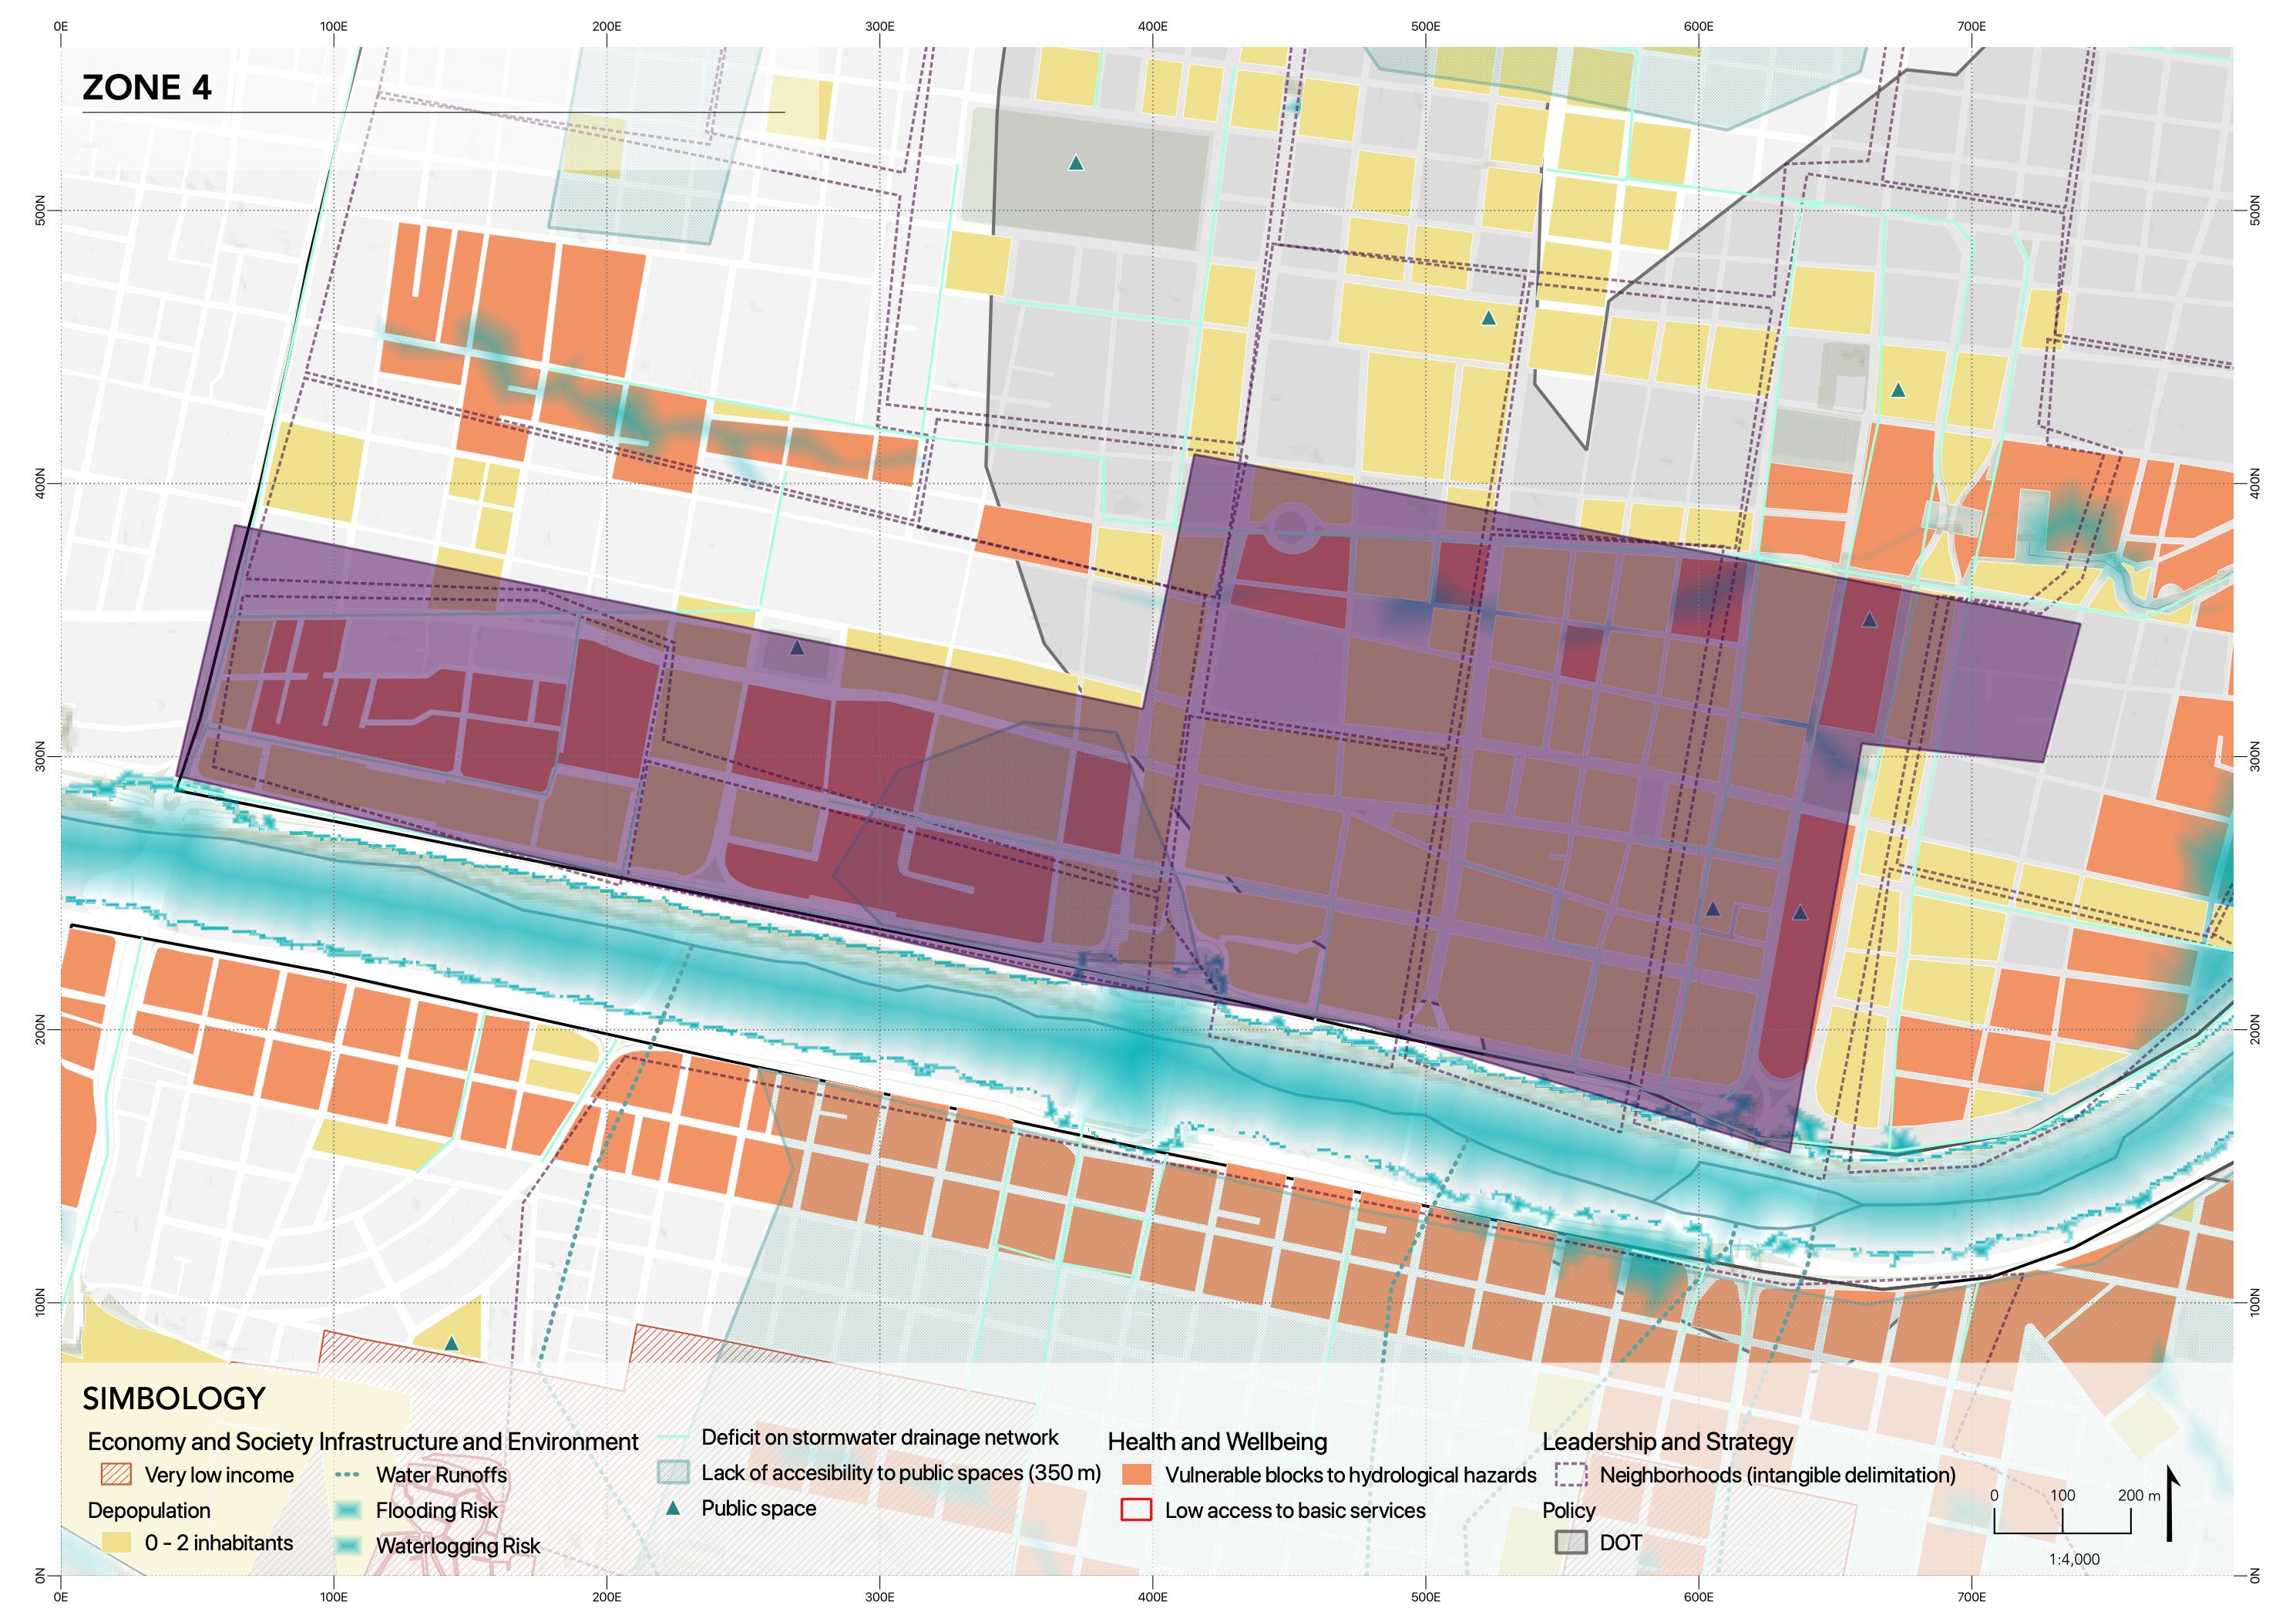
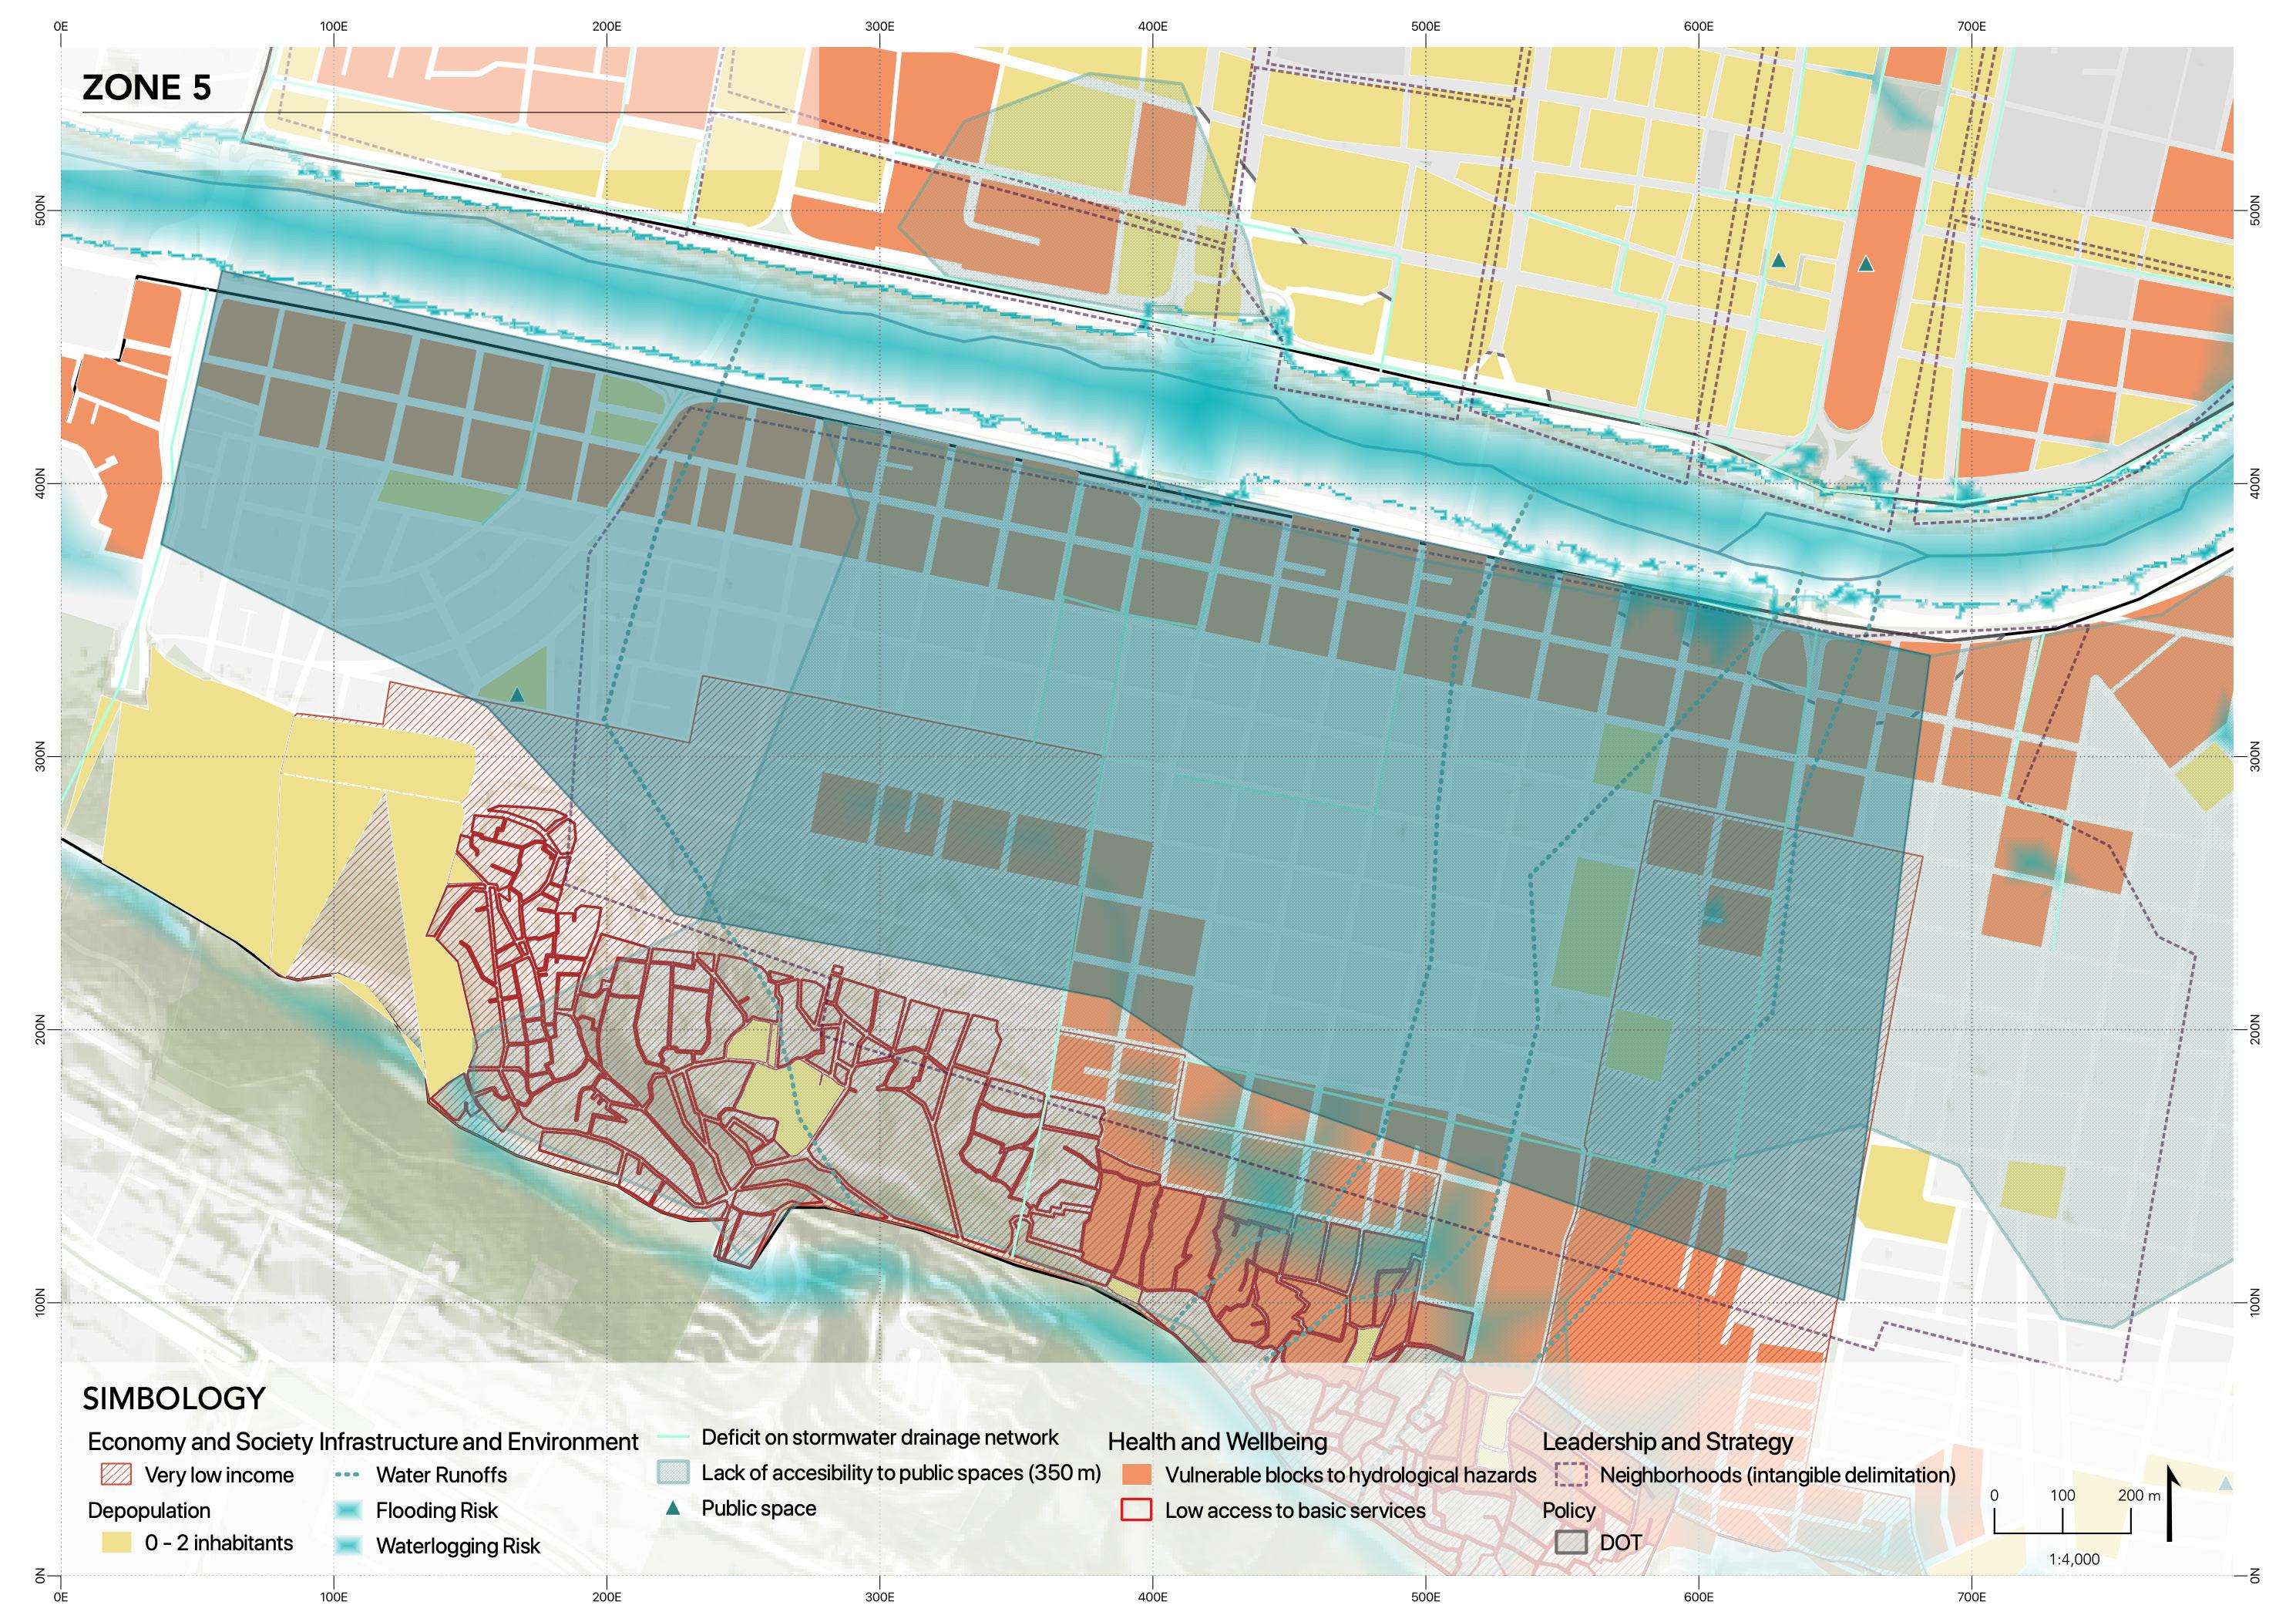
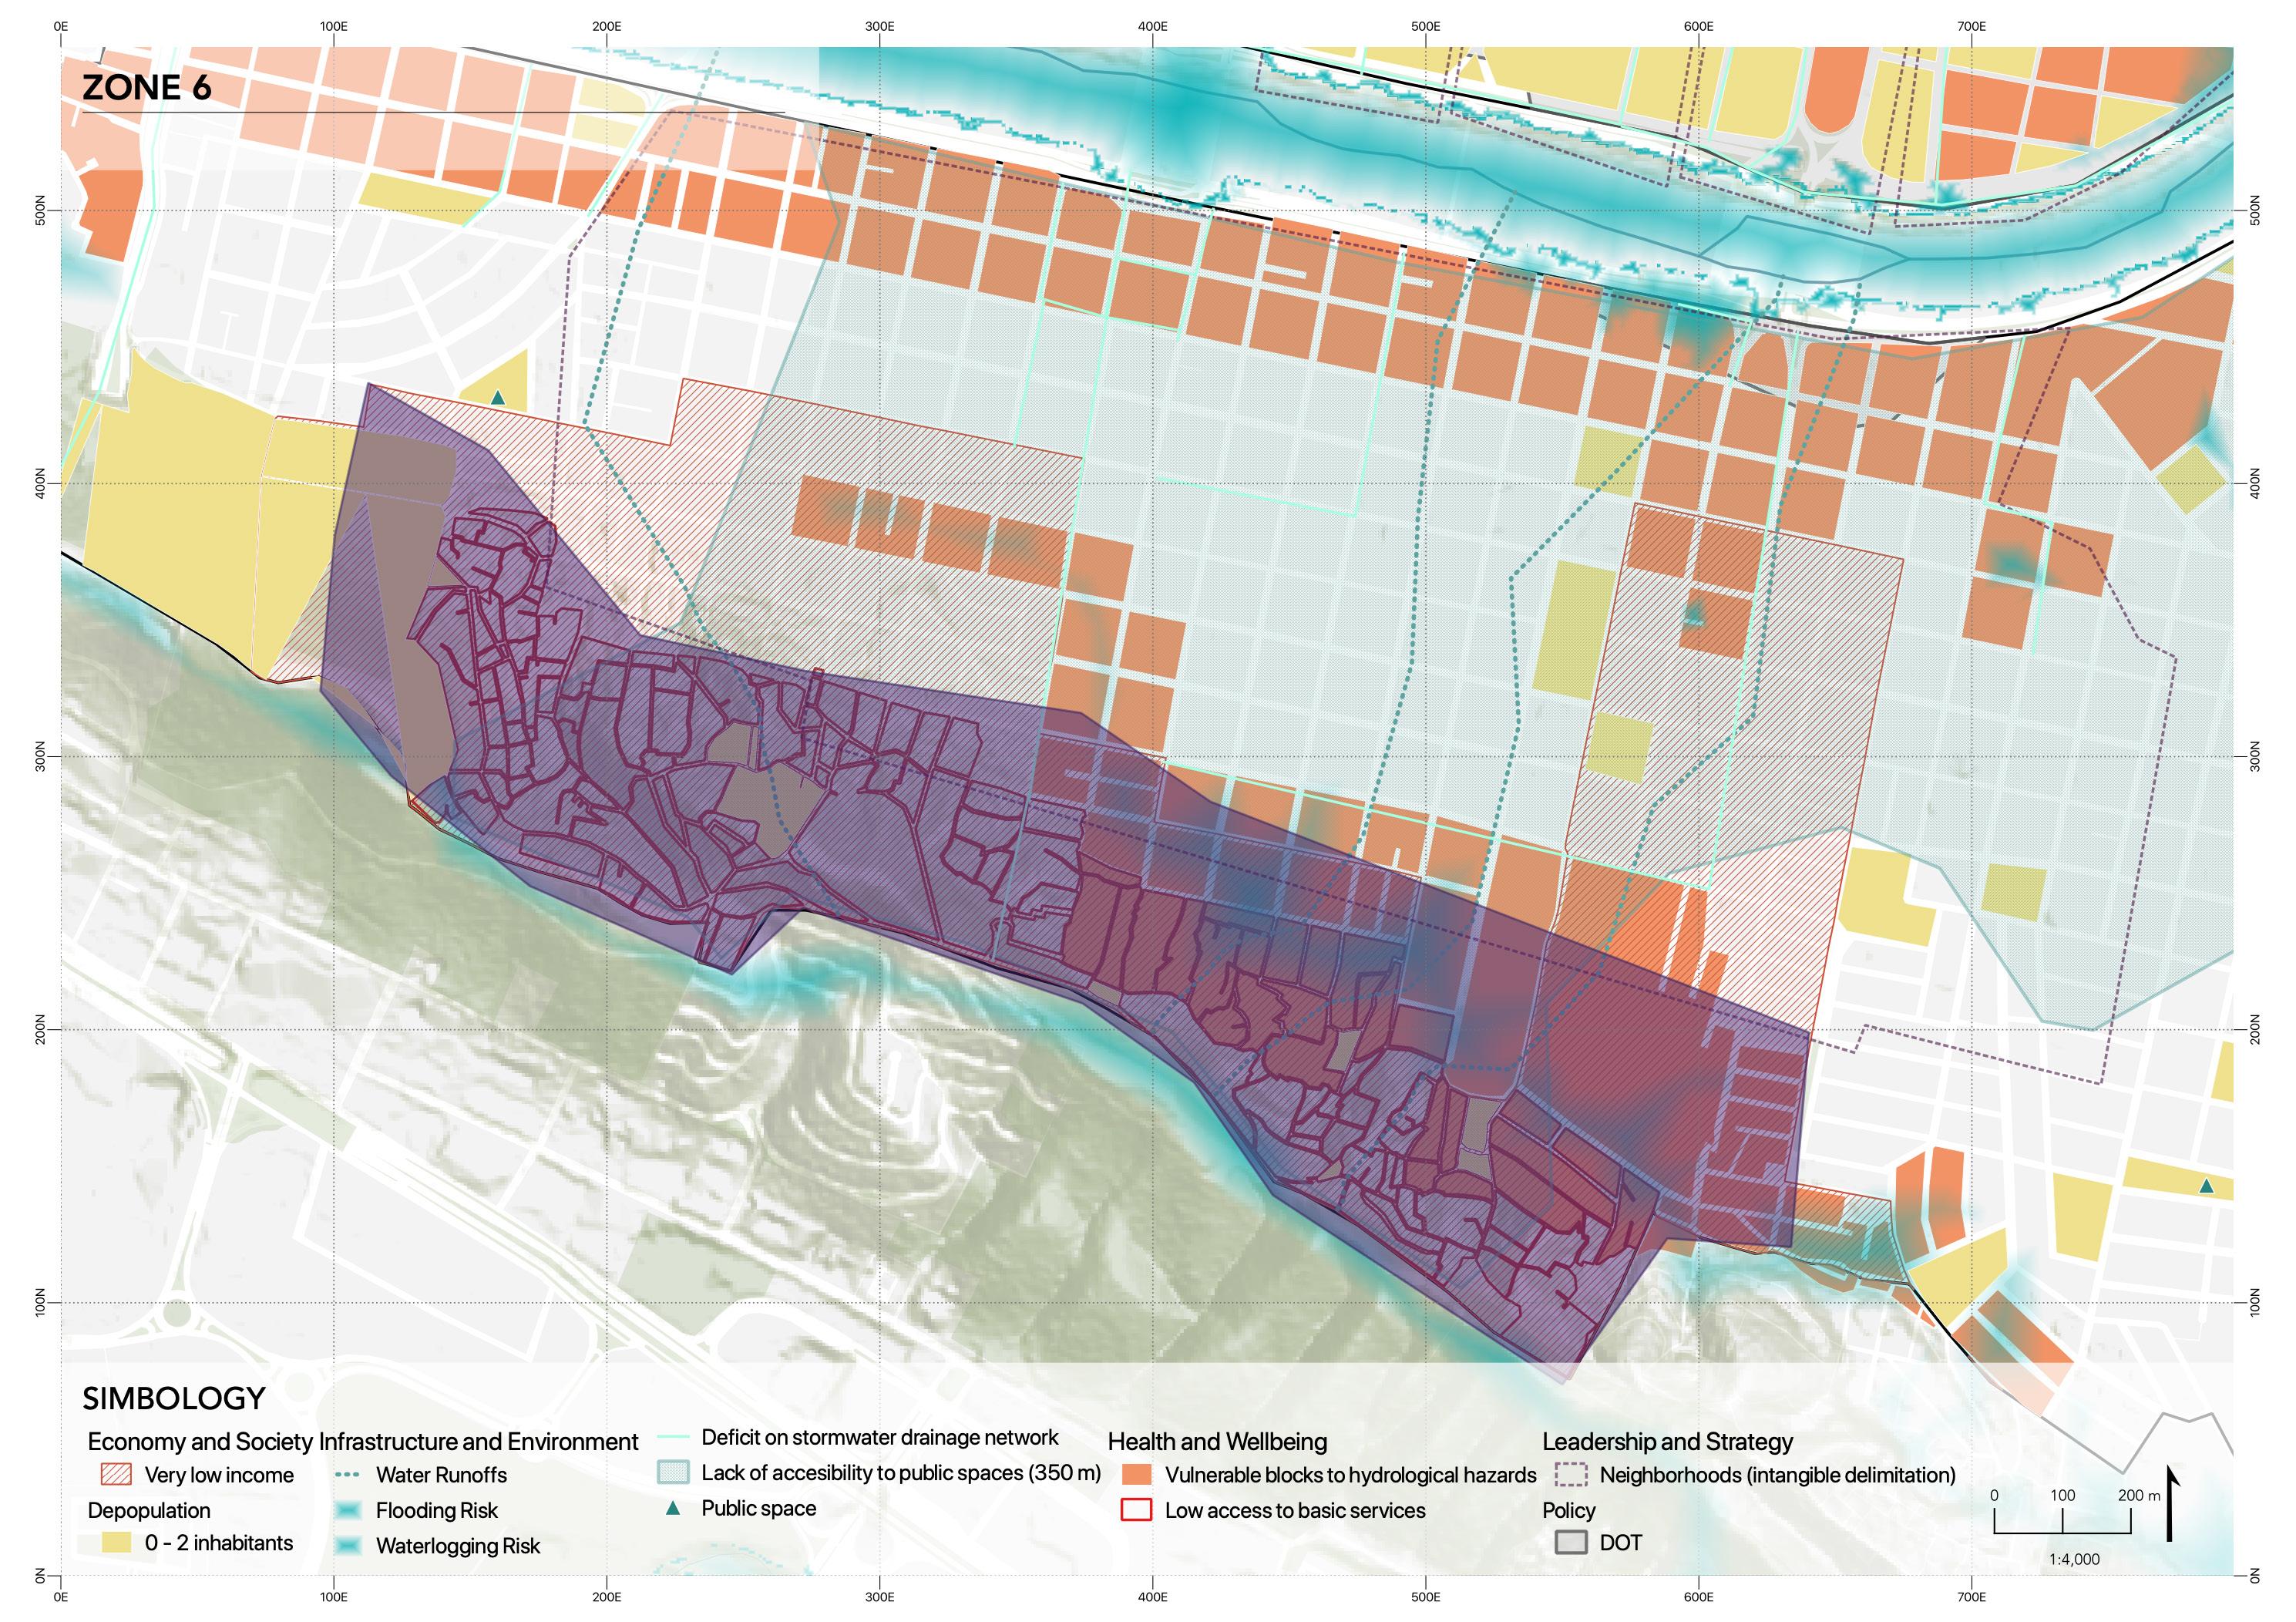
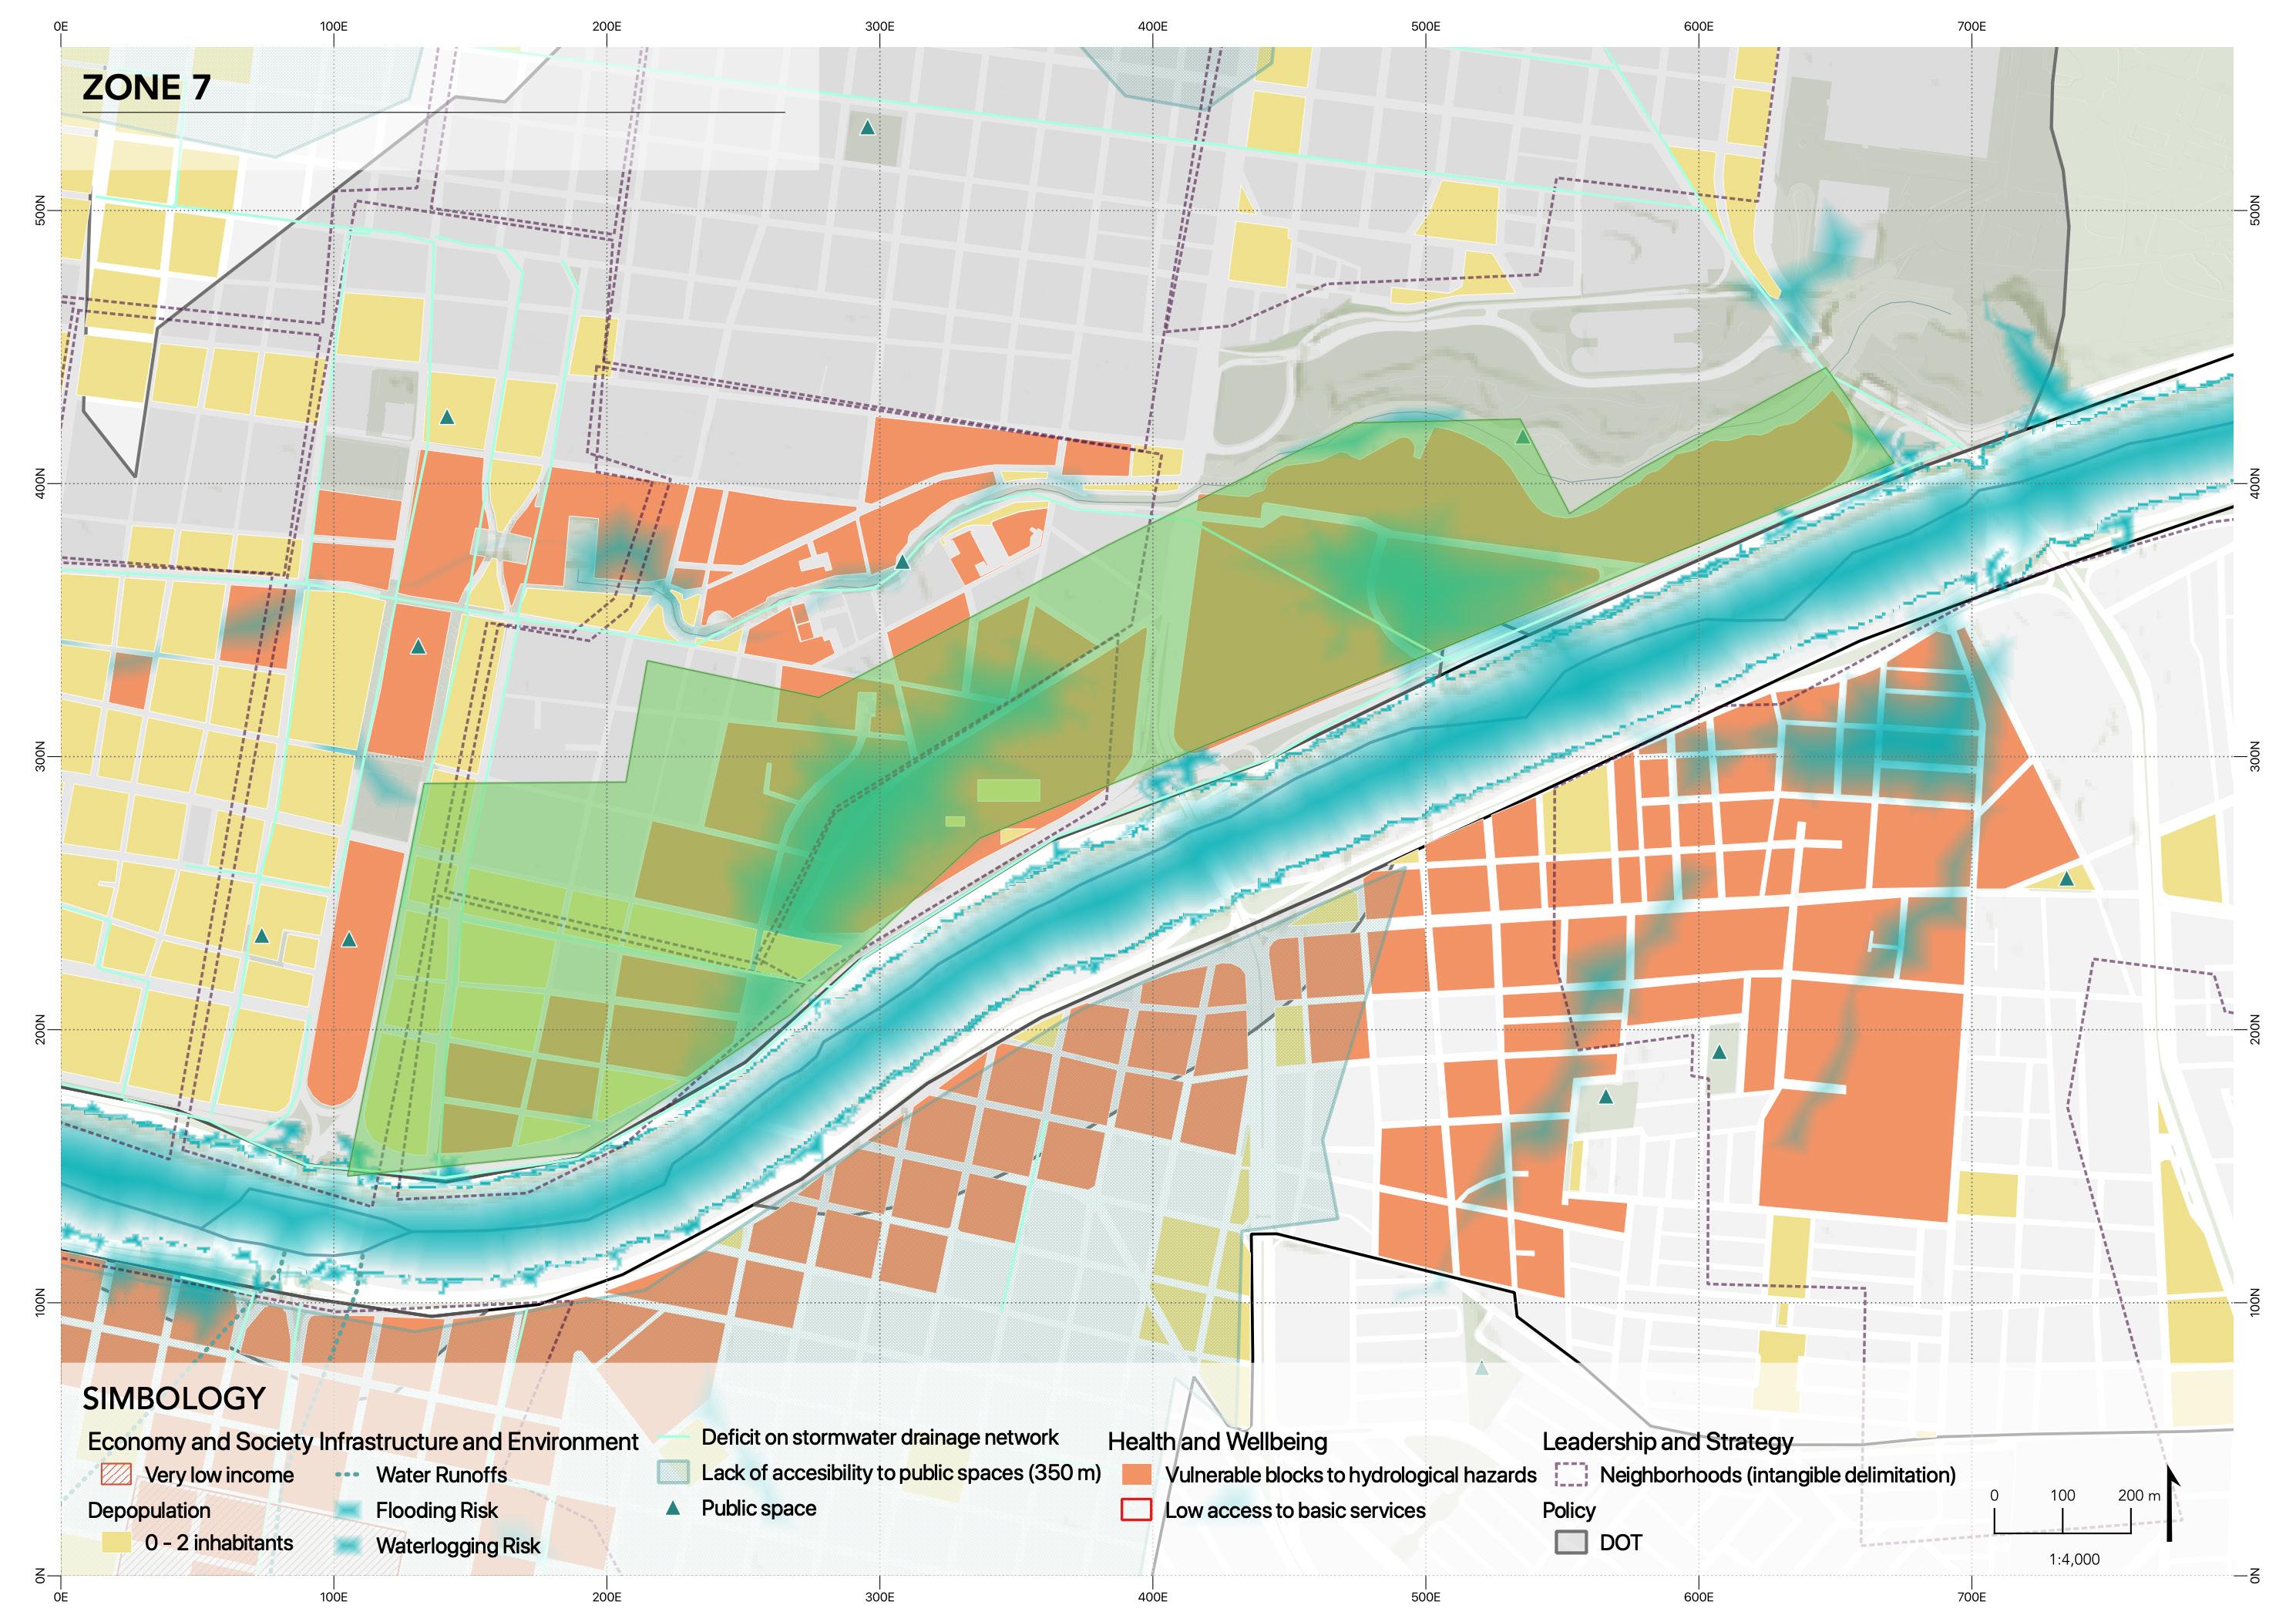
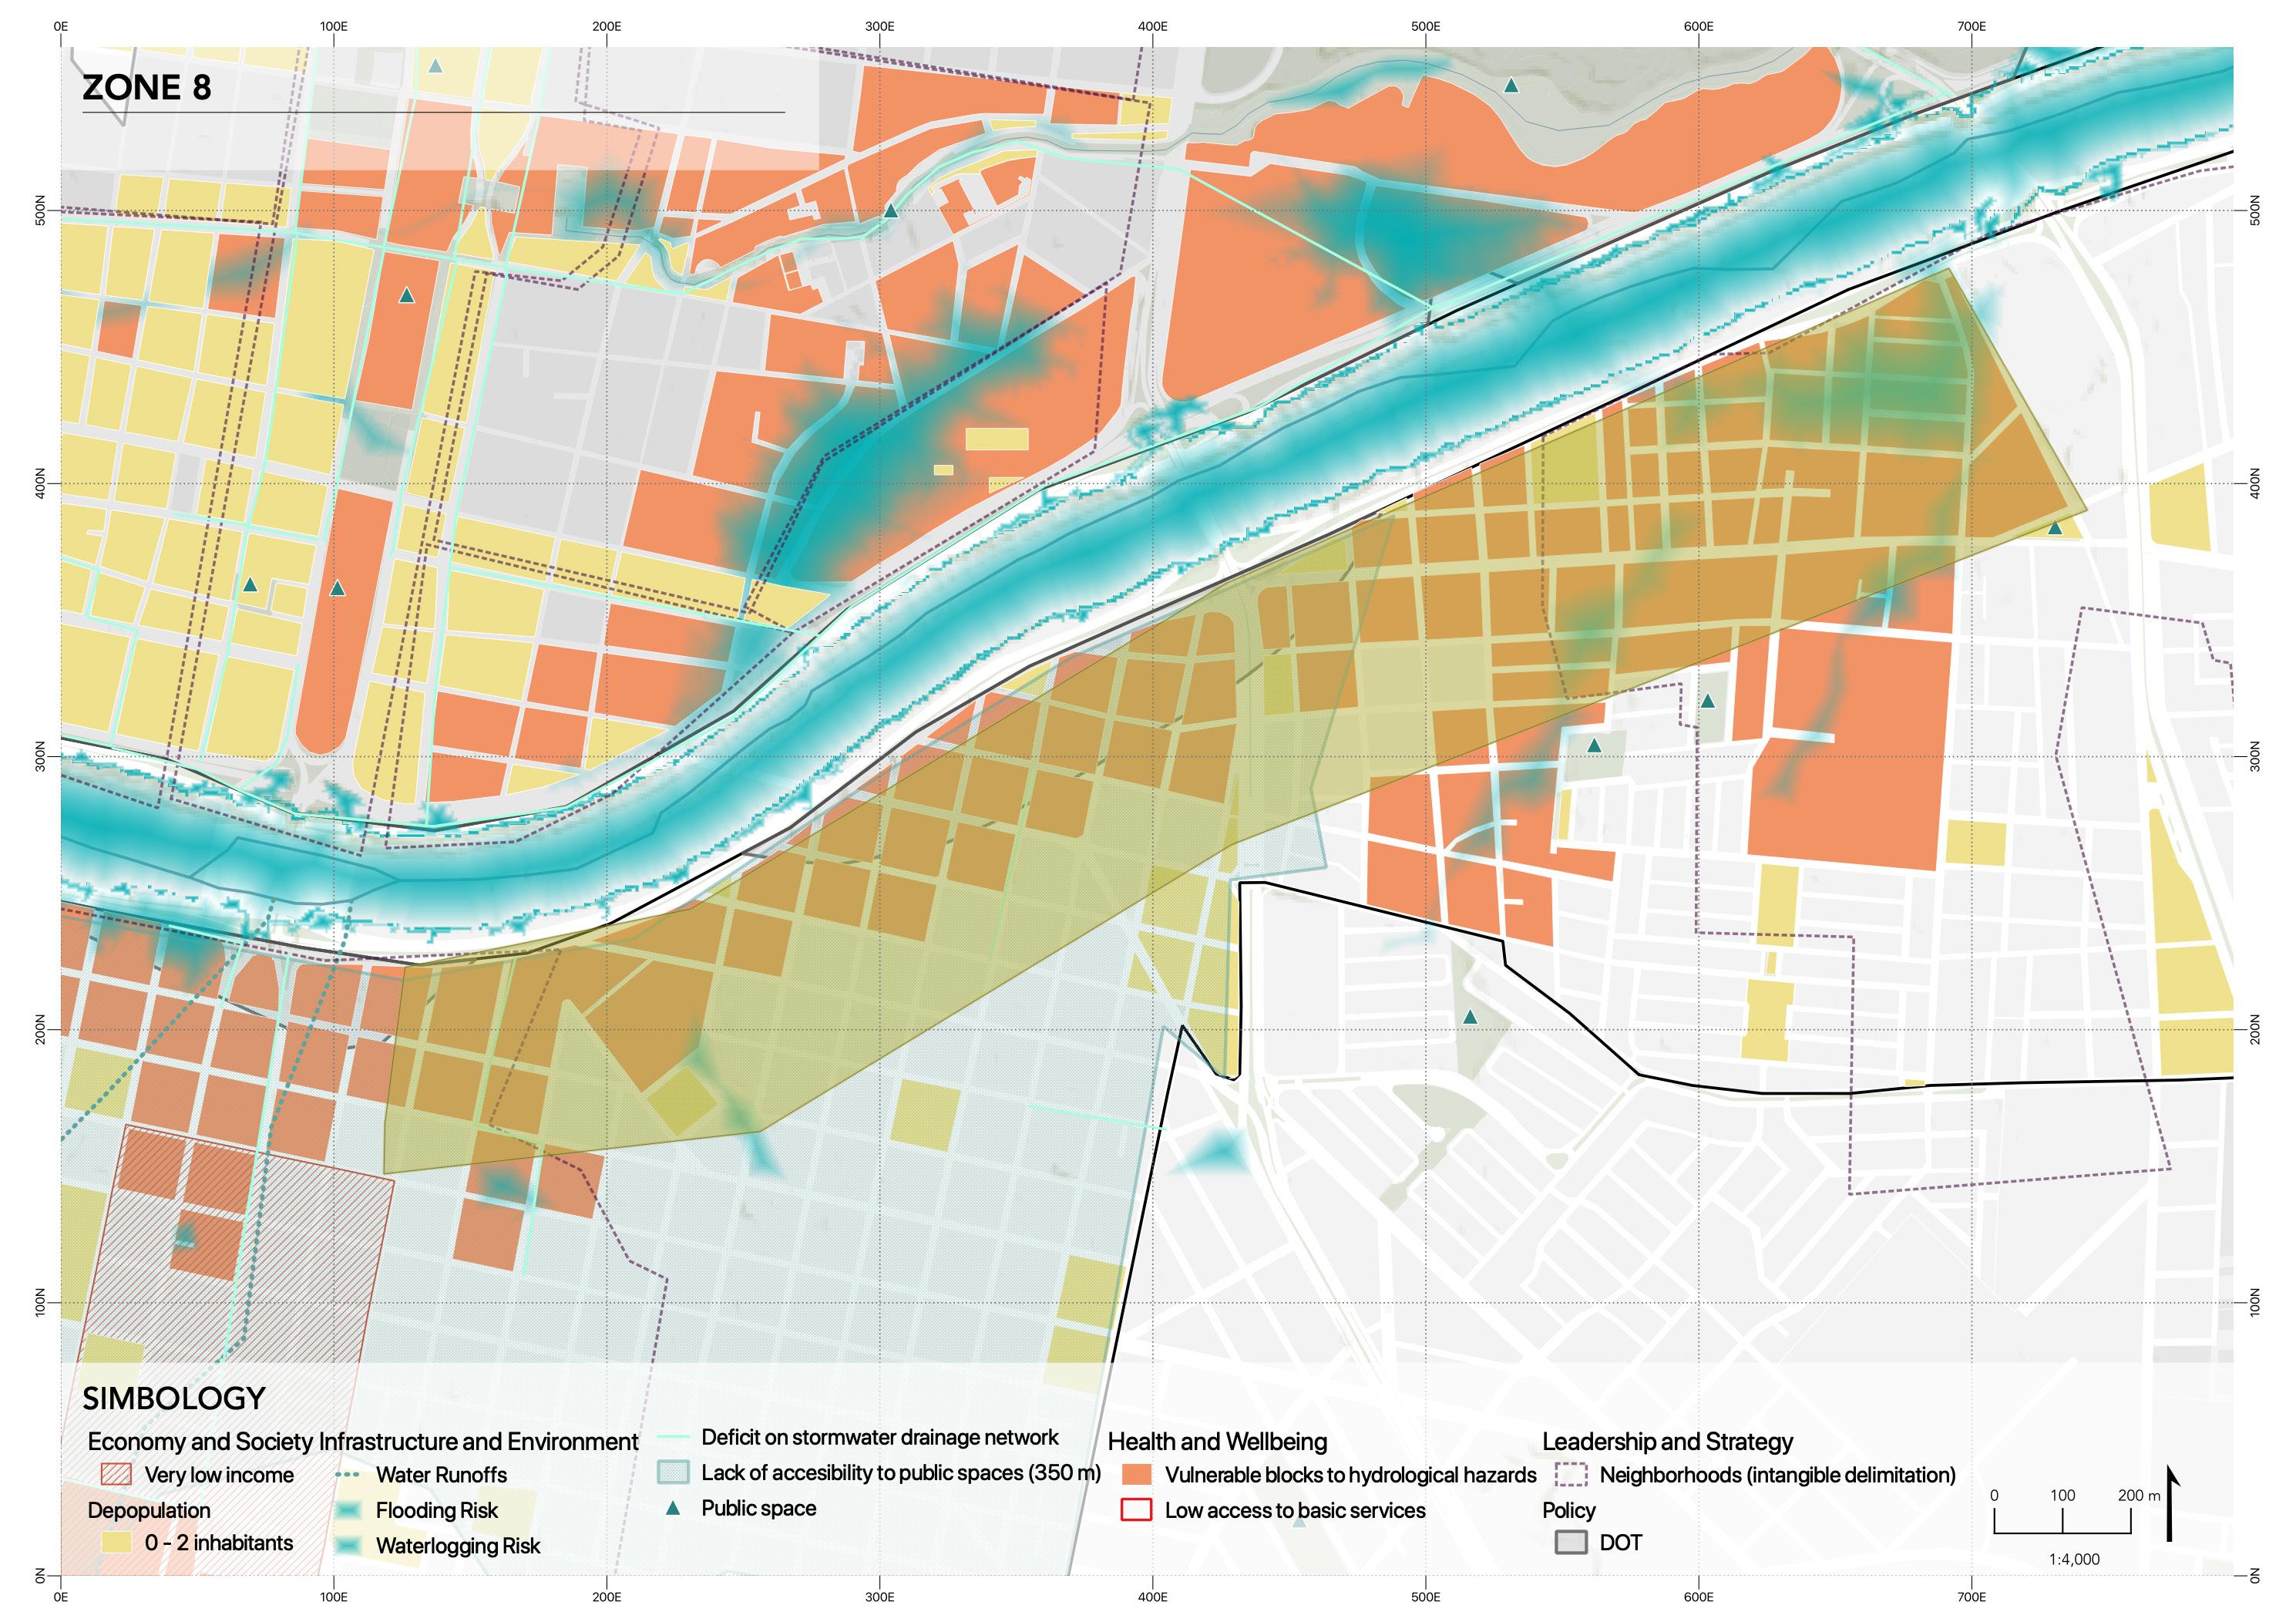
SPECIFIC zones OF INTERVENTION
110
Strategic zones of intervention
111
Elaborated by Paulina Ramírez Leal
112
113
114
115
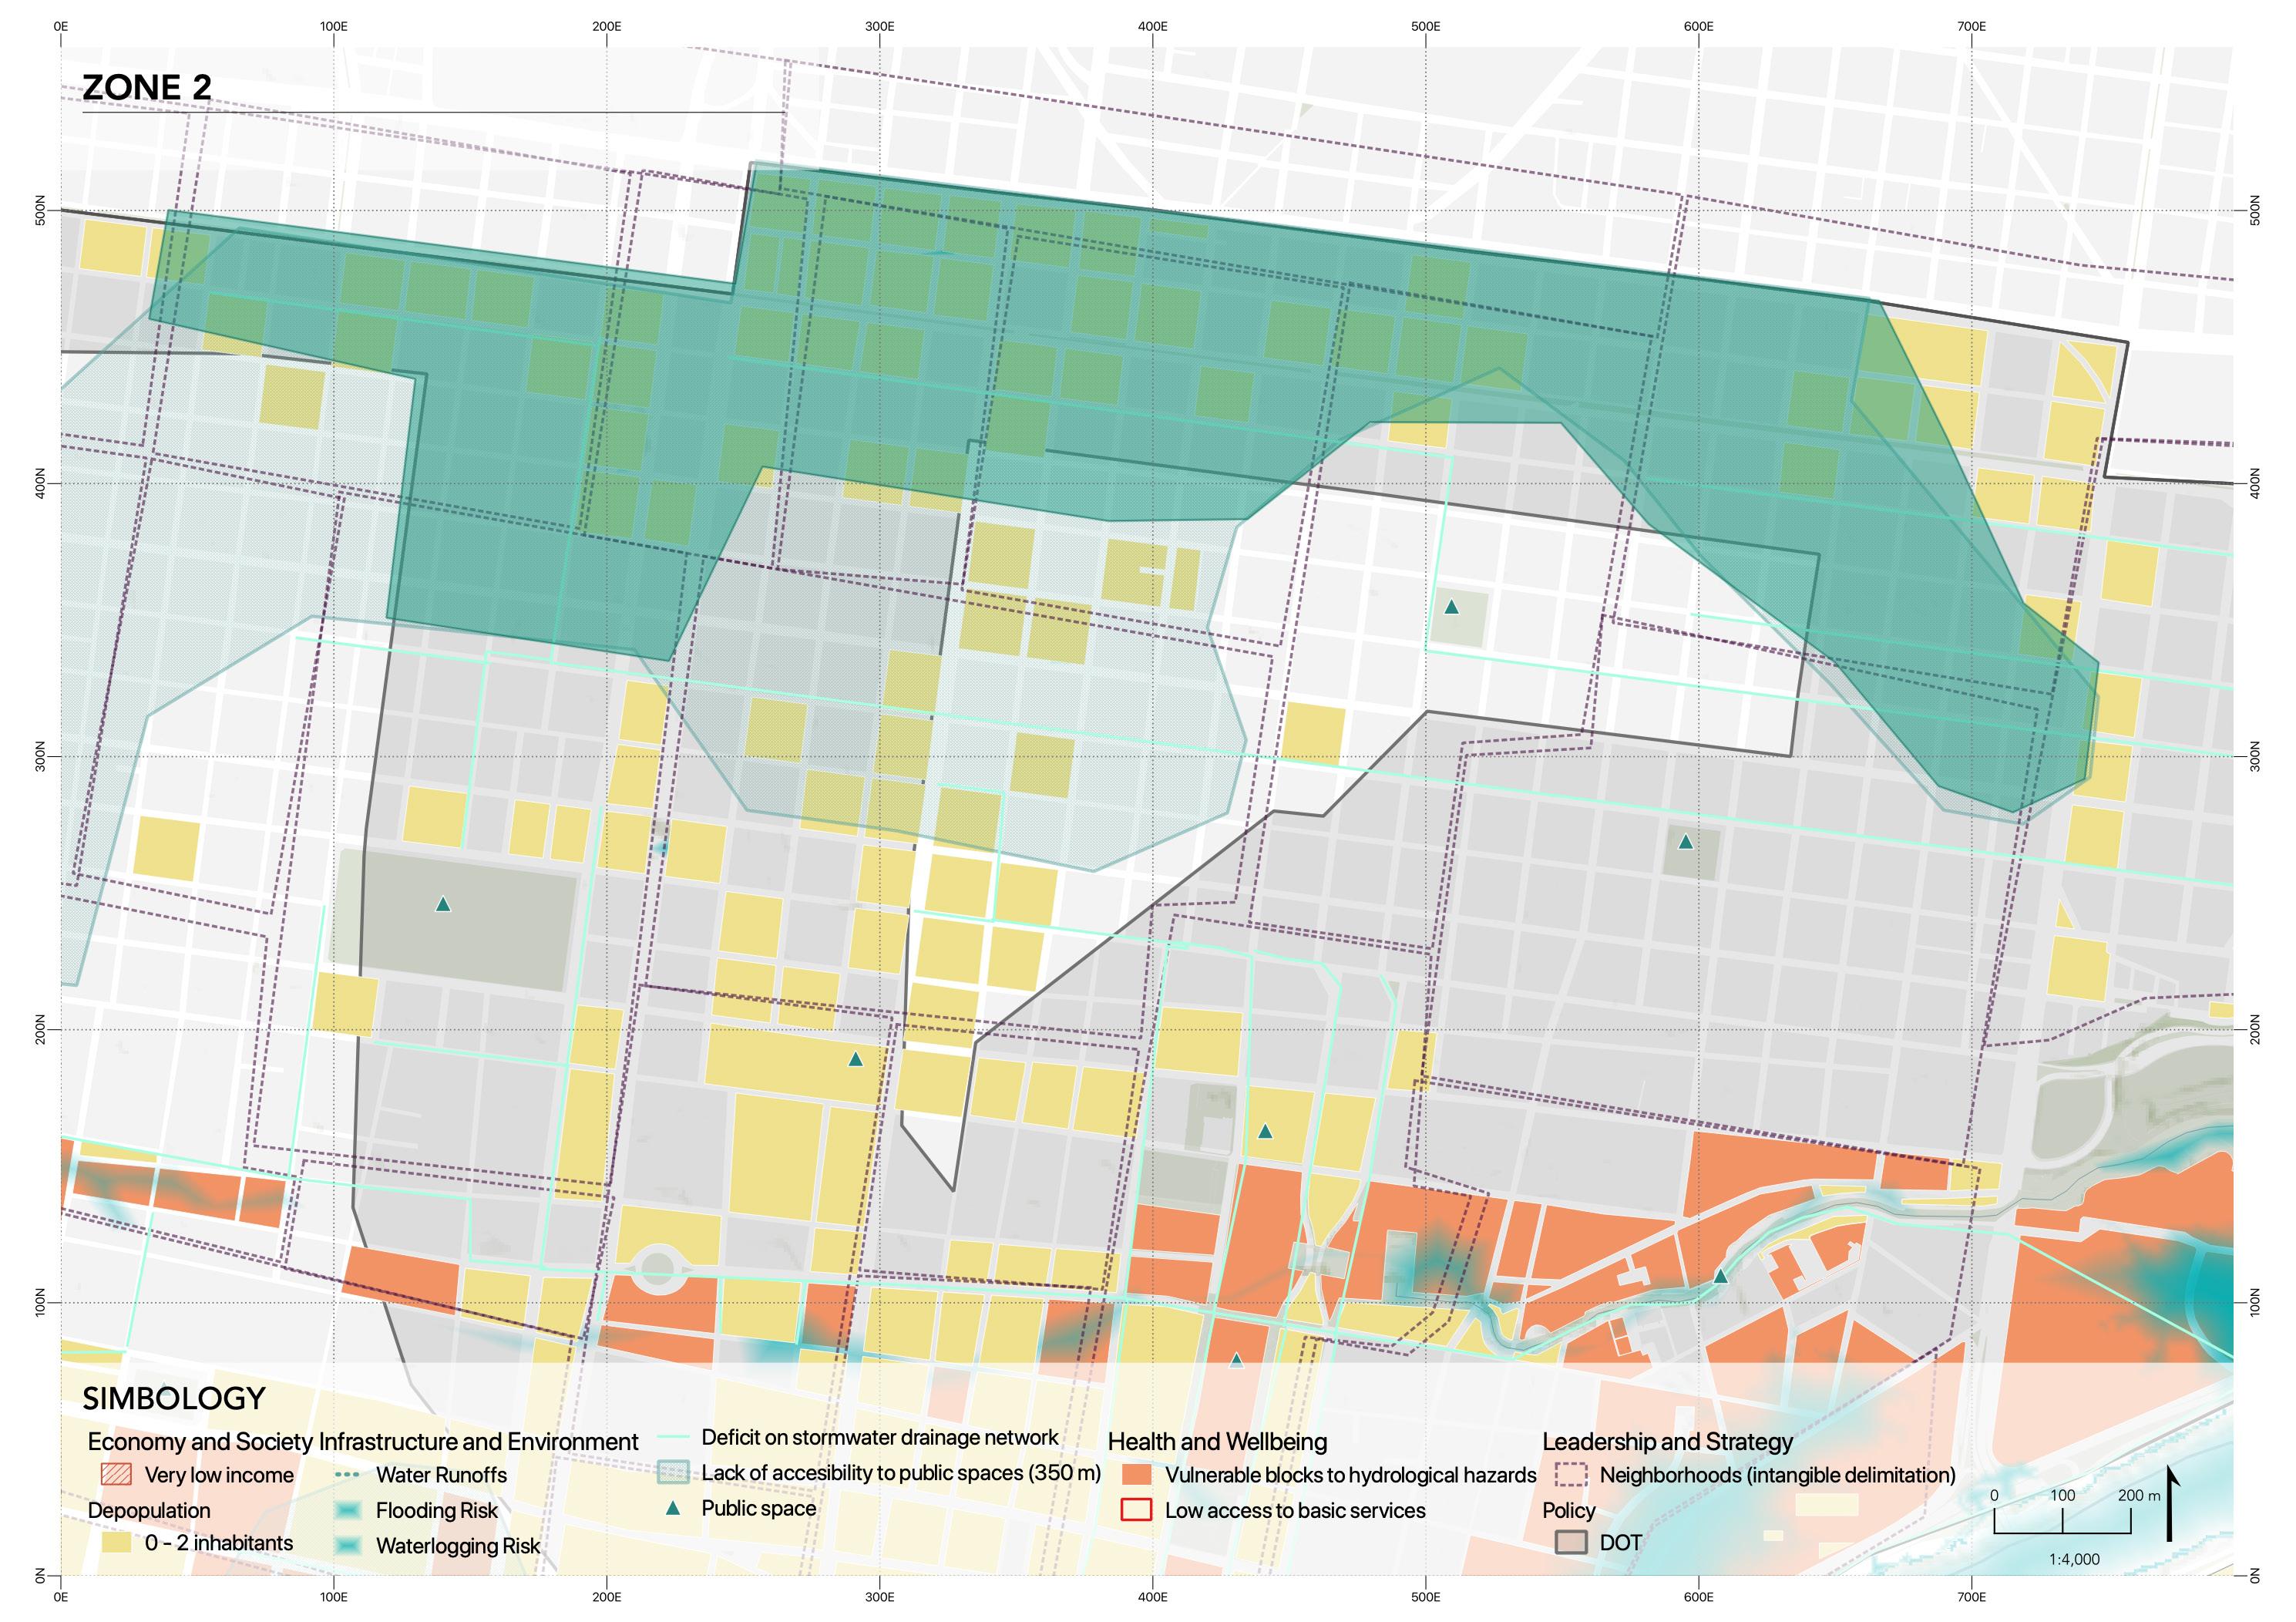
SPECIFIC ZONES OF INTERVENTION
116
117
STAGES OF INTERVENTION
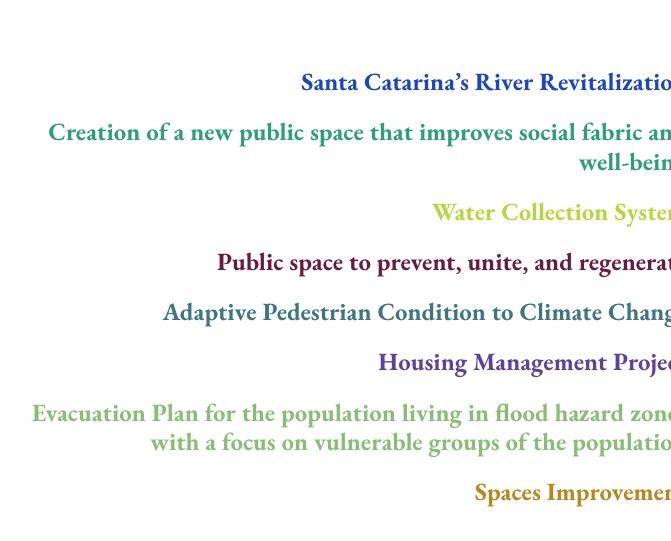
118
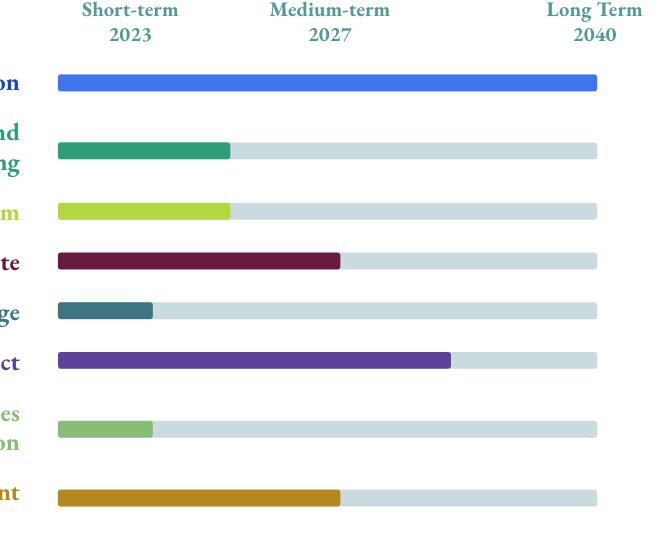
119
Conclusions
From the starting point set by this masterplan, the next part of the process includes the definition of the design guidelines and the development of the proposal based on said guidelines, additionally to the socialization of the masterplan.
The relevancy of the development and implementation of a master plan in Monterrey’s city center through the focus of resiliency is related to the history of impacts that shock events have had on Monterrey Metropolitan Area; the modern memory of these impacts include the floods of the city in 2010 caused by Huracán Alex and the insufficiency of water supply caused by droughts. As we know, the ability of a city to function efficiently in times of both adversity and prosperity is based on how resilient it is.
120
121
