ABOUT US
Ferrari-Lund is celebrating 35 years of business. We want to share with you our First Quarterly Report of 2023.

Serving our community with expertise, stability, and proven success has always been our top priority. We are proud to be a locally owned and operated brokerage that is consistently a topproducing firm in the Reno/Sparks area.

At Ferrari-Lund, we use a unique combination of industry-leading resources, personalized support, the most innovative technology available, and high-level marketing resources for our clients.
Coinciding with strong personalized client relationships and individually tailored solutions, our over 200 agents close deals that leave you with peace of mind and positive outcomes
Whether you are buying, selling, or investing, we are here for all your real estate needs. Our goal remains to provide you with a rewarding experience that is aligned with your specific goals, finances, and situation.
We hope you find this market information valuable
Ferrari-Lund Real Estate, 2023 Q2 1
MEDIAN SALES PRICE, YEAR TO DATE, 2023
MEDIAN SALES PRICE, YEAR TO DATE, 2023
REPORTSAREBASEDONSINGLEFAMILYHOMESINTHERENO&SPARKSAREA.DATAPROVIDEDBYSNR@2023DOMUSANALYTICSASOFTHE7THOFAPRIL2023.


Q2, 2022 Q2, 2023
Market Summary New Listings Sold Listings Median List Price Median Sold Price Days to Contract Active Inventory Q2, 2022 2,359 1,462 $630,000 $605,000 8 1,732 Q2, 2022 v. Q2 2023 Q2, 2023 1,543 1,207 $625,000 $556,492 14 1,289 % Change -34.59% -17 44% -0.79% -8 02% 75% -25.58%
RENO / SPARKS COMBINED
2 Ferrari-Lund Real Estate, 2023 Q2 Jan Feb Mar Apr May Jun $750,000 $500,000 $250,000 $0 $595,000 $540,000 $615,000 $554,475 $600,000 $575,000 $528,000 $575,000 $512,000 $557,000 $510,000 $565,000 $625,000 $375,000 $125,000
75%
-17.44%
REPORTSAREBASEDONSINGLEFAMILYHOMESINTHERENO&SPARKSAREA.DATAPROVIDEDBYSNR@2023DOMUSANALYTICSASOFTHE7THOFAPRIL2023.
Market Summary New Listings Sold Listings Median List Price Median Sold Price Days to Contract Active Inventory Q1, 2023 1,001 909 $578,918 $520,000 32 1,130 Q1, 2023 v. Q2 2023 Q2, 2023 1,543 1,207 $625,000 $556,492 14 1,289 % Change 54.15% 32 78% 7.96% 7 02% -56.25% 14.07% Ferrari-Lund Real Estate, 2023 Q2 3 ACTIVE
Q2, 2022 Q2, 2023 AVERAGE DAYS TO CONTRACT NUMBER OF HOMES SOLD -25.58%
RENO / SPARKS COMBINED
INVENTORY
617 591 735 647 1,178 721 603 335 564 299 772 353 2,000 1,750 1,500 1,250 1,000 750 500 Jan Feb Mar Apr May Jun Q2, 2022 8 Q2, 2023 14 Q2, 2022 1,462 Q2, 2023 1,207
June 2023, Reno (including North Valleys) had 320 closed sales of existing single family homes; a decrease of 3.6 percent from last year and a 19 percent increase from May 2023.
The median sales price in Reno for an existing single-family residence in June 2023 was $622,000; an increase of 9.1 percent from last month and a decrease of 2 percent from 2022. All sales numbers are for existing “stick built, single-family dwellings” only and do not include condominiums, townhomes, manufactured, modular, or newly constructed homes. The existing condominium/townhome median sales price for June 2023 in Reno was $332,500; an decrease of 3.9 percent from the prior year.
SINGLE-FAMILY HOMES IN RENO
MEDIAN SALES PRICE
Jan Feb Mar Apr May Jun $750,000 $500,000 $250,000 $0 REPORTSAREBASEDONSINGLEFAMILYHOMESINTHERENO&SPARKSAREA.DATAPROVIDEDBYSNR@2023DOMUSANALYTICSASOFTHE7THOFAPRIL2023.
RENO MARKET SUMMARY
4 Ferrari-Lund Real Estate, 2023 Q2 376 New Listings June, 2023 320 Sold Listings June, 2023 15 Days to Contract June, 2023
$595,000 $540,000 $615,000 $554,475 $600,000 $575,000 $528,000 $575,000 $512,000 $557,000 $510,000 $565,000 $625,000 $375,000 $125,000


Ferrari-Lund Real Estate, 2023 Q2 5 Market Summary New Listings Sold Listings Median List Price Median Sold Price Days to Contract Active Inventory Q1, 2023 650 603 $585,000 $540,000 31 762 Q1, 2023 v. Q2 2023 Q2, 2023 1,095 837 $650,000 $579,000 13 902 % Change 68.46% 38 81% 11.11% 7.22% -58 66% 18.37% Market Summary New Listings Sold Listings Median List Price Median Sold Price Days to Contract Active Inventory Q2, 2022 1,673 1,042 $650,000 $630,000 8 1,250 Q2, 2022 v. Q2 2023 Q2, 2023 1,095 837 $650,000 $579,000 13 902 % Change -34 55% -19.67% 0% -8 10% 62.50% -27 84%
REPORTSAREBASEDONSINGLEFAMILYHOMESINTHERENO&SPARKSAREA.DATAPROVIDEDBYSNR@2023DOMUSANALYTICSASOFTHE7THOFAPRIL2023. RENO
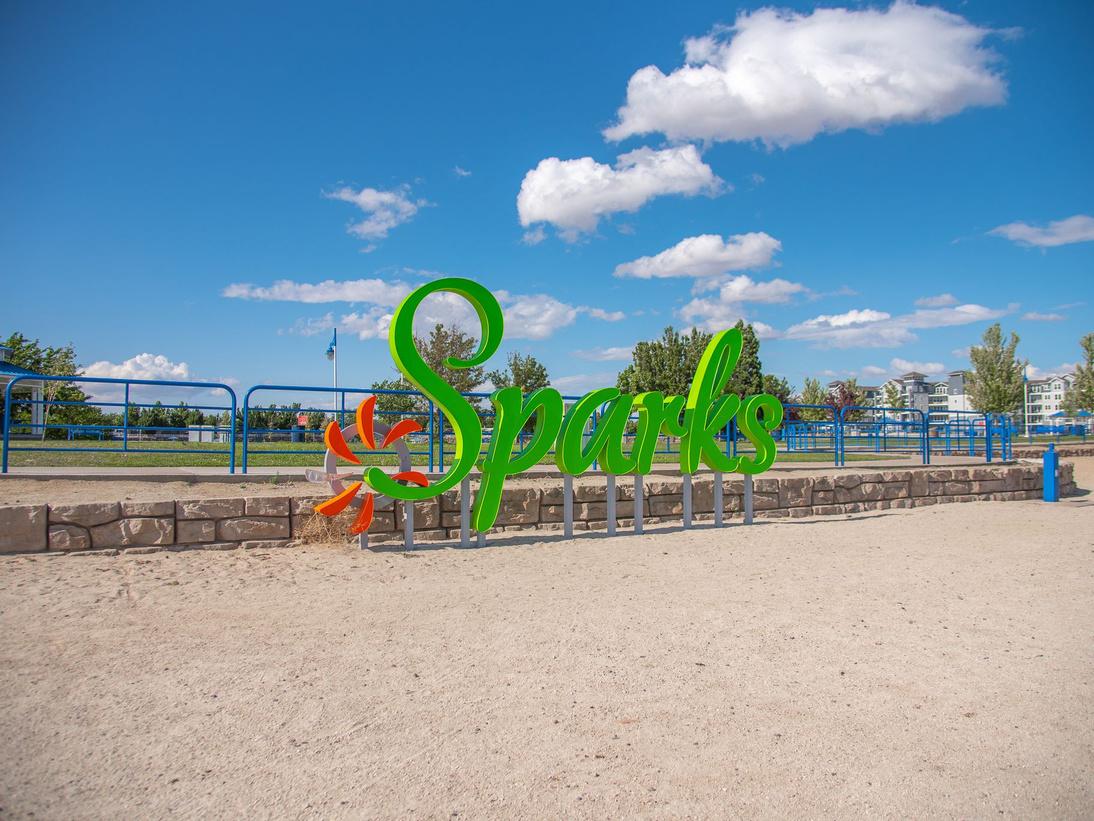
Sparks (including Spanish Springs) had 118 closed sales of existing single-family homes in June 2023; a decrease of 1.7 percent from last year and an decrease of 19.2 percent from the previous month.
The Sparks median sales price for an existing single-family residence in June 2023 was $532,000; a decrease of 2.4 percent from last year and an increase of 0.9 percent from last month. All sales numbers are for existing “stick built, single-family dwellings” only and do not include condominiums, townhomes, manufactured, modular, or newly constructed homes. The existing condominium/townhome median sales price for June 2023 in Sparks was $397,495; a increase of 27 percent from last year.
SINGLE-FAMILY HOMES IN SPARKS
SALES PRICE
REPORTSAREBASEDONSINGLEFAMILYHOMESINTHERENO&SPARKSAREA.DATAPROVIDEDBYSNR@2023DOMUSANALYTICSASOFTHE7THOFAPRIL2023.
SPARKS MARKET SUMMARY
6 Ferrari-Lund Real Estate, 2023 Q2 181 New Listings June, 2023 118 Sold Listings June, 2023 19 Days to Contract June, 2023
Jan Feb Mar Apr May Jun $600,000 $400,000 $200,000 $0
$550,000 $505,950 $570,000 $533,418 $510,000 538,000 502,500 553,000 $502,000 510,500 $497,475 $520,000 $500,000 $300,000 $100,000
MEDIAN
SPARKS
REPORTSAREBASEDONSINGLEFAMILYHOMESINTHERENO&SPARKSAREA.DATAPROVIDEDBYSNR@2023DOMUSANALYTICSASOFTHE7THOFAPRIL2023.
Ferrari-Lund Real Estate, 2023 Q2 7 Market Summary New Listings Sold Listings Median List Price Median Sold Price Days to Contract Active Inventory Q1, 2023 351 306 $565,950 $500,000 33 368 Q1, 2023 v. Q2 2023 Q2, 2023 476 387 $577,000 $530,000 16 387 % Change 35.61% 26 47% 1.95% 6.00% -61 90% 5.16% Market Summary New Listings Sold Listings Median List Price Median Sold Price Days to Contract Active Inventory Q2, 2022 686 420 $589,950 $557,660 7 482 Q2, 2022 v. Q2 2023 Q2, 2023 476 387 $577,000 $530,000 16 387 % Change -30 61% -7.86% -2.20% -4 96% 128.57% -19 71%
All reports are based on single family homes in the Reno & Sparks area(s).

Dates between 1/1/2023 - 6/30/2023.
Data Provided by NNRMLS. 2023 Domus Analytics.

WWW.FERRARI-LUND.COM DAMONTE OFFICE 500 Damonte Ranch Pkwy. Suite 804 Reno, NV 89521 775-850-7033 SPARKS OFFICE 4990 Vista Blvd. Sparks, NV 89436 775-685-7788 LAKESIDE OFFICE 3700 Lakeside Drive Suite 100 Reno, NV 89509 775-688-4000