Q1 2023 Ferrari-Lund Real Estate


Ferrari-Lund Real Estate, 2022, Q1 2 CONTENTS • 3 ABOUT US • 4-5 RENO | SPARKS • 6-7 RENO • 8-9 SPARKS Jackie Mead 775-233-9353 License No. S.197806 Jackie@ferrari-lund.com JackieMead.ferrari-lund.com
ABOUT US
Ferrari-Lund is celebrating 35 years of business. We want to share with you our First Quarterly Report of 2023.

Serving our community with expertise, stability, and proven success has always been our top priority. We are proud to be a locally owned and operated brokerage that is consistently a topproducing firm in the Reno/Sparks area.

At Ferrari-Lund, we use a unique combination of industry-leading resources, personalized support, the most innovative technology available, and high-level marketing resources for our clients. Coinciding with strong personalized client relationships and individually tailored solutions, our over 200 agents close deals that leave you with peace of mind and positive outcomes.
Whether you are buying, selling, or investing, we are here for all your real estate needs. Our goal remains to provide you with a rewarding experience that is aligned with your specific goals, finances, and situation.
We hope you find this market information valuable.
2022, Q1, Ferrari-Lund Real Estate 3
MEDIAN SALES PRICE, YEAR TO DATE, 2023


Ferrari-Lund Real Estate, 2023, Q1 4 REPORTS ARE BASED ON SINGLE FAMILY HOMES IN THE RENO & SPARKS AREA. DATA PROVIDED BY SNR @2023 DOMUS ANALYTICS AS OF THE 7th OF APRIL 2023.
2022
Q1,
v. Q1, 2023
Q1, 2022 Q1, 2023 Market Summary New Listings Sold Listings Median List Price Median Sold Price Days to Contract Active Inventory Q1, 2022 1,479 1,274 $585,000 $535,000 5 699 % Change -32.30% -28.60% -1.00% -2.80% 540.00% 61.70% Q1, 2023 1001 909 $578,918 $520,000 32 1,130
RENO/SPARKS COMBINED


2023, Q1, Ferrari-Lund Real Estate 5 REPORTS ARE BASED ON SINGLE FAMILY HOMES IN THE RENO & SPARKS AREA. DATA PROVIDED BY SNR @2023 DOMUS ANALYTICS AS OF THE 7th OF APRIL 2023. Market Summary New Listings Sold Listings Median List Price Median Sold Price Days to Contract Active Inventory Q4, 2022 958 1,058 $573,475 $568,450 42 1,671 % Change 4.50% -14.10% 0.90% -8.50% -23.80% -32.40% Q1, 2023 1001 909 $578,918 $520,000 32 1,130 Q4, 2022 v. Q1, 2023
Q1, 2023 32 Q1, 2023 32 Q1,2022 5 Q1,2022 5 Q1, 2023 909 Q1, 2023 909 Q1, 2022 1,274 Q1, 2022 1,274 AVERAGE DAYS TO CONTRACT NUMBER OF HOMES SOLD 540.0% -28.6% 0 100 200 300 400 500 600 700 800 Mar. Feb. Jan. ACTIVE INVENTORY Q1, 2022 Q1, 2023 RENO/SPARKS COMBINED
61.40%
March 2023, Reno (including North Valleys) had 255 closed sales of existing singlefamily homes; a decrease of 25.7 percent from last year and a 38.6 percent increase from February 2023.
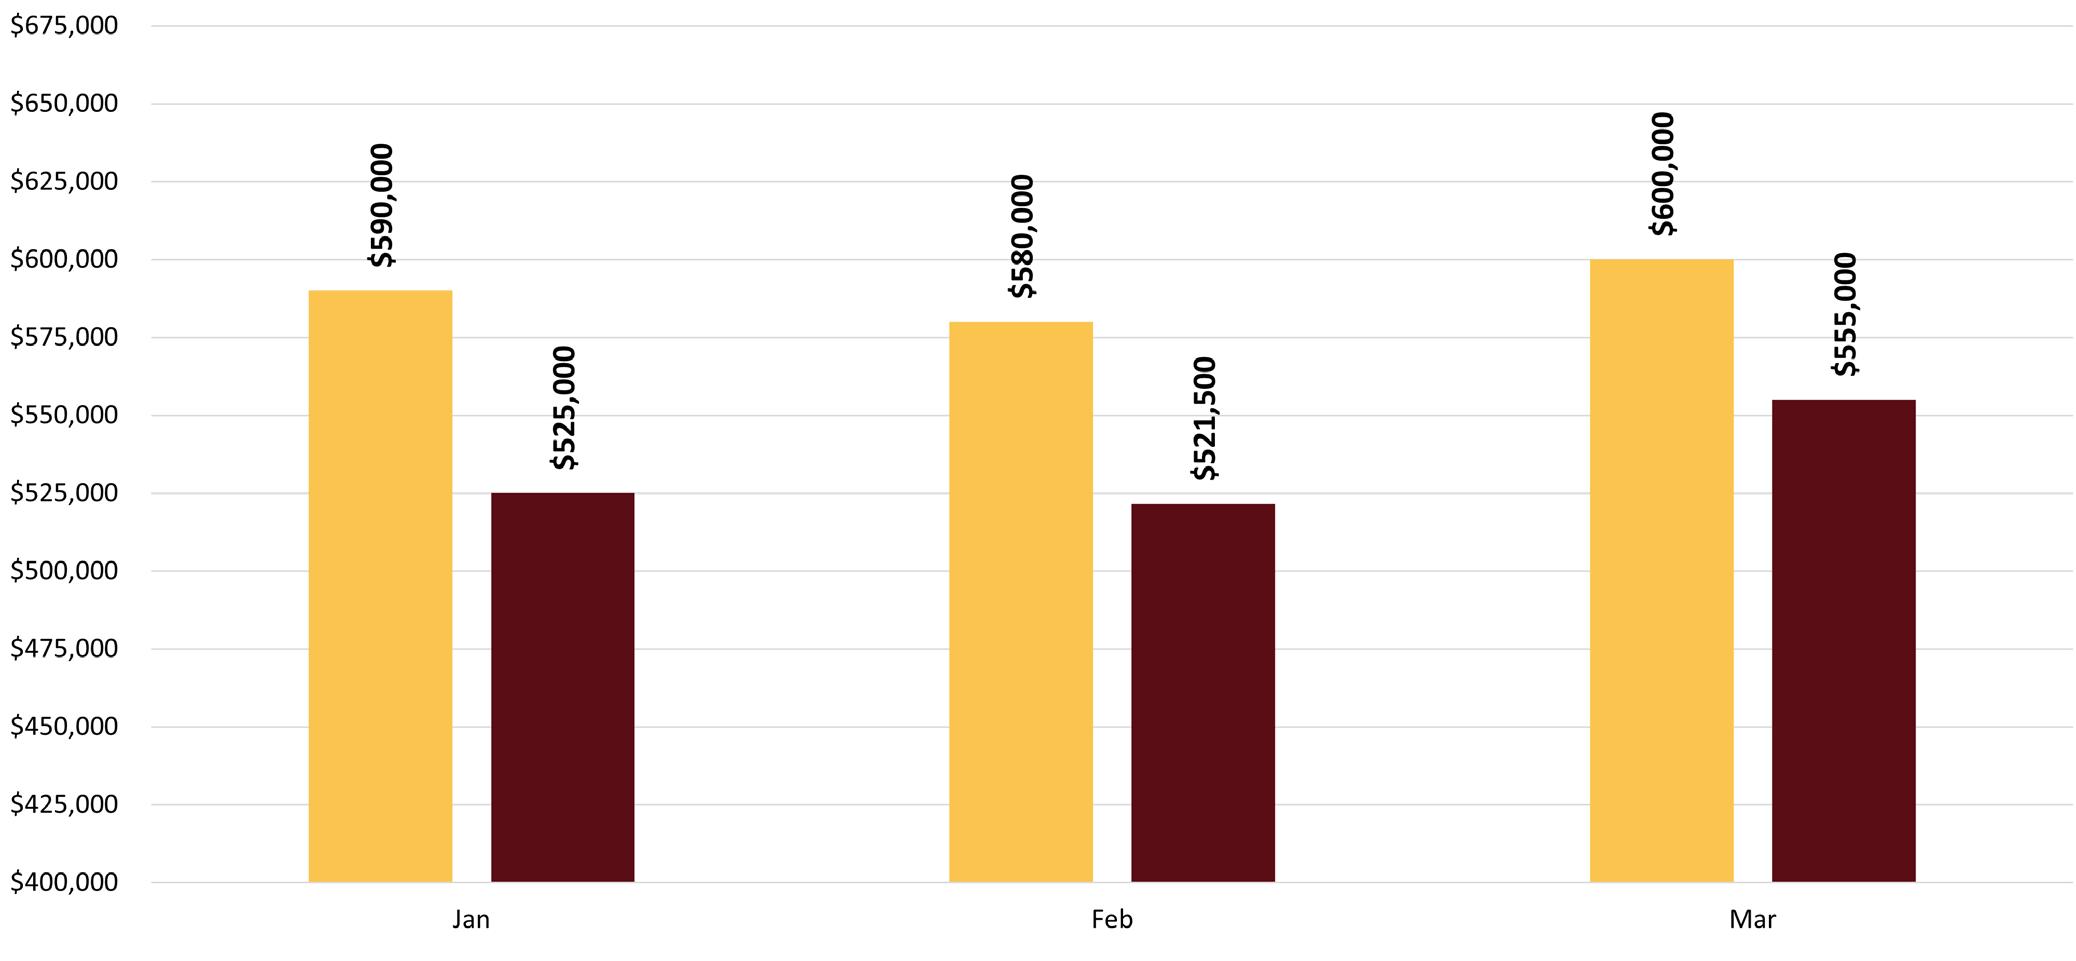
The median sales price in Reno for an existing single-family residence in March 2023 was $555,000; an increase of 6.4 percent from last month and a decrease of 7.5 percent from 2022. All sales numbers are for existing “stick built, single-family dwellings” only and do not include condominiums, townhomes, manufactured, modular, or newly constructed homes. The existing condominium/townhome median sales price for March 2023 in Reno was $321,000; an increase of 2.7 percent from the prior year.
MEDIAN SALES PRICE
Ferrari-Lund Real Estate, 2023, Q1 6 REPORTS ARE BASED ON SINGLE FAMILY HOMES IN THE RENO & SPARKS AREA. DATA PROVIDED BY SNR @2023 DOMUS ANALYTICS AS OF THE 7th OF APRIL 2023.
R eno M a R ket S u MM a R y
278 255 15
2022 2023 New Listings Total Sold Days to contract March, 2023 March, 2023 March, 2023

RENO Market Summary New Listings Sold Listings Median List Price Median Sold Price Days to Contract Active Inventory % Change -1.80% -16.80% 0.10% -1.80% -26.20% -34.70% Q4, 2022 662 725 $584,441 $550,000 42 1,167 Q1, 2023 650 603 $585,000 $540,000 31 762 Market Summary New Listings Sold Listings Median List Price Median Sold Price Days to Contract Active Inventory % Change -37.00% -31.60% -2.50% -8.40% 416.70% 44.60% Q1, 2022 1,032 882 $600,000 $589,500 6 527 Q1, 2023 650 603 $585,000 $540,000 31 762 Q4, 2022 v. Q1, 2023 Q1, 2022 v. Q1, 2023
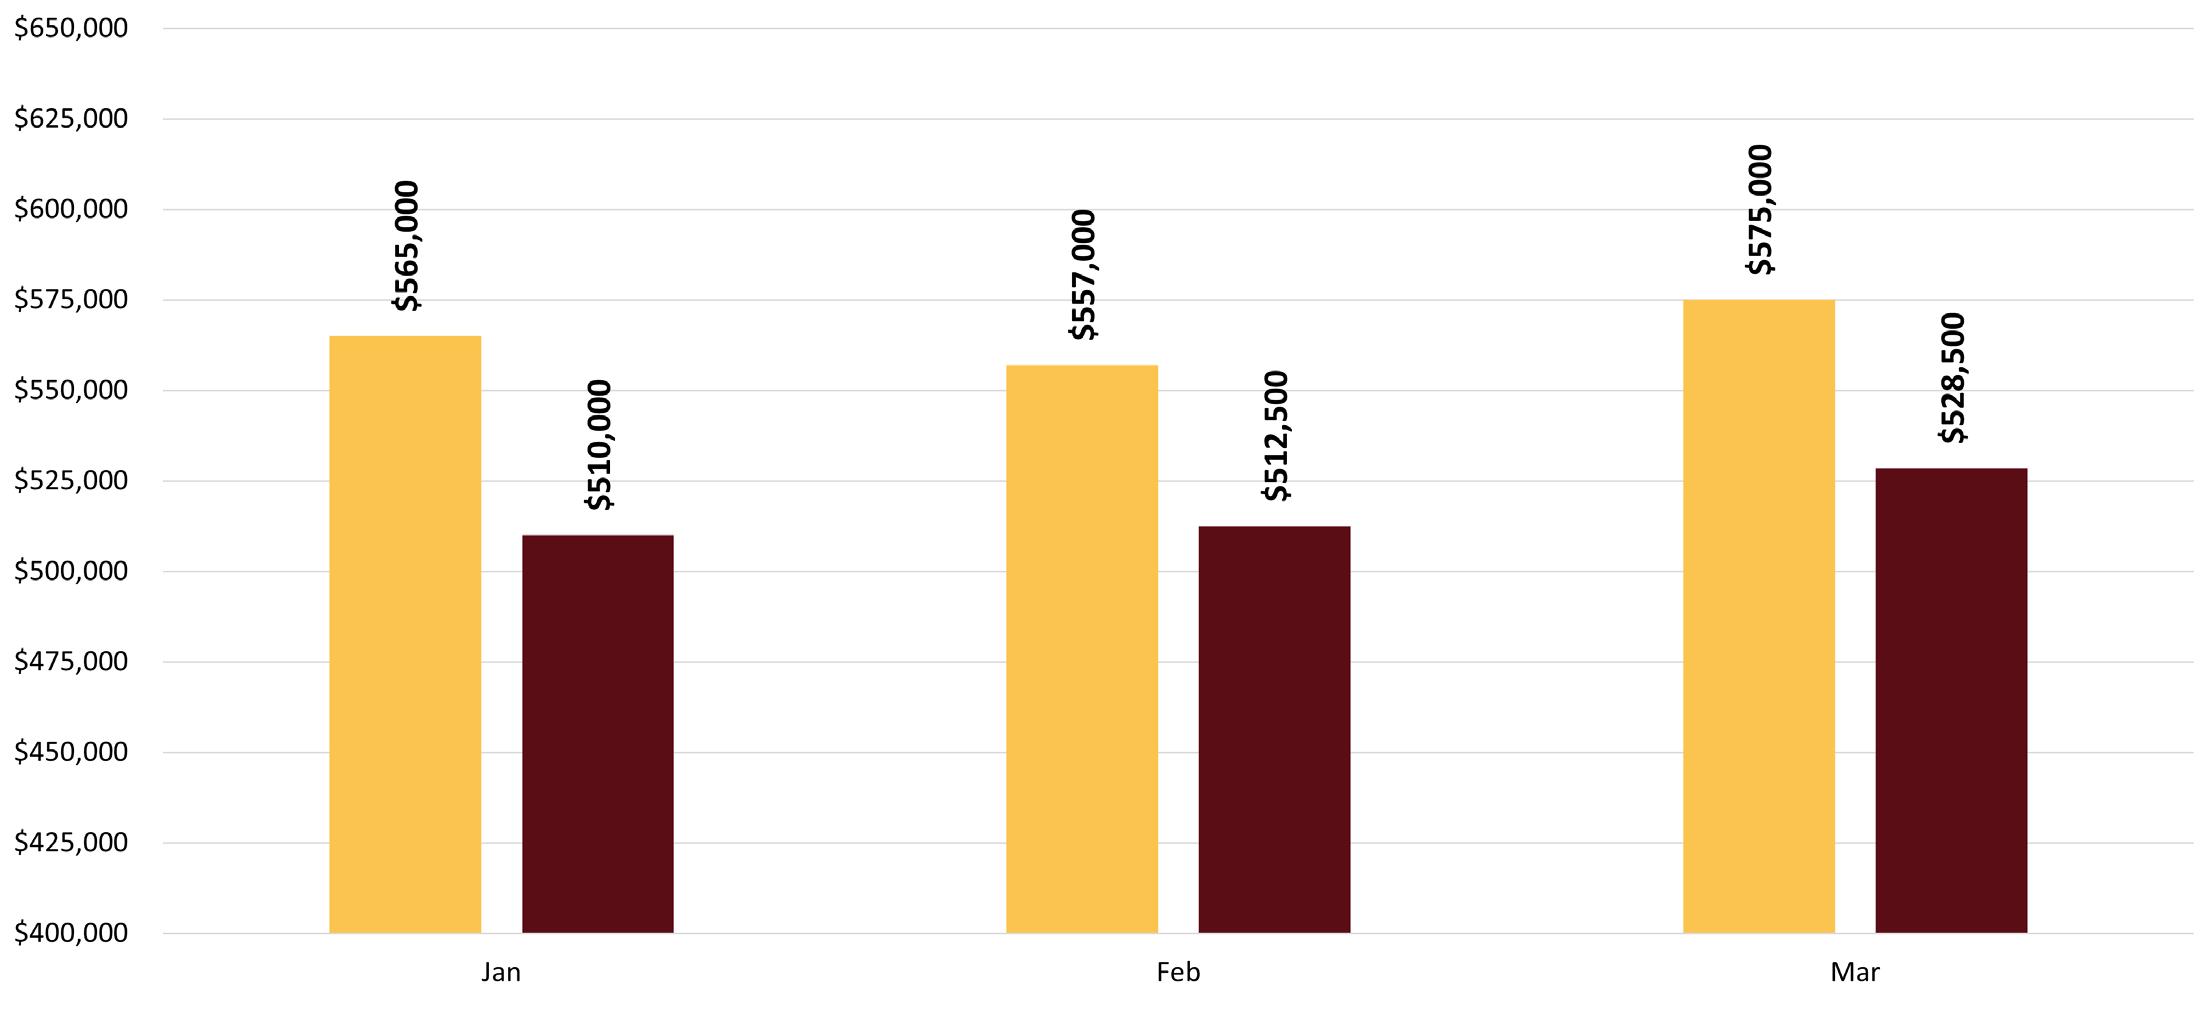
Sparks (including Spanish Springs) had 144 closed sales of existing single-family homes in March 2023; a decrease of 7.1 percent from last year and an increase of 60 percent from the previous month.
The Sparks median sales price for an existing single-family residence in March 2023 was $502,500; a decrease of 9.1 percent from last year and an increase of 0.1 percent from last month. All sales numbers are for existing “stick built, single-family dwellings” only and do not include condominiums, townhomes, manufactured, modular, or newly constructed homes. The existing condominium/townhome median sales price for March 2023 in Sparks was $295,000; a decrease of 0.8 percent from last year.
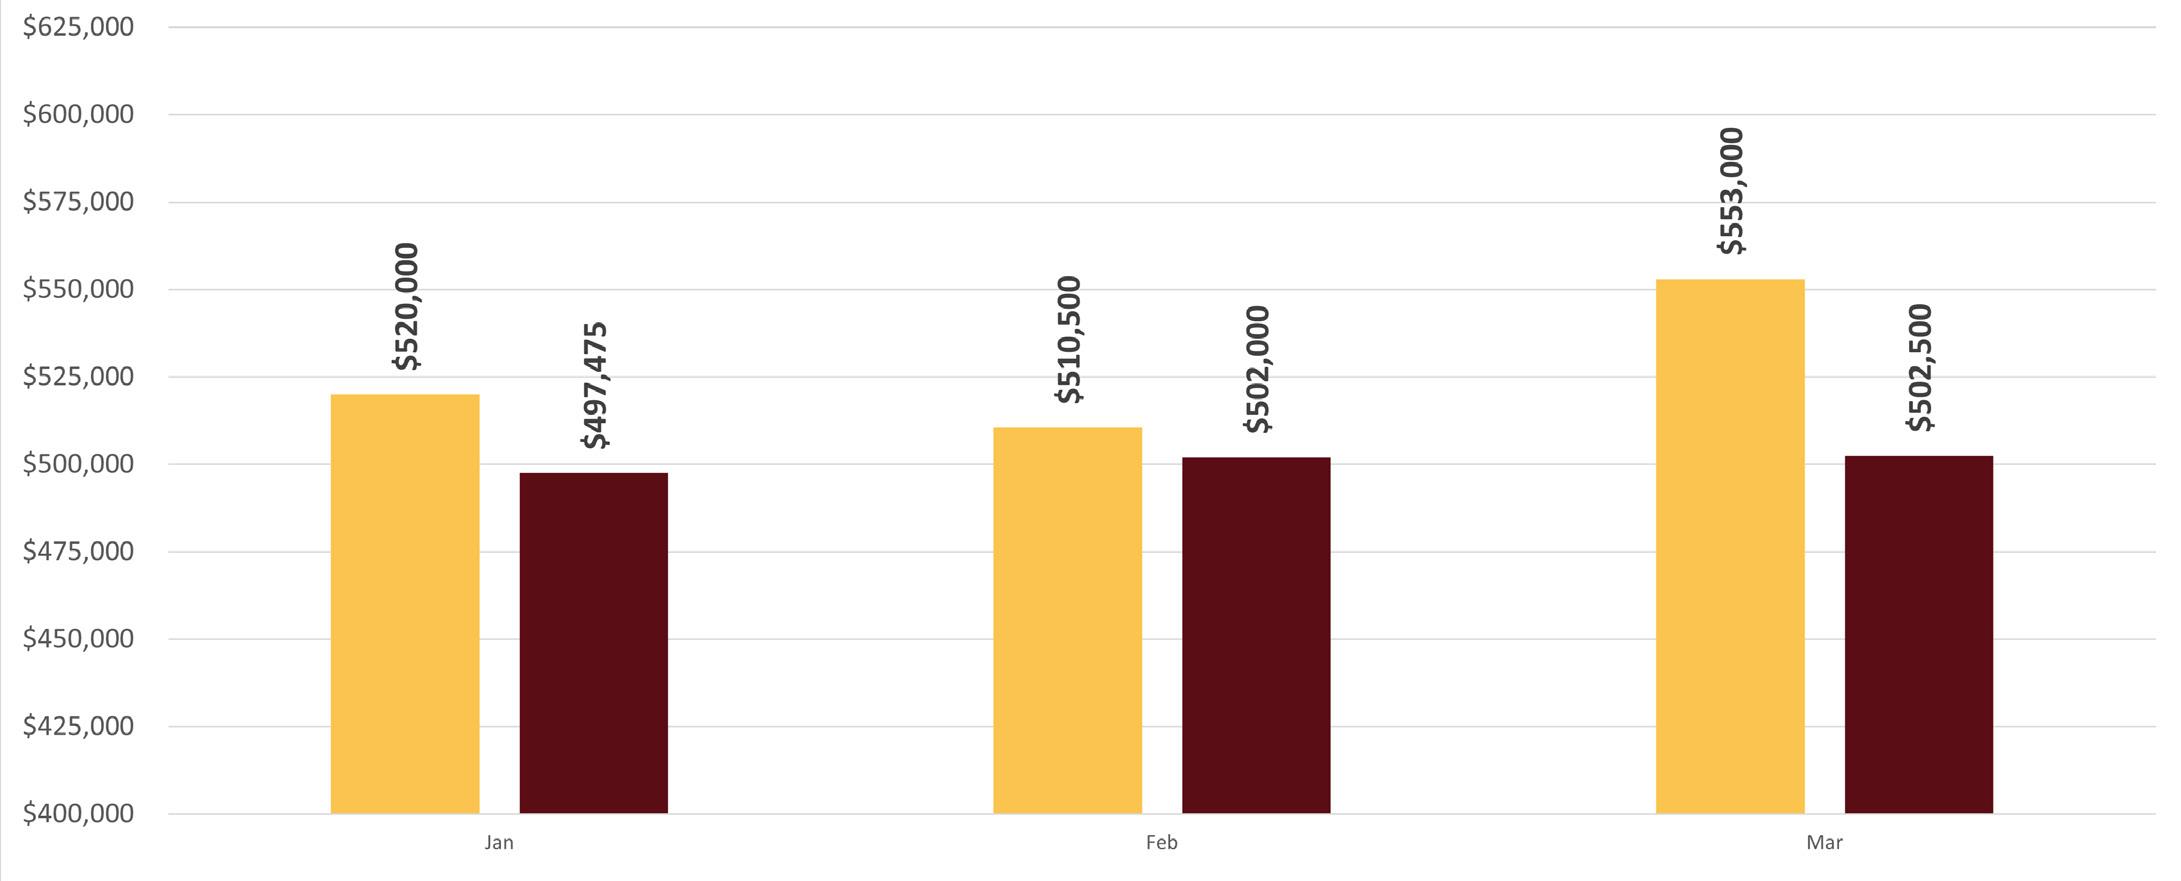
SINGLE-FAMILY HOMES IN SPARKS MEDIAN SALES PRICE
Ferrari-Lund Real Estate, 2023, Q1 8 REPORTS ARE BASED ON SINGLE FAMILY HOMES IN THE RENO & SPARKS AREA. DATA PROVIDED BY SNR @2023 DOMUS ANALYTICS AS OF THE 7th OF APRIL 2023.
S
2022 2023
S pa R k S M a R ket
u MM a R y
141 144 23 New Listings Total Sold Days to contract March, 2023 March, 2023 March, 2023
Q4, 2022 v. Q1, 2023 Q1, 2022 v. Q1, 2023 Market Summary New Listings Sold Listings Median List Price Median Sold Price Days to Contract Active Inventory Q1, 2022 447 392 $555,000 $533,950 5 172 % Change -21.50% -21.90% 2.00% -6.40% 560.00% 114.00% Q1, 2023 351 306 $565,950 $500,000 33 368 Market Summary New Listings Sold Listings Median List Price Median Sold Price Days to Contract Active Inventory Q4, 2022 296 333 $551,998 $509,950 42 504 % Change 18.60% -8.10% 2.50% -6.40% -21.40% -27.00% Q1, 2023 351 306 $565,950 $500,000 33 368
SPARKS
All reports are based on single family homes in the Reno & Sparks area(s). Dates between 1/1/2022 - 3/31/2023.

Data Provided by NNRMLS.
@2023 Domus Analytics.
Ferrari-Lund Real Estate, 2022, Q1 10

2022, Q1, Ferrari-Lund Real Estate 11