4 minute read
Turning risks in opportunities
LET’S ASSIGN A PRICE TO CARBON DIOXIDE
MORE AND MORE COMPANIES IN THE WORLD SUPPORT THE INITIATIVE THAT ASSIGNS AN ECONOMIC VALUE TO CO2 THAT IS PRODUCED AND RELEASED INTO THE ENVIRONMENT. A QUANTITATIVE METHOD TO STUDY THE IMPACT OF A COMPANY AND TO HAVE A FURTHER TOOL TO FACILITATE DECARBONISATION.
In 2021, for the first time, an internal document that defined the method to evaluate GHG emissions within investment projects was published. The reason behind this document was to offer a reference system to calculate, with an actual economic value, the impact of CO2 on the different initiatives, throughout their life-cycle. The objective of this value is to raise awareness not only about the actual costs that the company has to face, but also about the impact on the local area and on the environment. It is another tool that supports us in the evaluation of feasibility of a project, that makes it possible for us to keep an eye on the commitment that a highimpact work requires in terms of GHG emissions. >> HOW MUCH DOES CO2 COST?
According to the economic footprint conversion, calculated in tonnes of CO2 (tCO2e), our internal method suggests to apply the avoidance cost approach. The estimate of the conversion is calculated in €/tCO2e, in a range of short and middle-term projects the average value applied is of 100€/ tCO2e, while for long-term projects we refer to an average value of 269 €/ tCO2e. These values are in line with the estimates defined by 28 European Union States, with average values defined by the Handbook on external costs of transports. The calculation method was published internally at the end of 2021: considering the limited amount of time for an accurate evaluation, it is not possible to evaluate the actual impact of this method. In any case, we decided to integrate the internal procedures of all the FS Group companies with a specific evaluation of CO2 emissions for investment projects, in line with the method.
€ 100
Cost of tCO2 for short/medium-term projects
€ 269
Cost of tCO2 for long-term projects
CARBON PRICING AND CARBON TAX
Carbon pricing is the price assigned to greenhouse gasses such as CO2 and methane. Carrying out services or products with negative effects on the climate, have a negative impact on the environment, generating costs that will burden on the collectivity. The aim of Carbon Pricing is to encourage companies to take into consideration this cost.
Many countries in the world have introduced a specific tax (Carbon Tax) on emissions, to encourage the most polluting companies to find sustainable solutions that have a lower impact on the environment. We are evaluating systems of economic balance and management to respond to the need to reduce global emissions, such as the Emission Trading System (ETS), according to which each country must determine a maximum amount of emissions that can be generated by companies on their territory: therefore we see the creation of the carbon market, in which the emission of agents that have a negative impact on the climate becomes for all the companies a limited resource that has to be purchased. These are some of the solutions that are proposed and applied by many countries in the world to promote a quick move towards renewable and clean energy sources.
GREEN FOCUS
PERFORMANCE, THE RESULT OF OUR COMMITMENT
TRANSPORT SERVICES HAVE A HIGH ENERGY REQUIREMENT, WHICH NEEDS TO BE MONITORED AND REPORTED IN DETAILS TO IMPROVE THE EFFICIENCY OF THE SERVICES PROVIDED AND TO REPRESENT PROGRESS AND PROBLEMS OUTSIDE THE COMPANY.
>> PRODUCTION DATA
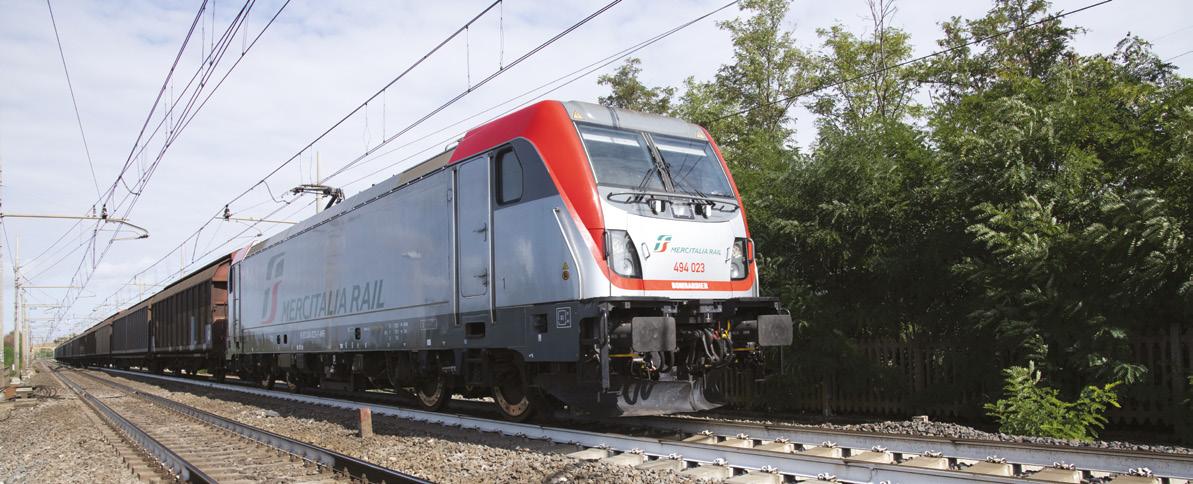
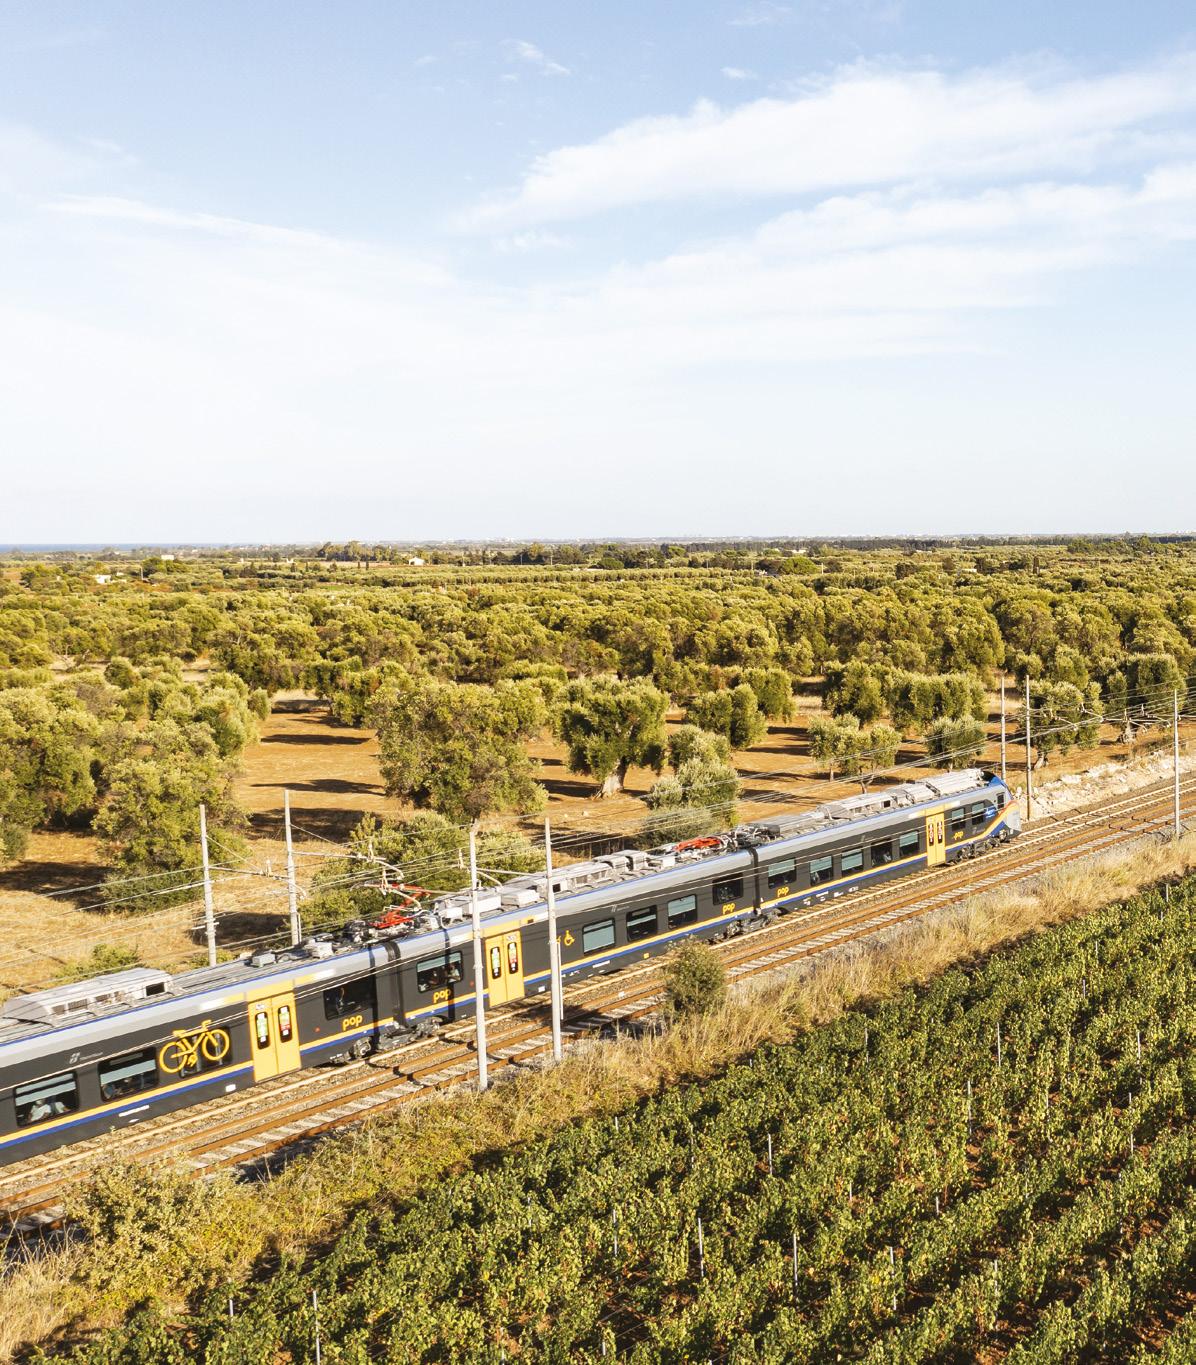
The main modes of transport of the FS Group are trains and buses, but there are also navigation services provided by Bluferries, Blujet and Busitalia Sita Nord. Production data that highlight the distance covered for each of these services are written in train-kilometre and bus-kilometre, which is the distance of one kilometre covered by the travel mode mentioned. Passenger traffic and freight traffic in relation to transport services (in thousands)

KPI 2021 2020 2019 Train-km passengers 270,216 242,126 310,386 Train-km freight 43,065 40,991 41,210 Bus-km freight 178,063 172,560 207,386
Production data that define the size of the transport service that is created is written in passenger-kilometre and tonnes-kilometre, which mean the transfer of either one single passenger or a tonne of goods for a kilometre with the analysed mode of transport. KPI 2021 2020 2019
Passengers - km on a train 21,522 18,154 45,716
Goods - km on a train 21,880 20,688 22,035
Passengers - km on a bus 1,733 1,713 2,935 In the next chapters we will represent, in quantitative terms, the different performances of transport services; energy consumption and related emissions of greenhouse gasses, energy cost and the importance of the items in the environmental statement.


