
5 minute read
Are we more sustainable?


Did investment patterns change based on what was learned from the last crisis? Are we more sustainable?
The last financial crisis saw many countries promote the use of investment into infrastructure as a way of improving growth prospects via economic multipliers. Whilst investment did occur in many countries, as discussed earlier there is still a significant gap between current investment trends and investment need, even before the currently agreed SDGs are taken into consideration.
The investment case as discussed in this report is therefore clear. What is less clear, however, is what did we learn out of the investments out of the last financial crisis and will this help us during the exit from the economic conditions because of the Covid-19 pandemic?
So where does the world currently stand on investment? Infrastructure investment and political support for measures which help to improve economic performance whilst combatting climate change are still considered important. The Covid-19 crisis and the webinar seriesxxv run by FIDIC, which was attended by over 9,000 attendees, discussed on multiple occasions the need to ensure that investment decisions arising from Covid needed to ensure they considered the potential of a ‘new normal’ which may include to a varying degree allowing more remote working, upgraded health provision and lower fossil fuel use to improve the environment.
The issue going forward will be instigating such change, learning from the financial crisis and the currently under-trend investment levels and understanding how these can be addressed going forward.
This report has already discussed the possibility of mechanisms to automatically respond and bolster a shift back to trend, but is this enough?
Using OECD data on infrastructure investment and maintenance, the chart below tracks the investment/ maintenance spending ratio over time of countriesxxvi where consistent data points over time were available and removing seven outliers where the ratio was significantly above 20 and not representative within the dataset.
Figure 11 below show the results for individual country plots to demonstrate the range and variance but also the overall outcome.
Figure: 11 – Investment/maintenance spending ratio – countries
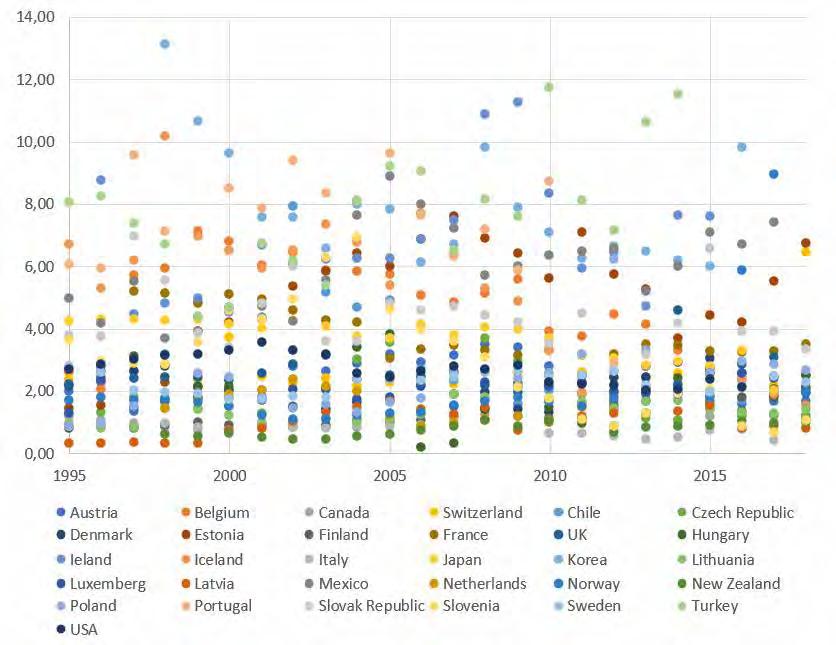
As can be seen from the individual country plots, there is a gathering of data points between the 1.5-4.0 ratio band and that over time the number of countries with points above this level have decreased.
It should, however, be noted that several countries in more recent years do not have data for investment and/ or maintenance and so their data point is excluded. This is to ensure that we can look at the most up-to-date picture possible, but the results should be considered in this light.
We therefore then plot the average considering the above and it shows that over time the investment/ maintenance ratio has fallen from investment being approximately three times the level of maintenance to it being just over two times the level.
It is important to consider that the data point in more recent times that are not included could if at a higher ratio improve results. This does not, however, mean that such an overall trend is not relevant because if you consider the period excluding the last four years where there are some missing data points in 11 countries (up to four years most missing one or two) that the trend is still lower than at the start of the period.
This can be seen in Figure 12 below, as can the potential impact of economic cycles and conditions with the ratio experiencing a rise with a subsequent fall in the period around 2001, 2009 and 2015. The 2001 period was around the emergence of the technology bubble, the 2009 period the financial crisis and the 2015 period a time of increasing global uncertainty with pressures on international trade.
Figure: 12 – Investment/maintenance spending ratio - overall

The important thing to consider is, what can we learn from the above? Below, this report provides some observations:
Maintenance spending as a proportion of the investment/maintenance spending has increased.
Investment spending as part of the investment/maintenance spending has decreased.
Both have decreased or increased but to a differing extent.
The above, however, is even more important when you consider that trend going forward. As can be seen from the Figure 13 below by 2030, the time at which the SDGs and ‘sustainable development’ is due to be a priority, the ratio would only be 1.7 and if that is pushed out to 2050 the ratio would be 1.
Figure: 13 – Investment/maintenance spending ratio – overall forward projection

Source Data from OECDxxix
To help explore the above further, analysis was done on the maximum spend across the period, the minimum spend and the variation between the two compared to the average for both investment and maintenance spending.
The result of this is that the variation and scale of changes in infrastructure and maintenance expenditure were very similar, with a 90% variance on investment expenditure and an 88% variance on maintenance expenditure.
This suggests that whilst in the shorter term there are movements due to economic circumstances towards a ratio where investment is not significantly outpacing maintenance, there is a valid question to be asked as to why maintenance is not reducing if we are acting more sustainability.
This has two potential implications. The first is investment profiles. Despite all the emphasis on using investment to grow out of recessions, its spending compared to maintenance is relatively stable and linked to maintenance. This suggests we have not seen progress towards the earlier discussed infrastructure needs gap.
The second is that when you consider ‘whole life costs’ and the aim of making infrastructure more sustainable, there does not appear to be evidence that maintenance costs are reducing as a result of infrastructure expenditure, in fact they are increasing.
Whilst this may not seem positive it can explain the issue the globe is facing, in that a lack of infrastructure investment in a sustainable manner is resulting in maintenance costs being higher as a ratio between the two than otherwise would be the case and the globe is not meeting its infrastructure investment need. We are still prioritising short-term solutions and fixes over long-term sustainable decisions.
Given FIDIC’s global reach and network, we believe it is important to explore and work with all stakeholders across the globe to collate project and investment information and to investigate these findings further and their potential implications on how the infrastructure sector can support a shift towards a more sustainable future to meet or even outperform the SDGs.
Given the evidence in this report on the investment/maintenance ratio, FIDIC recommends that there be a global effort to monitor such a ratio, not only in the countries that could be analysed as part of this report but across all countries. The goal for example could be that maintenance spending remains stable, but investment spending rises to meet the investment gap thus improving the ratio and truly pushing towards whole life and sustainable investment.


