
13 minute read
5 Sports Analytics
Sports Analytics By: Indrani Chakraborty & Sourish Atorthy (T A Pai Management Institute, Manipal)
How Statistics & Analytics is guiding a new era in sports.
Advertisement
“How can you not be romantic about Baseball!” When Brad Pitt says this in the movie Moneyball, he is speaking for all of us and about all sports. Statistics says about 56% people in the world love sport and 73% people have played at least one sport in their lifetime in any level. But how has statistics and analytics changed sports through time? Or did it affect at all?
To answer that we need to look no further than the movie mentioned earlier – Moneyball. Moneyball Theory is a concept in statistics, which came out when Bill Beane of Oakland Athletics, with the help of his number two, Peter Brand, used empirical analysis to scout players and built a team with undervalued players which created history by winning 20 straight games in Major League Baseball of America. They did not bring big names to their teams but instead went for players who were written off by others but fetched enough amount of runs to win matches. “The goal was not to buy players but runs. As players don’t win you matches, runs do.” And how did they find out which player fetched the right number of runs? Yes, you guessed it right – through statistical analysis and data mining. This was one of the first examples of using statistics and analytics in the field of sport. But now the question rises, what is the future of this then? That is what we will try to see and answer through this article.
The World Sports Market
According to a recent Kearney assessment of sports clubs, leagues, and federations, the global sports sector is worth between €350 billion and €450 billion ($480-$620 billion). Infrastructure construction, sporting equipment, licensed items, and live athletic events are all included in this. According to a study commissioned by Lagardère Unlimited, the global sports business is rising at a far quicker rate than national GDP rates around the world. And the global sports value chain, in terms of size, composition, and revenues, has substantial future growth potential.
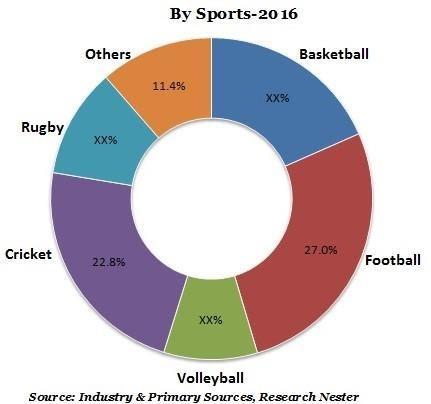
The global sports market can be divided into numerous subcategories that span multiple markets and, in some cases, have a direct impact on the global economy. There are various submarkets within the professional sports industry, including broadcasting and licensing, sponsorship, and many others. Aside from professional sports, there is the sporting goods sector, which is largely reliant on brand marketing and is frequently linked to professional sports via player sponsorship and affiliations. Food and nutrition, such as the protein industry, and worldwide gambling, considering how much of it is linked to sports betting, are the next two significant markets intimately associated with the global sports economy. The eSports market is also worth noting, given recent technological advancements in the video game market and similar economic features to professional sports. The participation sports category, which will generate $136.7 billion in worldwide annual sales by 2025, will present the best prospects in the sports market categorized by type. The sponsorship category, which will generate $71.1 billion in worldwide annual sales by 2025, will have the best prospects in the sports industry categorized by revenue source. The fitness and recreational sports centers sector, which will generate $55.0 billion in worldwide annual sales by 2025, offers the best potential in the participatory sports market categorized by type. The sports teams and clubs category, which will generate $55.1 billion in worldwide annual sales by 2025, will have the best prospects in the spectator sports market categorized by type.
The Rise of Statistical Analytics
Statistics has shown to be a superior method of analyzing and interpreting data in a variety of sectors, including psychology, business, sports, physical and social sciences, production and manufacturing, government, and so on. Data Science, on the other hand, is a great combination of business, mathematics, computer science, and communication.
Frederick Winslow Taylor, who pioneered time management exercises in the nineteenth century, is credited with introducing analytics to corporations. Another example is Henry Ford's assembly line speed measurement. In the late 1960s, as computers became decision-making support systems, analytics gained traction. Because of the rise of big data, data warehouses, the cloud, and a variety of software and hardware, data analytics has exploded. Data analytics include the study, discovery, and interpretation of data trends.
Statistics & Analytics in Sports
The study of analytical data regarding players and their performances to understand their shortcomings and strengths is known as sports data analytics. Sports Data Analytics is now being applied in a range of ancillary industries, with a lot of room for expansion. In this article, we have discussed few concepts which, recently, are hugely used in sports industry in general and baseball and football in particular.
Sabermetrics
Sabermetrics was established to help baseball fans learn more about the game by using objective data. This is accomplished by assessing players in all aspects of the game, particularly batting, pitching, and fielding. Because prior statistics were deemed inefficient, these evaluation metrics are frequently expressed in terms of runs or team wins. It constitutes of two main measurements which is used to gauge a player.
1. Batting Measurements: The traditional metric of batting performance, hits divided by the total number of at-bats, is changed by the On-base percentage, which takes walks and hit-by-pitches into account. The total number of hits + bases on balls + hit by pitch is divided by at bats + bases on balls + hit by pitch + sacrifice flies to get the On-Base percentage. Weighted on-base average, secondary average, runs created, and equivalent average are some of the other statistics used by saber-metricians to analyze batting performance.
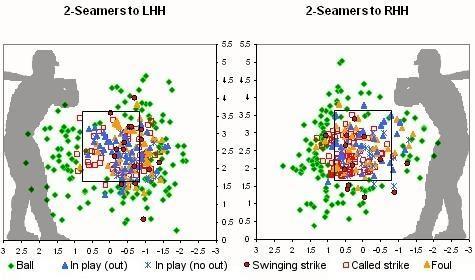
2. Pitching Measurements: Earned run average is the usual metric for evaluating pitching performance. It's assessed in terms of earned runs per nine innings. Earned run average does not distinguish between a pitcher's ability and that of the fielders with whom he interacts. A pitcher's winning percentage, which is computed by dividing victories by the number of decisions, is another traditional metric for pitching (wins and losses). The pitcher's team, particularly the number of runs it scores, has a significant impact on his winning percentage. Saber-metricians have tried to come up with various measurements of pitching performance that don't include the fielders' performances. The most used statistic is walks plus hits per inning pitched (WHIP), which, while not completely defense-independent, indicates how many times a pitcher is likely to put a batter on base (either by base-on-balls, hit-by-pitch, or base hit) and thus how effective batters are against that pitcher in reaching base. The creation of the defense independent pitching statistics (DIPS) system is a more recent development.
Football Analytics
In today's football industry, data analytics has become increasingly vital. Big data is allowing clubs to extract insights to improve player performance, reduce injuries, and increase their commercial efficiency, allowing them to gain a competitive edge on and off the field. Context is crucial, and as a result, a few measures have been established that prioritize context when comparing players. Let us see few and how they change the way of comparing players in football.
“Per 90” Metrics: Using raw, total figures for a measure can be deceptive because it ignores the minutes played to arrive at that figure. We need to create a fair way to compare performance by looking at the figures in the context of the entire game (per 90 minutes or "per 90"). Let’s consider two players for a particular season:
Table 1 Goals Assists Successful Dribbles Successful Passes Minutes Played
Player 1 18 11 78
Player 2 11 7 60 432 1896
238 935
Apparently (as per Table 1), Player 1 is much better than Player 2. But if consider the players stats per 90 minutes (as per Table 2), then we can see Player 2 has a far better stats than Player 1.
Table 2 Goals p90 Assists p90 Successful Dribbles p90 Successful Passes p90
Player 1 0.85 0.52 3.70
Player 2 1.06 0.67 5.76 20.51
22.91
This is how per90 stats can change the context of comparison and hence sheds more light on two player comparison.
xG and xGOT: The likelihood that a shot will result in a goal based on the features of the shot and the circumstances leading up to it is known as xG (or expected goals). The characteristics considered are the location of the shooter, the body part used to shoot the ball (header or left foot or right foot, etc.), the type of assist pass (through ball, cross, set piece etc.) and the type of attack leading to the goal (in possession shot or rebound). To assess the likelihood that a shot will result in a goal, each shot is compared to thousands of other ones with comparable characteristics. The expected goal total is determined by that likelihood. A miss with an xG of 0 is a sure miss, whereas a goal with an xG of 1 is a sure goal. If ten identical shots were tried, an xG of.5 would suggest that five of them would be expected to result in a goal.
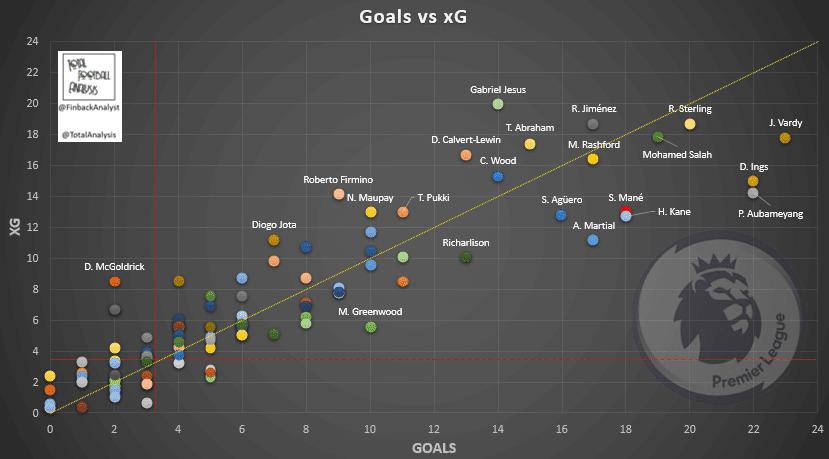
xG is a metric that gauges the quality of a team's chances, while xGOT is a metric that tells us what a team did with those chances. xGOT is a post-shot model, whereas xG is a pre-shot model. The Expected Goals on Target model is based on previous on-target shots and incorporates not only the shot's initial xG but also the goalmouth location where it landed. When compared to shots that go straight down the middle of the goal, it offers more credit to shots that end up in the corners. This model is only applicable to on-target shots, as there is a 0% chance that your shot will result in a goal if it is not on target.
Big Data in Sports – Fan Analytics
Sports are a business, and the more fans that are involved, the more profit organizations make. Sports management teams can uncover how and when people are likely to attend events or purchase items by learning about data analytics in the online realm. To better understand what consumers desire from the game, management examines social media behaviors, attendance, and item sales. This enables them to determine what matters most to fans, such as a fun mascot or unique items. Management can build marketing strategies and advertising campaigns that target fans. Data enables them to quickly identify supporters who are likely to engage with the club, allowing them to avoid wasting advertising dollars on customers who are uninterested in their sport. Data science and statistics may be useful to sports bettors. It is considerably simpler to anticipate when and where a team will be successful in the future when gamblers can study a team's prior performance with reliable statistics. Sports fans are more willing to gamble if they do not have to guess which team or individual will do well. Statistics enable them to create a data-driven prediction system, giving gamblers more confidence in placing bets on certain teams or players.
Legalized sports gambling is increasingly become more and more popular in many countries. In India, introduction of apps like Dream11 and My Dream Circle, have shown huge investments and interactions by fans in sports gambling, especially during the times of the IPL (Indian Premier League), ISL (Indian Super League) and PKL (Pro Kabaddi League). This also is increasing the viewership of many sports (especially football and kabaddi) in India and hence increasingly attracting revenue from sports which are less popular.

Data Driven Football Management – The Story of Brentford FC
In 2012, something unique happened when a lifelong fan, , of Brentford FC, Matthew Benham, saved the club down in deep debts from bankruptcy by paying off the £500,000 the club owed. Since then, he invested close to £90 million in the club, but as other owners will spend on players, he installed a clear culture driven only by analytics and data. He did away with the notion that outcomes should drive decisions, instead relying on the analysis of key performance metrics to determine any hiring decisions. Benham sought to take a tiny team like Brentford and compete at the top level against clubs with far greater funds by actively doing things differently.
The club's large efforts in nurturing new talent were not yielding beneficial dividends, as the greatest talent generated by their academy was being snatched away for free by major Premier League teams at a young age. This is why Brentford FC opted to shut down their academy and focus only on attracting players from other teams. They transitioned from being a feeder club for new talent into larger opponents to collaborating with them to release surplus assets for a modest charge. The club guaranteed that it had a plan of succession and a place to nurture excellent players regardless of their age by having a B-team as a steppingstone into the main squad. At the club, evaluating team performance has also altered dramatically. Brentford are major admirers of xG models, which they employ to get a possibly alternative perspective on the current league table position and match outcomes. They stated that this eliminated the luck aspect that might impact football outcomes and instead focuses on the quality of the team's performances with an eye toward the club's long-term viability. The club's approach to player recruiting has also evolved to evaluate which players should be signed in a stock market-like manner, almost as if they were appreciating and depreciating assets, considering market inflation in various regions.

In the realm of football, implementing a fresh pioneering method, such as the one Benham desired for Brentford, is not simple. After winning promotion to the Championship the previous season and the squad being in a good league position, Benham dismissed successful manager Mark Warburton in 2015. Warburton's basic philosophical concerns with the new framework in which Brentford FC was operated were freely aired. Brentford recruited Dean Smith as their head coach, and he became one of the league's longest-serving managers after completely embracing the club's revolutionary ideology.
Concluding Thoughts
Sports analytics has ushered in a paradigm shift in the sports sector, but there is still a long way to go. With the integration of technology and wearables, the day is not far off when analytics will measure a player's mental and emotional composition and how it connects to their on-field performance. Sports analytics offers a wide range of applications and will continue to develop in the coming years. regions.
A career in sports analytics is on the rise, owing to the ideal combination of high demand and limited supply. In India, a growing number of teams, both college and professional, are expanding their in-house analytics personnel. With the development of third-party consultants like Fantasy and gambling apps, demand can only increase.
References
1. Keith D. Foote (September 20, 2021), A Brief History of Analytics, https://www.dataversity.net/brief-history-analytics 2. 2U, Inc. (September 23, 2020), The Role of Data Science in Sports, https://www.mastersindatascience.org/resources/big-data-in-sports/ 3. Wikipedia (August 2020), Expected goals, https://en.wikipedia.org/wiki/Expected_goals
4. David Hellier (May 28, 2021), Big Data Model Helps Local London Team Win Soccer’s
Richest Game, https://www.bloomberg.com/news/articles/2021-05-28/big-data-modeltakes-local-london-team-to-soccer-s-richest-game


