5 minute read
Comparison of Miami-Dade Manufacturing Businesses with Benchmark Counties
COMPARISON OF MIAMI-DADE’S MANUFACTURING BUSINESSES WITH BENCHMARK COUNTIES
Make it Miami
Advertisement
This section compares Miami-Dade County’s businesses and manufacturing sector with counties across South Florida and benchmark counties across the nation. The section puts in perspective the current employees, wages paid, and average wages in all sectors of business and the manufacturing sector. Over the 2002-2017 period, Miami experienced a robust growth in new businesses, with an increase of over 20,000 private establishments (28.4%). Table 4 shows that this growth was present in the other large counties in the region. Although it trails Miami in number of establishments overall, the number of firms in Palm Beach increased by 39.4%, to over 55,000. Of the three benchmark counties, only Harris County (TX) in which Houston is located, had growth larger than Miami-Dade.
Table 4 Number of Business Establishments in South Florida & Benchmark Counties, 2002-2017
Year
Miami-Dade, FL Broward, FL Palm Beach, FL Fulton, GA Harris, TX King, WA
2002 75,361 53,221 39,713 36,172 87,792 83,907
2007 85,477 64,317 49,641 39,104 97,838 75,651
2012 89,039 63,133 49,444 40,830 103,359 82,290
2017 96,750 68,271 55,372 42,325 114,580 86,931
Change (‘02-’17) 28.4% 28.3% 39.4% 17.0% 30.5% 3.6%
As previously noted, the manufacturing sector in Miami-Dade resisted the trend, and shrunk in terms of firms by 2.9% since 2002. Table 5 shows that Broward and Palm Beach had a growth in manufacturing establishments, although smaller than their overall firm increases. Manufacturing also shrank in Seattle (King County, WA) and Houston (Harris County, TX).
Table 5 Number of Manufacturing Establishments in South Florida & Benchmark Counties, 2002-2017 Year Miami-Dade, FL Broward, FL Palm Beach, FL Fulton, GA Harris, TX King, WA
2002 2,932 1,929 1,165 954 4,897 2,886
2007 2,591 1,871 1,154 904 4,716 2,467
2012 2,636 1,846 1,191 876 4,554 2,225
2017 2,847 1,990 1,355 963 4,802 2,519
Change (‘02-’17) -2.9% 3.2% 16.3% 0.9% -1.6% -12.7%
The comparison of employment growth in the overall economy and in the manufacturing sector also shows reverse tendencies. Overall private employment in Miami-Dade increased by 18.5%, which suggests the economy has recovered from the recession (Table 6). However, within the same period, manufacturing employment in Miami-Dade decreased by 25.8%. One positive development is the 14.4% increase over the last five years, in which manufacturing businesses added about 5,000 jobs. Table 7 shows that the manufacturing employment decline in Miami-Dade was the largest of all comparison counties.
Table 6 Number of Employees in Businesses across South Florida & Benchmark Counties, 2002-2017
Year
Miami-Dade, FL Broward, FL Palm Beach, FL Fulton, GA Harris, TX King, WA
2002 832,067 580,148 444,988 639,042 1,614,890 950,885
2007 865,334 648,099 495,042 564,785 1,767,447 1,020,173
2012 856,865 604,893 446,592 630,380 1,860,385 1,007,018
2017 985,879 694,315 535,850 753,469 1,997,358 1,187,306
Change (‘02-’17) 18.5% 19.7% 20.4% 17.9% 23.7% 24.9%
Table 7: Number of Employees in Manufacturing across South Florida & Benchmark Counties, 2002-2017
Year
Miami-Dade, FL Broward, FL Palm Beach, FL Fulton, GA Harris, TX King, WA
2002 55,083 33,084 22,977 37,839 176,535 117,068
2007 46,742 30,819 18,823 33,711 180,761 111,894
2012 35,738 25,271 15,246 26,344 188,516 102,536
2017 40,893 27,016 19,642 29,945 169,198 101,825
Change (‘02-’17) -25.8% -18.3% -14.5% -20.9% -4.2% -13.0%

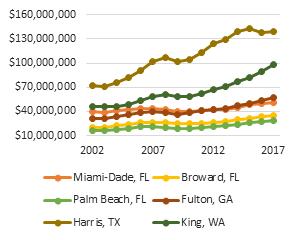
The following figures 9 and 10 show the total wages of private establishments overall and for the manufacturing sector. While Miami-Dade leads in payroll among the South Florida counties at about $51 billion in 2017, the other three comparison counties outside of South Florida all have higher payroll figures that range from about $57 billion to about $139 billion within the same year (See Figure 9). Manufacturing payroll in Miami-Dade is approximately 1% of total payroll at about $493 million in 2017 (See Figure 10). In Broward, manufacturing accounts for 4.3% of payroll with total wages paid at about $1.5 billion and in Palm Beach, it is 4.9% with total wages paid at about $1.4 billion (2017).


Figure 9: Total Wages Paid in Businesses ($1,000) Figure 10: Total Wages Paid in Manufacturing ($1,000)

Overall, wages in Miami-Dade County are lower than in the five comparison counties, as shown in Table 8. Among the three South Florida counties, average wages were highest in Palm Beach, followed by Miami-Dade. However, workers in Miami-Dade earn $18,000 less than private employees in Harris County, almost $25,000 less than employees in Fulton County, and over $31,000 less than those in King County. Table 9 shows that the gaps are even larger in the manufacturing sector. In the three South Florida counties, manufacturing employees get paid the least in Miami-Dade. Miami-Dade manufacturing employees earn 35% less than those in Harris County, 47% less than Fulton County, and 60% than King County.
Table 8: Average Wages Paid in Business across South Florida & Benchmark Counties, 2002-2017
Year
Miami-Dade, FL Broward, FL Palm Beach, FL Fulton, GA Harris, TX King, WA
2002 $34,676 $33,618 $36,384 $49,486 $44,499 $48,676
2007 $42,885 $41,068 $43,423 $61,021 $57,402 $56,812
2012 $45,803 $43,895 $47,076 $67,145 $66,486 $66,694
2017 $51,806 $50,355 $52,745 $76,034 $69,787 $83,050
Table 9: Average Wages Paid in Manufacturing across South Florida & Benchmark Counties, 2002-2017
Year
Miami-Dade, FL Broward, FL Palm Beach, FL Fulton, GA Harris, TX King, WA
2002 $31,878 $41,991 $50,289 $56,969 $53,540 $60,124
2007 $39,716 $48,783 $61,604 $70,230 $72,221 $69,728
2012 $44,006 $53,239 $60,983 $100,634 $80,805 $79,058
2017 $47,815 $55,361 $69,852 $100,341 $86,448 $88,142
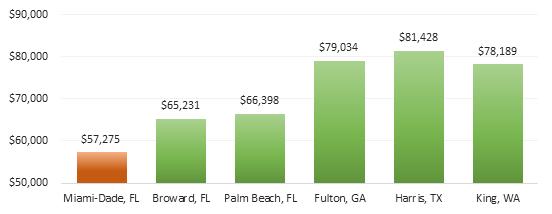
The trend is the same in Miami-Dade County when it concerns average wages paid in manufacturing and average wages paid in advanced manufacturing industries. Average wages in Miami-Dade are lower than the five comparison counties. Across the South Florida counties, average wages paid in advanced manufacturing industries were still the highest in Palm Beach and lowest in Miami-Dade. Figure 12 shows that workers in Miami-Dade’s advanced manufacturing industries on average earn about $24,000 less than private employees in King County, about $25,000 less than private employees in Fulton County, and almost $28,000 less than the workers in Harris County.
Figure 11: Average Wages Paid in Advanced Manufacturing across South Florida & Benchmark Counties, 2017


