15 minute read
Pestel analysis based on neutrosophic cognitive maps and neutrosophic numbers for the sinos river basin management


Advertisement
Rodolfo González Ortega, Marcos David Oviedo Rodríguez, Maikel Leyva Vázquez, Jesús Estupiñán Ricardo, João Alcione Sganderla Figueiredo, Florentin Smarandache (2019). Pestel analysis based on neutrosophic cognitive maps and neutrosophic numbers for the sinos river basin management. Neutrosophic Sets and Systems 26, 105-113
Abstract. The Sinos River watershed is one of the most polluted water basins in Brazil with great efforts for its recovery through integral management. PESTEL is an analysis for the study of the external variables with influence in the efficiency of the organization or project. This paper presents a model to address problems encountered in the measurement and evaluation process of PESTEL analysis taking into account interdependencies among sub-factors and modeling uncertainty and indeterminacy in Sinos river basin. A Neutrosophic Cognitive Maps was used for modeling the integrated structure of PESTEL sub-factors. A quantitative analysis was developed based on static analysis and neutrosophic numbers. To demonstrate the applicability of the proposal in the Sinos river external factor analysis a case study is developed. Interdependencies among subfactors were includes and uncertainty and indeterminacy were modeled in a practical way. Sub-factor was ranked and reduced, with Ecological, Technological and Social are the top three factors. The paper ends with a conclusion and future work recommendations.
Keywords: Sinos River Basin; PESTEL; Neutrosophy; Neutrosophic Cognitive Maps; Static Analysis
1 Introduction
PEST is an analysis for the study of the external variables with influence in the efficiency of the organization or project. These variables involved in the business environment are grouped in Political, Economical, Social, and Technological aspects [1].
The conceptual structure and nature of PEST require an integrated approach for considering importance and interrelation. The standard technical framework of the PEST approach mainly provides a general idea about macro conditions and the situation of an organization, so it is inadequate. Therefore, PEST analysis lacks a quantitative approach to the measurement of the interrelation between its factors. When the environment and legal factors are included, it is named PESTEL (Political, Economic, Socio-cultural, Technological, Environment, and Legal) analysis [2]. Political variables refer to the regulatory aspects that directly affect the enterprise. Here enter the taxes rules or business incentives in specific sectors, regulations on employment, the promotion of foreign trade, government stability, the system of government, international treaties or the existence of internal conflicts or with other current or future countries — also the way in which the different local, regional and national administrations are organized [3]. Economic variables relate to macroeconomic data, Gross domestic product (GDP) evolution, interest rates, inflation, unemployment rate, income level, exchange rates, access to resources, level of development, economic cycles. Current and future economic scenarios and economic policies should also be investigated.
Social variables take into account are demographic evolution, social mobility and changes in lifestyle — also the educational level and other cultural patterns, religion, beliefs, gender roles, tastes, fashions and consumption habits of society. In short, the social trends that may affect the enterprise business [3]. Technological variables are somewhat more complicated to analyze due to the high speed of the changes in this area. It is necessary to know the public investment in research and the promotion of technological development, the technology diffusion, the degree of obsolescence, the level
of coverage, the digital device, the funds destined to R & D + I, as well as the trends in the use of new technologies. Ecological variables are the main factors to be analyzed aware of the conservation of the environment, environmental legislation, climate change, and temperature variations, natural risks, recycling levels, energy regulation and possible regulatory changes in this area[4]. Legal variables refer to legislation that is directly associated with the organization functions, information on licenses, labor legislation, intellectual property, health laws, and regulated sectors[5].
PESTEL analysis has deficiencies for a quantitative approach to the measurement of interrelation among factors are generally ignored [6]. Fuzzy cognitive maps (FCM) is a tool for modeling and analyzing interrelations [7]. Connections in FCMs are just numeric ones: the relationship of two events should be linear.
The Neutrosophy can operate with indeterminate and inconsistent information, while fuzzy sets and intuitionistic fuzzy sets do not describe them appropriately [4]. Neutrosophic cognitive maps (NCM) is an extension of FCM where was included the concept indeterminacy [8]. The concept of fuzzy cognitive maps fails to deal with the indeterminate relation [1].
In this paper, a PESTEL analysis based on neutrosophic cognitive maps is presented proposal methodological support and make possible of dealing with interdependence, feedback, and indeterminacy. Additionally, the new approach makes conceivable to category and to reduce factors.
This paper continues as follows: Section 2 reviews some essential concepts about the PESTEL analysis framework, NCM, and fuzzy numbers. In Section 3, a framework for the PESTEL shows a static analysis based on NCM. Section 4, displays a case study of the proposed model applied to social-environmental management of a river basin. The paper finishes with conclusions and additional work recommendations.
2. Case Study
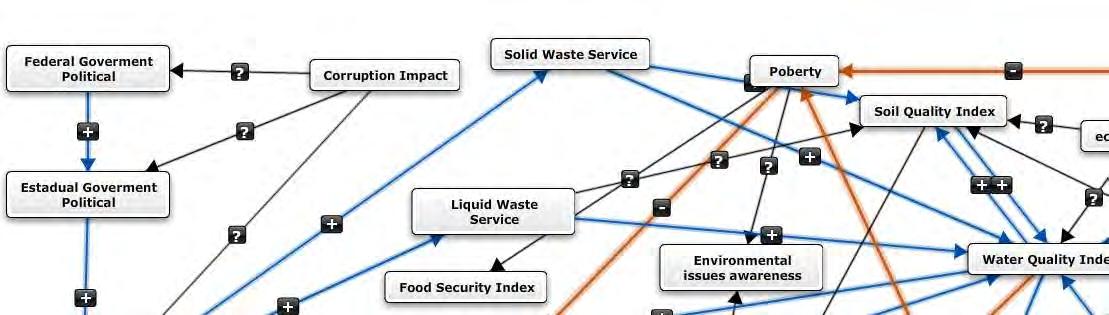
The Sinos River Basin is one of the most contaminated water basins in Brazil [9] which leads to great efforts for its recovery through integral management. Due to the complex nature of the interrelations between the different factors involved in environmental quality management becomes intricate and therefore requires the use of tools that facilitate decision making[10]. Through a participatory exercise with stakeholder members of the COMITESINOS, external variables were identified and a diffuse cognitive map was constructed representing the relationships among the variables. This process of identifying PESTEL variables was carried out with the members of the committee, for which work sessions were held in the coordination meetings. To elaborate on the NCM, Mental Modeler tool of the website http://www.mentalmodeler.org/ was used.
Initially, factors and sub-factors were identified for Sinos river basin management as follows:
I. Relevant Political-Legal Aspects In the political dimension, the following variables were identified: 1. Influence of the federal government in the watersheds management (N1) 2. Importance of the state government in the management of the basin (N2) 3. Control of the municipal government in the watershed management (N3) 4. Impact of bureaucracy on management (N4) 5. Corruption impact (N5)
II. Relevant economic and socio-economic aspects In the socioeconomic dimension, the following variables were identified: 1. Poverty (N6) 2. Per capita income(N7) 3. Quality of solid waste collecting services (N8) 4. Quality liquid waste service (N9) 5. Water supply service (N10) 6. The quality of public health (N11) 7. Quality of sewage and sewage services (N12)
III. Relevant social aspects In the social dimension, the variables identified were: 1. Public education (N13) 2. Population access to food (N14) 3. Access to the housing (N15)
IV. Relevant sociocultural aspects
In the sociocultural dimension, the variables identified were: 1. Perception of the environmental relevance in the local culture (N16) 2. Knowledge of environmental risk (N17) 3. Understanding of environmental awareness ( N18)
V. Relevant technological aspects The variables identified in the technical dimension were: 1. Innovation(N19) 2. Cleaner production(N20) 3. Eco-efficiency (N21)
For the ecological dimension was possible to identify the following variables: 1. Water quality index (WQI)(N22) 2. Air Quality index (AQI) (N23) 3. Landscape change and urban planning(N24) 4. Variations in the biodiversity index of ecosystems value (N25) 5. Climate Change (N31) 6. Soil Quality index (N32)
Legal dimension includes the following factors 1. Environmental Laws (N26) 2. Education regulation (27) 3. Health regulations (28 4. Environmental law (29) 5. Employment Laws (N30) 6. Consumer Law (33)
Interdependencies are identified and modeled using an NCM (Figure 1), with whose weighs represented in Table 1.
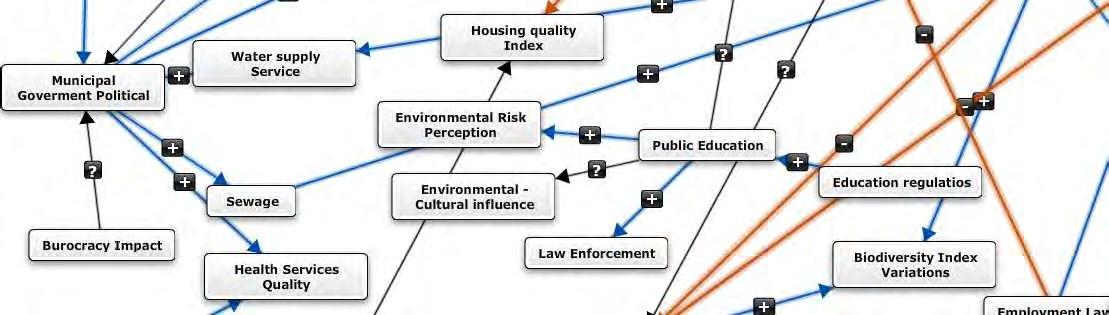
Figure 1: Fuzzy Neutrosophic Cognitive Maps of PESTEL factors.
2 Materials and Methods 2.1 Preliminaries
This article offers a first brief review by PESTEL analysis and the factors’ interdependency. The following is a review of the basic concepts of NCM.
2.1.1 PESTEL Analysis
The PESTEL method is a prerequisite analysis with a network function to identify the characteristics of the environment in which an organization or project operates, provides data and information so that the organization can make predictions about new situations and circumstances and act accordingly. [12, 13]. The variables analyzed in PESTEL are identified and evaluated independently. [2] not taking into account interdependency. In [14] this approach based on fuzzy decision maps is presented taking into account the ambiguity, the uncertainty in their interrelationships.
This study presents a model to address the problems encountered in the PEST measurement and evaluation process, taking into account the interdependencies between the subfactors. NCM modeled the integrated structure of the PESTEL subfactor, and the quantitative analysis is developed from a static analysis that allows to classify and reduce the factors in line with the proposals presented in [15].
2.1.2 Neutrosophic Cognitive Maps.
The Neutrosophic Logic (NL) like a generalization of the fuzzy logic was introduced in 1995 [16]. According to this theory, a logical proposition P is characterized by three components:
NL (P) =(T,I,F) (1)
Where the neutrosophic component T is the degree of truth, F the degree of falsehood, and I is the degree of indeterminacy [7]. Neutrosophic set (NS) was introduced by F. Smarandache who introduced the degree of indeterminacy (i) as an independent component[11] .
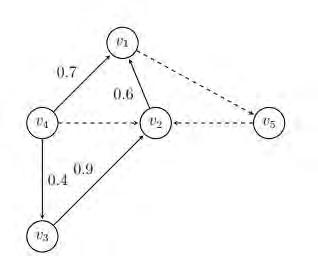
A neutrosophic matrix content where the elements are a = (aij) have been replaced by elements in R I . A neutrosophic graphic has at least one edge is a neutrosophic edge . If the indetermination is found in the cognitive map, it is called the neutrosophic cognitive map (NCM) [20]. NCM is based on neutrosophic logic to represent uncertainty and indeterminacy in cognitive maps [12]. An NCM is a directed graph in which at least one edge is an indeterminate border and is indicated by dashed lines [2] (Figure 2).
Figure 2: Fuzzy Neutrosophic Cognitive Maps example.
In [9] a static analysis of an NCM is presented.
2.1.3 Neutrosophic numbers
The result of the static analysis is in the form of neutrosophic numbers (a+bI, where I = indeterminacy) A deneutrosification process as proposed by Salmeron and Smarandache could be applied giving final ranking value [13].
A neutrosophic number is a number as follows [14] :
N=d+I (2)
Where d is the determinacy part, and i is the indeterminate part. For example s: a=5 +I si i [5,5.4] is equivalent to a [5,5.4].
Let N1=a1+b1 I and N2=a2+b2 I be two neutrosophic numbers then the following operational relation of neutrosophic numbers are defined as follows [8]:
N1+ N2=a1+a1+(b1+b2) I;
N1- N2=a1-a1+(b1-b2) I
2.2 Proposed Framework
The aim was to develop and further detail a framework based on PESTEL and NCM [25]. The model was made in five steps (graphically, figure 3).
Identifying PESTEL factors and sub-factors
Modelling interdepende ncies Calculate centrality measures
Factors classification Factors ranking
Figure 3: The proposed framework for PESTEL analysis [25]
2.2.1 Factors and sub-factors identification in the PESTEL method
In this step, the significant PESTEL factors and sub-factors were recognized. Identify factors and subfactors to form a hierarchical structure of the PESTEL model. Sub-factors are categorized according to the literature [2].
2.2.2 Modeling interdependencies
In this step causal interdependencies between PESTEL sub-factors are modeled, consists in the construction of NCM subfactors following the point views of an expert or expert team.
When a selection of experts (k) participates, the adjacency matrix of the collective MCD is calculated as follows:
1,E2,…,Ek ) The operator is usually the arithmetic mean [13]. (3)
2.2.3 Calculate centrality measures
Centrality measures are calculated [7] with absolute values of the NCM adjacency matrix [15]: 1. Outdegree od(vi) is the summation of the row of absolute values of a variable in the neutrosophic adjacency matrix, and It shows the cumulative strengths of connections (cij) exiting the variable. ( )= (4)
2. Indegree id(v_i) is the summation of the column of absolute values of a variable, and it shows the cumulative strength of variables come in the variable. ( )= (5)
3. The centrality degree (total degree td(vi)), of a variable is the sum of its indegree and outdegree ( )= ( )+ ( ) (6)
2.2.4 Factors classification and ranking
The factors were categorized according to the next rules:
The variables are a Transmitter (T) when having a positive or indeterminacy outdegree, od(vi) and zero indegree, id(vi).
The variables give a Receiver (R) when having a positive indegree or indeterminacy, id(vi)., and zero outdegree, od(vi).
Variables receive the Ordinary (O) name when they have a non-zero degree, and these Ordinary variables can be considered more or less as receiving variables or transmitting variables, depending on the relation of their indegrees and outdegrees.
The de-neutrosophication process provides a range of numbers for centrality using as a ground the maximum & minimum values of I. A neutrosophic value is switched in an interval with these two values. [0,1].
The contribution of a variable in an NCM can be known by calculating its degree of centrality, which shows how the variable is connected to other variables and what is the accumulated force of these connections. The median of the extreme values as proposed by Merigo [29] is used to give a centrality value :
Then (7)
Finally, a ranking of variables could be given. (8)
“The next step is the de-neutrosophication process as proposes by Salmeron and Smarandache. I [0,1] is replaced by both maximum and minimum values” [33]. In Table 4 are presented as interval values.
N1 0,28 N9 [0.72, 1.72] N17 [0,1] N25 0.64
N2 [0.56, 1.56] N10 0.5 N18 [0,2] N26 0.42
N3 [1.78, 2.78] N11 0.64 N4 [0,1] N12 0.5 N19 0.75
N27 0.47 N20 [0.36, 3,36] N28 0.36 N5 [0, 2] N13 [1.17, 4.17] N21 [0.47, 3.47] N29 1.25 N6 [1.83,3.83] N14 [0,1] N22 [2.37, 4.37] N30 [1, 2] N7 1.36 N15 [0.67, 1.67] N23 [0.78, 2.78] N31 [1.31, 3.31] N8 1.03 N16 0.28 N24 [0, 2] N32 [1.06, 5.06]
Tabla 4: De-neutrosophication, total degree values N33 0.36
Finally, we work with the median of the extreme values (Table 5) [29]. N1 0.28 N9 1.22 N17 0.5 N25 0.64 N33 0.36 N2 1.06 N10 0.5 N18 1 N26 0.42 N3 2.28 N11 0.64 N19 0.75 N27 0.47 N4 0.5 N12 0.5 N20 1.86 N28 0.36 N5 1 N13 2.67 N21 1.97 N29 1.25 N6 2.83 N14 0.5 N22 3.37 N30 1.5 N7 1.36 N15 1.17 N23 1.75 N31 2.31 N8 1.03 N16 0.28 N24 1 N32 3.06
Tabla 5: Total degree using the median of the extreme values
Top 6 nodes according to centrality are represented in table 6.
Tabla 6: Top 6 nodes N22 3,37 N32 3,06 N6 2,83 N13 2,67 N31 2,31 N3 2,28
Water quality index, Soil Quality index and Poverty are the top three factors. Centrality measures of subfactor were grouped according to their parent factors (Figure 4).
Legal 11% Political 13%
Ecological 30% Economic 20%
Social 11%
Technological 11% Sociocultural aspects 4%
Figure 4: Aggregated total centrality values by factors
When the average is used as aggregation´s operator, the result is represented in Figure 5. Ecological, Technological and Social are the top three factors.
Legal; 0.73 Political; 1.02
Ecological ; 2.02
Tecnological; 1.53 Economic ; 1.15 Social; 1.45
Figure 5: Average of total centrality values by factors Sociocultural aspects ; 0.59
Factors with a little incidence of less than 1.5 % (0.606) are reduced for further analysis. In this case, we found nodes like N1, N4, N10, N14, N16, N17, N26, N27, N28 and N33.
After the application, in this case, study the model was found practical to use. The NCM gives high flexibility and takes into account interdependencies PESTEL analysis.
Conclusion
This study presents a model to address problems encountered in the measurement evaluation process of PESTEL analysis taking into account interdependencies among sub-factors and modeling uncertainty and indeterminacy in Sinos river basin. NCM modeled the integrated structure of PESTEL sub-factors, and quantitative analysis was developed based on static analysis and neutrosophic numbers.
To demonstrate the applicability of the proposal in the Sinos river external factor analysis a case study is developed. Sub-factor was ranked and reduced with Ecological, Technological, Social are the top three factors.
NCM modeled the integrated structure of PESTEL of factors and sub-factors. Our approach has many applications in complex decision problem that include interdependencies among criteria, and such as complex strategic decision support in river basin management.
Further works will concentrate on extending the model for dealing scenario analysis in conjunction with a multicriteria environment. Another area of future work is the development of a software tool.
Conflicts of Interest
No conflict of interest are declared by the authors.
Funding Statement
This study was partially supported by “Coordenação de Aperfeiçoamento de Pessoal de Nível Superior - Brasil (CAPES)” -Finance Code 001.
Data Availability Statement The data used to support the findings of this study are included within the article.
References
[1] Leyva, M., et al., A framework for PEST analysis based on fuzzy decision maps. Revista ESPACIOS, 2018. 39(16). [2] Yüksel, I., Developing a multi-criteria decision making model for PESTEL analysis. International Journal of Business and Management, 2012. 7(24): p. 52. [3] Leyva Vázquez, M.Y., R. Rosado Rosello, and A. Febles Estrada, Modelado y análisis de los factores críticos de éxito de los proyectos de software mediante mapas cognitivos difusos. Ciencias de la Información, 2012. 43(2). [4] Jara, J.I.E., et al., manuales de procedimientos en la administración pública. garantías de cumplimiento de los principios constitucionales. revista magazine de las ciencias. issn 2528-8091, 2017. 2(2): p. 01-12. [5] Khan, M., et al., Systematic review of decision making algorithms in extended neutrosophic sets. Symmetry, 2018. 10(8): p. 314. [6] Hernandez, N.B. and J.E. Ricardo, Gestión Empresarial y Posmodernidad. 2018: Infinite Study. [7] Leyva-Vázquez, M. and F. Smarandache, Inteligencia Artificial: retos, perspectivas y papel de la Neutrosofía.
Dilemas Contemporáneos: Educación, Política y Valores, 2018. [8] Pérez-Teruel, K. and M. Leyva-Vázquez, Neutrosophic logic for mental model elicitation and analysis. Neutrosophic
Sets and Systems, 2012: p. 30.
