
8 minute read
Are You Confident in Your Concrete Pavement Mix Design?


Are You Confident in Your Concrete Pavement Mix
A fluorescent thin section of concrete in UV light.
All photos and figures courtesy of Chunyu Qiao and DRP, a Twining Company.
New developments in concrete pavement quality assurance can provide important information on the quality, durability, and compliance with mix design specifications.
DESIGN?
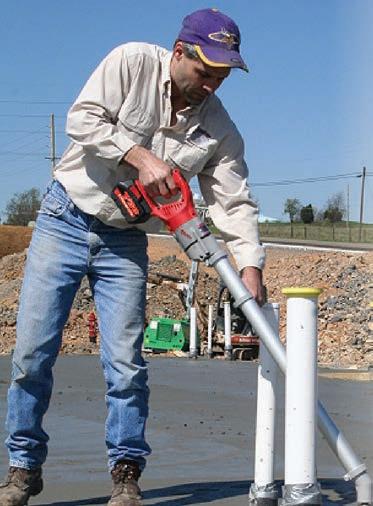
The construction of concrete pavements can see unexpected events that require contractors to verify the quality and durability of the in-place concrete. Such events include exposure to rain during placement, late applications of curing compounds, plastic shrinkage cracking hours within hours of the placement, and problems texturing and curing the concrete. Even when strength requirements and other material tests are satisfied, engineers may call for the removal and replacement of sections of pavement over concerns regarding the compliance of in-place material with mix design specifications. In such cases, petrography and other complementary (but specialized) test methods can provide important information on the quality and durability of concrete mixtures and their compliance with job specifications.
W/CM & CONCRETE QUALITY
Professor Duff Abrams first described the relationship between water-cement ratio (w/c) and compressive strength in 1918, formulating what is now known as Abram’s Law: “the compressive strength of a concrete mix is inversely related to its water/cement ratio.” In addition to controlling compressive strength, the water-cementitious materials ratio (w/ cm), is now favored as it recognizes the replacement of portland cement with supplemental cementitious materials such as fly ash and slag. It is also a critical parameter for concrete durability. Many studies show that concrete mixtures with w/cm below ~0.45 are durable in aggressive environments, such as areas exposed to freeze-thaw cycles with deicing salts or areas where high concentrations of sulfate are present in soils.
CAPILLARY POROSITY & WHY IT MATTERS
Capillary pores are an intrinsic part of the cement paste. They consist of spaces between cement hydration products and unhydrated cement grains that were once filled with water. Capillary pores are much finer than entrained or entrapped air voids and should not be confused with them. When capillary pores are connected, fluids from the external environment can migrate through the paste. This phenomenon is known as percolation and it must be minimized to ensure durability. Durable concrete mixtures have a microstructure where capillary pores are segmented, rather than connected, which occurs when w/cm is less than ~0.45.
Although accurately measuring the w/cm of hardened concrete is notoriously difficult, a reliable method to do so can provide a significant quality assurance tool for investigating hardened in-place concrete. Fluorescence microscopy provides one solution. Here’s how it works.
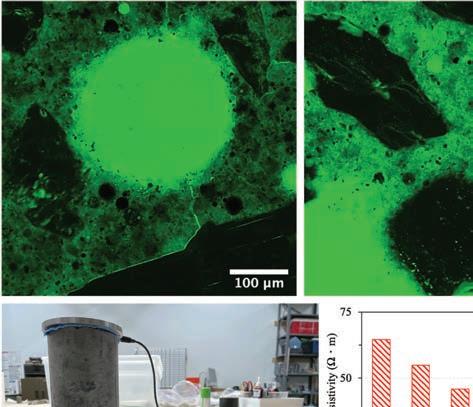
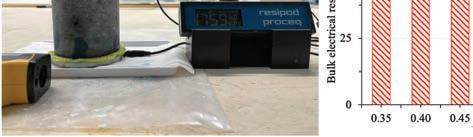
Figure 1. Examples of fluorescent microscope photomicrographs of the paste from concrete with 0.40 w/c (at top left) and 0.60 w/c (at top right). The lower left photo shows the apparatus for measuring bulk resistivity of a concrete cylinder. The lower right graph shows the relationship between bulk resistivity and w/c.
FLUORESCENCE MICROSCOPY & IMAGE ANALYSIS
Fluorescence microscopy is a technique that uses epoxy with a fluorescent dye to illuminate details in a material. Used most commonly in the medical sciences, it has important applications in materials science as well. The systematic application of this method in concrete began in Denmark almost 40 years ago; it was standardized for estimating w/c of hardened concrete in the Nordic Countries in 1991 and updated in 1999.
For measuring w/cm in cementbased materials (i.e. concrete, mortar, and grout), thin sections, or pieces of concrete that measure about 25 microns or 1/1000th of an inch in thickness are made using fluorescent epoxy (figure 2). The process involves cutting tabletshaped pieces of concrete (called billets) that measure about 25 x 50 mm (1 x 2 in.) in area from a concrete core or cylinder. The billets are glued to a glass slide, placed in a vacuum chamber, and epoxy is introduced while under vacuum. As w/cm increases, so does the connectivity and quantity of the capillary pores, so that more epoxy infiltrates the paste. We examine the thin section under the microscope using a special set of filters to excite the fluorescent dye in the epoxy and filter out extraneous signals. In these images black areas represent aggregate particles and unhydrated cement grains, both with essentially 0% porosity, the bright green circles are voids (not pores) that
Figure 2. Fluorescent light photomicrograph of a thin section indicating aggregate particles, voids (v) and paste. The horizontal field width is ~ 1.5 mm. have essentially 100% porosity and the speckled green "stuff" between these features is the paste (figure 2, below). The distinct green color of the paste becomes increasingly brighter as the w/cm and capillary porosity of the concrete increase (see figure 3, page 12).
Image analysis involves the extraction of quantitative data from images. It is used in many different scientific fields, from remote sensing to microscopy. Each pixel in a digital image essentially becomes a data point. This method allows us to attach numbers to the different brightness levels of green seen in these images. With the revolution in desktop computing power and digital image acquisition in the last 20 or so years, image analysis is now an accessible and practical tool for many microscopists, including concrete petrographers. We routinely use image analysis to measure the capillary porosity of the paste and over time have found strong systematic statistical correlations
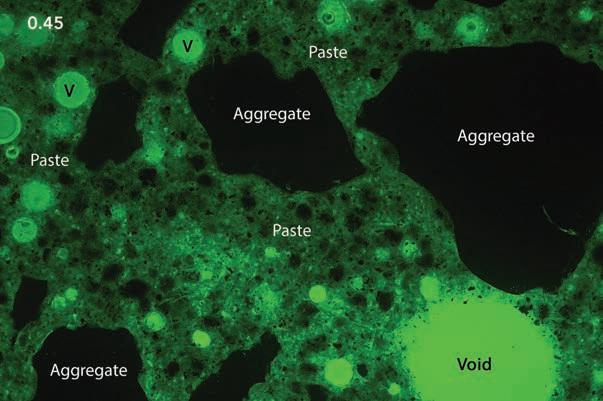
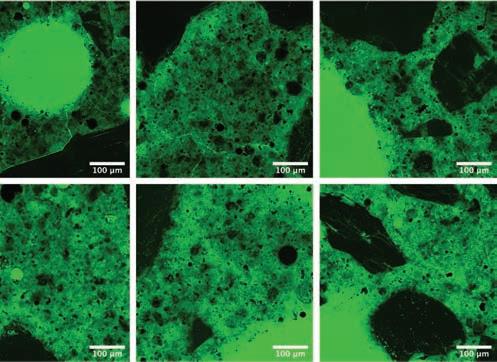
Figure 3. Fluorescent light photomicrographs of thin sections showing progressively brighter green paste with increasing w/ cm. These mixtures are airentrained and contain fly ash. between w/cm and capillary porosity, as shown in figures 4 and 5 (page 13).
PUTTING IT ALL TOGETHER
At the end of the day, demonstrating that concrete in place complies with mix design specifications requires three independent tests. Whenever possible obtain core samples from placements that satisfy all acceptance criteria in addition to samples from placements in question. Cores from accepted placements can serve as control samples that you can use as a benchmark for evaluating the compliance of the placements in question.
The three-step approach: • Perform petrographic examination per
ASTM C856 to verify the components present in the concrete are consistent with mix design parameters. For example, petrography will verify if fly ash or other supplemental pozzolans are present and that the gradation and composition of the aggregate is consistent with the mix design.
Petrographic examination is also essential to verify that the concrete is well consolidated and that curing is adequate and that there is not an excessive amount of microcracking near the surface that could diminish performance and durability. As part of our petrographic work, we measure w/cm using fluorescence microscopy to verify mix design compliance and durability. • Measure the volumetric proportions of paste, aggregate, and air voids per
ASTM C457 and compare them with volumetric proportions indicated by mix design data. One can also compare volumetric proportions between concrete already accepted for the job and the placements that are in question. • Measure bulk electrical resistivity per ASTM C1876 and calculate
Formation Factor if possible.

SAVE UP TO 50% IN LABOR COSTS!
User Friendly
The Kipper KPR-11.5-FFL Finishes closer to edges and penetrations than any other power trowel on the market
Coming in at under 22 Lbs. makes it the lightest and most maneuverable power trowel in the industry


Compare these measurements to verify that the transport properties, and therefore durability, of the questioned placements, are consistent with acceptable placements.
In our experience when reasonable engineers of record see the data obtained from these tests, they are usually amenable to accepting placements provided other key engineering properties (such as compressive strength) are satisfied. By providing quantitative measurements of w/cm and the Formation Factor, we can go above and beyond testing specified for many jobs in showing that the mixtures in question have properties that will translate to good durability.

David Rothstein, Ph.D., P.G., FACI is the principal petrographer for DRP, A Twining Company. Chunyu Qiao, PH.D, the Chief Scientist at DRP, a Twining Company.
References
1. Abrams, D., 1918, Design of Concrete Mixtures, Lewis Institute Structural Materials
Research Laboratory Bulletin I, Chicago, IL. 2. T.C. Powers, L.E. Copeland, H.M. Mann,
Capillary continuity or discontinuity in cement pastes, The Research Bulletin of the
Portland Cement Association 1 (2) (1959) 38–48 Bulletin 110 3. Thaulow N, Damgard-Jensen AD, Chatterji
S, Christensen P, Gudmundsson H (1982)
Estimation of the compressive strength of concrete samples by means of fluorescence microscopy. Nord Betong 26:2–4 4. Concrete, Hardened: Water-Cement Ratio,
NordTest Method NT Build 361, 1991 (2nd
Edition, 1999) 5. Weiss, W.J., Barrett, T.J., Qiao, C., and Todak,
H., 2016, Toward a Specification for Transport
Properties of Concrete Based on the Formation
Factor of a Sealed Specimen, Advances in Civil
Engineering Materials, vol. 5, no. 1; DOI: 10.1520/ACEM20160004 6. Archie, G. E., 1942, “The Electrical Resistivity
Log as an Aid in Determining Some Reservoir
Characteristics,” Petrol. Technol., Vol. 146,
No. 1, pp. 54–62.
Enjoy this article online at
ForConstructionPros. com/21283184.
Figure 4.
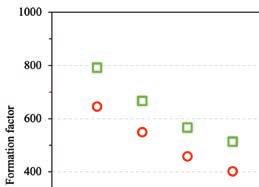
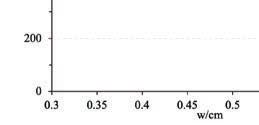
Figure 5.
NEED TO GET A CONCRETE REPAIR PROJECT DONE FAST?


A Hydrodemolition robot can complete the job 25x faster than jackhammers.
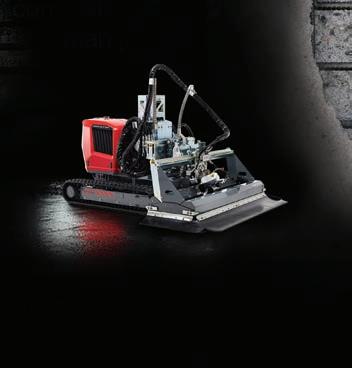
See us with Brokk at booth W703
Distributed by:
Brokk Inc. | Monroe, WA | 1-360-794-1277 | info@brokkinc.com | www.brokk.com


