
23 minute read
EO MARKET
EO MARKET TRENDS
The rest of this report will focus on the key drivers of change impacting the EO industry, including processing, distributing and creating insights from EO data.
Advertisement
Technological
VOLUME OF DATA INCREASING
Operational commercial EO satellites were collecting more than 4 million square kilometres of imagery every day, as recently as 2013 57 . In the next five years ESA spacecraft alone will obtain about 25 petabytes of EO data 58 as a result of the Copernicus programme. Figure 8: Historical trend in ESA’s EO data archives (1986-2010) and future projections
Source: ESA (2013) 59
Some of the key trends driving the significant increase in volume of data include: Figure 9: Number of civilian EO near-polar orbiting satellites launched per year
• Improvements in mission technology – more EO satellites are being launched by developed and emerging space nations, with increased reliability of EO satellite missions contributing to more launches and an upsurge in the volume of EO data collected. Trend towards small satellites – by bringing the cost down and accessibility up, small satellite technologies are lowering the barriers for new entrants to the EO market. Commercial small satellite business models are attracting private funding.
1) Improvements in mission technology The number of satellites orbiting the Earth with an EO mission has increased as a function of reliability and mission longevity 60 , with the average number of satellites launched increasing from approximately 2 in the 1970s to 12 in 2012. The number of failing missions within 3 years of launch has dropped since the 1970s from around 60% to less than 20%, resulting in an extended average mission operational lifespan that is almost 3 times higher today, increasing from 3.3 years to 8.6 years 61 .
Note: The horizontal dotted line represents the average number of launches per decade, respectively: 2 - 1970s; 2.7 – 1980s; 4.8 – 1990s; 7.4 – 2000s; 12 – 2010s

Source: Belward and Skøien (2014), in International Society for Photogrammetry and Remote Sensing, Inc. (ISPRS)
Today there are around 35 sovereign states that own and/or operate their own EO satellites, with the leading space agencies (NASA, ESA and the Japan Aerospace Exploration Agency (JAXA)) still playing a pivotal role in this sector. The US has the highest number of EO missions (almost one third of all the successful missions to date), followed by Russia (14%). New players are also emerging, such as Algeria, Malaysia, Nigeria, Turkey, Thailand, South Africa and Vietnam 62 .
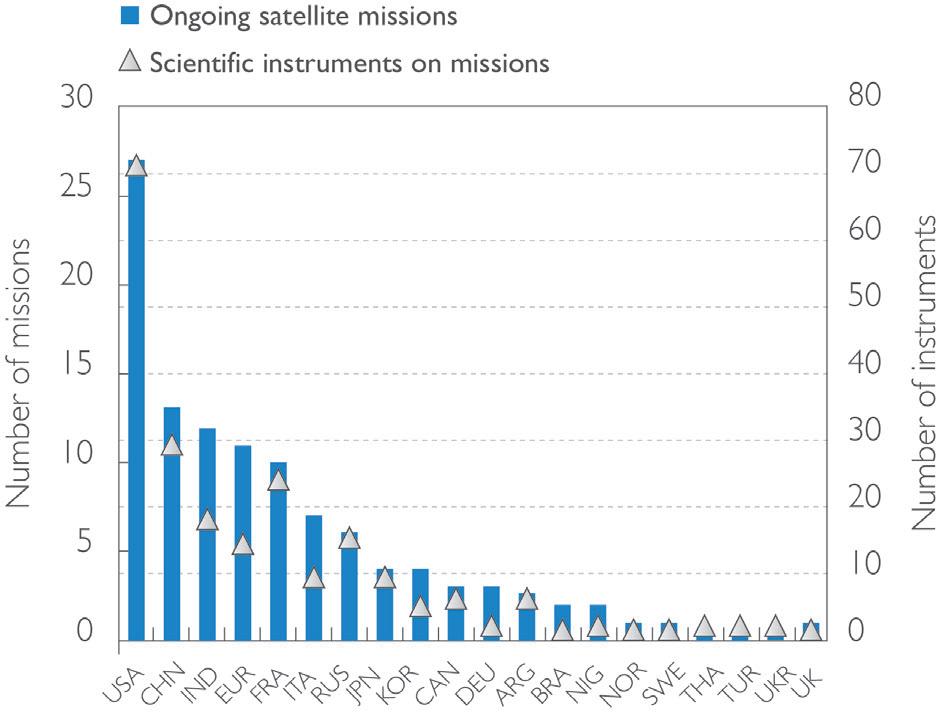
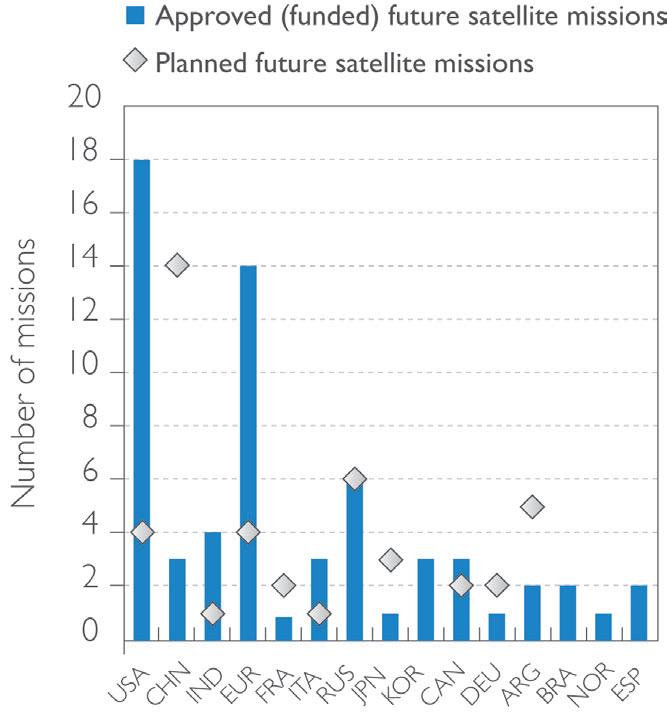
Figure 10: Selected on-going and planned institutional EO missions by civilian agencies Indicator of Trends Report
on increasing the supply of quality EO data, is driving a forecast of 2,000-2,750 small satellites to be launched from 2014-2020, more than four times the number launched in the 2000-2012 period 63 . Through constellations of small satellites, new entrants like Planet Labs aim to image the entire Earth, daily. The company, which operates the largest ever fleet of earth-imaging satellites 64 , has already launched 71 nano-satellites to date 65 .
Miniaturisation of technology, standardisation and reduced launch costs are driving increased interest in small, micro and nano-satellites 66 . The most likely domain to be disrupted by the small mission technology trend is EO - over half of future nano/microsatellites will be used for EO and remote sensing purposes (compared to 12% from 2009 to 2013), with the commercial sector contributing 56% of nano/microsatellites over the next three years 67 .

Figure 11: Nano and micro-satellite trends by purpose
Source: OECD calculations based on Committee on Earth Observation Satellites (CEOS) (2013)
2) Trend towards small satellites The adoption of constellations by new businesses intent
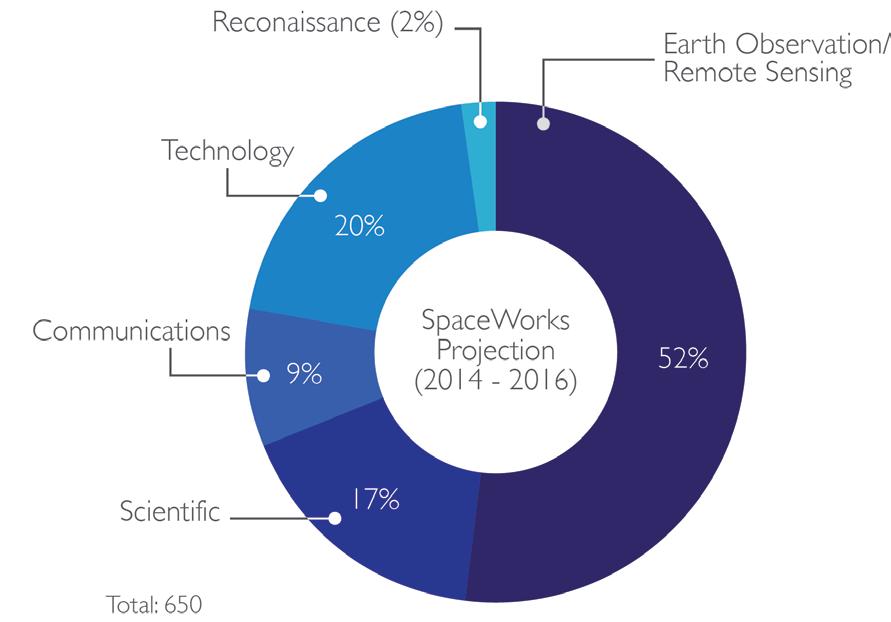
Source: SpaceWorks (2014) 68
59 ESA (2012) Long term data preservation: status of activities and future ESA programme, see www.earth.esa.int/gscb/papers/2012/8-LTDP_activities_future.pdf retrieved on 10th February 2015 60-61 Belward and Skøien (2014) Who launched what, when and why; trends in global land-cover observation capacity from civilian earth observation satellites, in International Society for Photogrammetry and Remote Sensing, Inc. (ISPRS) 62 Jayaraman, V. (2014) Global Perspective on Earth Observation: Emerging Trends & Policy Challenges, Indian Space Research Organisation (ISRO), see www.ucsusa.org/ nuclear_weapons_and_global_security/solutions/space-weapons/ucs-satellite-database.html#.VLfuHyusVUU retrieved on 9th February 2015 63 SpaceWorks (2014) Trends in Average Spacecraft Launch Mass 64 Planet Labs website (2014) see www.planet.com/solutions/ retrieved on 9th February 2015 65 Planet Labs website (2014) see www.planet.com/pulse/watch-28-satellites-launch/ retrieved on 10th February 2015 66 Generally accepted definition of satellite classes: small-satellites from 500kg to 100kg, micro-satellites from 100kg to 10kg, nano-satellites from 10kg to 1kg, pico-satellites less than 1kg 67-68 SpaceWorks (2014) Trends in Average Spacecraft Launch Mass
Improvements in on-board sensors are driving the increase in variety and quality of data from EO satellites. Since the 1970s there has been an improvement in spatial resolution from around 80 metres to less than 1 metre for multispectral, and less than half a meter for panchromatic 69 . Synthetic Aperture Radar (SAR) resolution has also improved, from 25 metres in 1978 to 25 centimetres in 2013 70 . Recent developments have allowed EO optical satellites to reach sub-meter resolution with Surrey Satellite Technology Limited’s (SSTL) 300 S1 platform 71 .
More capable on-board storage, faster downlink and better reliability are characteristics of satellites being built today. Examples that highlight these trends include: • modularity and open-architecture for expansion of existing clusters of satellites; • inter-satellite connectivity advancements are pinpointing distributed on-board processing and advanced data routing protocols enhancement; and • reconfigurable on-board electronics enable upgrades to the satellite’s software system after launch has occurred 72 .
Data Timeliness - Having timely access to imagery from the Sentinel-1 mission, for example, is essential for numerous applications such as maritime safety and helping to respond to natural disasters. Orbiting from pole to pole about 700 km up, Sentinel-1A transmits data to Earth routinely, but only when it passes over its ground stations in Europe. However, geostationary satellites, hovering 36,000 km above Earth, have their ground stations in permanent view so they can stream data to Earth all the time. Creating a link between the two kinds of satellites means that more information can be streamed to Earth, and almost continuously. Engineers have turned to laser to accomplish this. Marking a first in space, Sentinel-1A and Alphasat have linked up by laser stretching almost 36,000 km across space to deliver images of Earth just moments after they were captured. This important step demonstrates the potential of Europe’s new space data highway to relay large volumes of data very quickly so that information from Earth-observing missions can be even more readily available.
A number of on-board EO satellite technologies are improving the quality of data collected, including:
• Synthetic Aperture Radar (SAR) - Synthetic Aperture Radar (SAR) is a radar system that generates high-resolution remote sensing imagery. Their higher weather resilience make SAR sensors particularly suitable for environmental monitoring. • Multispectral and Hyperspectral sensors - Multispectral and Hyperspectral sensors involve the acquisition of visible, near infrared, short-wave infrared and thermal infrared images in several broad wavelength bands. Their capability to distinguish specific materials’ characteristics allow them to be used in applications ranging from mineralogy to farming. • Deployable optics - Deployable optics can extend the satellite optical payloads’ capabilities beyond the wavelength limit allowed by the satellite’s physical dimensions.
1) Synthetic Aperture Radar (SAR) SAR is an active microwave sensor that can provide images of the earth at high spatial resolutions. The microwave region of the electromagnetic spectrum is defined by wavelengths ranging from 1 centimetre to 1 metre 73 . SAR data provides, in simplified terms, all-day, “all-weather” 74 imaging capabilities. SAR sensors can operate irrespective of cloud cover and day light exposure - two considerable limitations of EO optical sensors. SAR data can be utilised in a number of applications, including 75 :
• Precision agriculture • Maritime surveillance • Disaster monitoring and early detection • Glacier, sea, lake and river ice monitoring; and • Cartography.
2) Multispectral and Hyperspectral sensors Multispectral sensors acquire visible, near infrared, shortwave and thermal infrared images in several broad
69-70 Belward and Skøien (2014) Who launched what, when and why; trends in global land-cover observation capacity from civilian earth observation satellites, in International Society for Photogrammetry and Remote Sensing, Inc. (ISPRS) 71 Surrey Satellite Technology Ltd (SSTL) SSTL 300 S1, see www.sstl.co.uk/Downloads/Datasheets/SSTL-300-S1-Datasheet-pdf retrieved on 9th February 2015 72 Frost & Sullivan (2014) Space Mega Trends, Key Trends and Implications to 2030 and Beyond 73 Sengupta, M. and Dalwani, R. (2008) Potential Applications of Multi-Parametric Synthetic Aperture Radar (Sar) Data in Wetland Inventory, see www.academia. edu/9024355/Potential_Applications_of_Multi-Para_metric_Synthetic_Aperture_Radar_Sar_Data_in_Wetland_Inventory_A_Case_Study_of_Keoladeo_National_ Park_A_World_Heritage_and_Ramsar_Site_Bharatpur_India retrieved on 9th February 2015 74 Noting that certain weather conditions, such as severe thunderstorms, can cause losses of data in the shorter wavelengths (e.g. x-band) 75 Holecz, F. et al (2014) Land Applications of Radar Remote Sensing, see www.intechopen.com/books/land-applications-of-radar-remote-sensing retrieved on 5th February 2015. 76 ESA website (2014) see www.esa.int/Our_Activities/Space_Engineering_Technology/Hyperspectral_imaging_by_CubeSat_on_the_way retrieved on 4th February 2015
Figure 13: Current and planned EO missions with Hyperspectral data capabilities Source: Northern Sky Research (2013)
Figure 14: 3U CubeSat with deployable optics payload wavelength bands to reveal ‘spectral signatures’ of particular features, such as crops or materials 76 . Hyperspectral sensors can enhance these capabilities by ‘dividing up’ the light they receive into over one hundred contiguous spectral bands. As materials absorb and then reflect at different wavelengths, multispectral and hyperspectral sensors can identify and distinguish between materials by detecting their spectral reflectance signatures. With commercial high-resolution satellites that can measure the Earth in sixteen optical bands, there are opportunities to provide valuable data for mineral exploration, precision farming and agricultural support services 77 . A number of planned EO missions in the coming years will make multispectral and hyperspectral data available, thus expanding their potential for providing value-added EO services 78 . 3) Deployable optics Deployable optics provide the benefits of a satellite optical payload at a much longer wavelength than is permitted by a satellite’s physical dimensions. This technology can extend the capabilities of the small satellite segment. Research and development activities have started to demonstrate that this capability can be extended with the adoption of optical mirror segments and metering structures 79 .

Figure 12: Multispectral sensors on board near-polar orbiting EO civilian satellites, per year

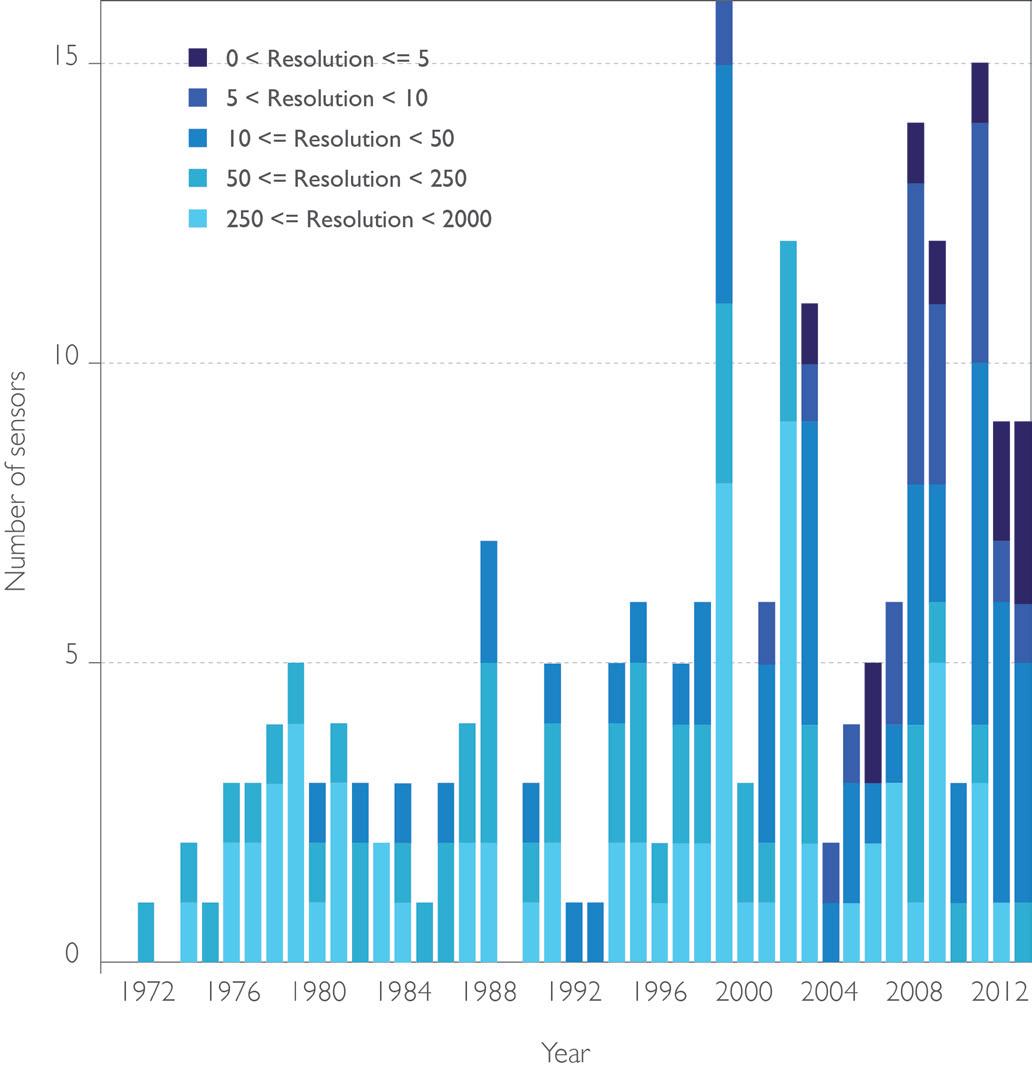
Source: Belward and Skøien (2014), in International Society for Photogrammetry and Remote Sensing, Inc. (ISPRS) Source: UK Astronomy Technology Centre (STFC) (2014)
DATA SOURCES DIVERSIFYING
End users of downstream applications and services are becoming more data source agnostic than ever before and are exposed to ever larger data sets. At the same time the innovation in cloud-computing, which offers unprecedented capabilities for large data processing and analysis, is creating the opportunity to capture increased volume and intelligence from the data. Combining satellite and UAV sources, for example, often generates complementary data that can be enriched through processing and analysis.
77 Sabins, F. (1999) Remote sensing for mineral exploration, Ore Geology Reviews, see www.sciencedirect.com/science/article/pii/S0169136899000074 retrieved on 3rd February 2015 78 Northern Sky Research (2013) Satellite-Based Earth Observation, 5th Edition 79 Champagne et al (2014) CubeSat Image Resolution Capabilities with Deployable Optics and Current Imaging Technology, see www.digitalcommons.usu.edu/cgi/ viewcontent.cgi?article=3059&context=smallsat retrieved on 2nd February 2015
To illustrate this point, the Facebook-backed not-for-profit, internet.org, aims to change the way in which the internet is distributed, so that the 2/3 of the world’s population that don’t currently have internet access can be included and reap the benefits that the internet brings. Through its Connectivity Lab, Facebook is investigating using a combination of satellites, solar powered UAVs and lasers to tie these solutions together. In early 2014, Facebook acquired UK based SME Ascenta, for a reported $20m 80 , to employ the company’s expertise in developing high altitude solar powered UAV technology and thereby strengthen its internet.org plan 81 .
In the EO market end users and processers of data are increasingly agnostic in terms of the data source, so long as it meets their requirements. The combination of satellite, UAV and other aerial sources can provide large volumes of data that can be cross-referenced and utilised for more efficient analysis and application. There is a role for UAVs to play in the EO market given their more agile tasking ability and potential for persistent monitoring in comparison with satellites. The miniaturisation of remote sensing instruments is converging with the increasing payload capabilities of the UAV market, enabling a whole new range of applications and services for markets like disaster relief, agriculture, mining, mobile and fixed communications and maritime surveillance. UAVs can provide greater spatial resolution than satellites, have a shorter data delivery lag and their payload capabilities are becoming more flexible 82 . UAV imaging capabilities are also improving in terms of SAR and hyperspectral imaging sensors.
“This combined UAV and satellite approach will be a game-changer” - Sam Adlen (2015), Head of Business Innovation, Satellite Applications Catapult
NEW BUSINESS MODELS GENERATING ACTIONABLE INSIGHTS
New entrants to the EO sector, including Skybox Imaging, Planet Labs and Spire, are opening their data to developers and end-users through APIs. APIs can make it easier to access EO data and to extract the embedded value. Planet Labs has announced that it will release a developer API this year 83 , while Skybox Imaging is already allowing external algorithms to run on its data and infrastructure by downloading a Software Development Kit 84 .
Business models are also emerging to develop a more integrated network of stakeholders. CloudEO, a German company that supplies EO data on a payper-use or subscription basis 85 , aims to bring together imagery providers, analytics companies and customers through one platform. In order to attract and expand the user community beyond the boundaries of EO, the development of semantic search structures can play a pivotal role in reaching new users. The GEOinformation for Sustainable Development Spatial Data Infrastructure (GEOSUD SDI) is one example of this 86 .
Among the new products and services that are being developed, EO video data products are worth highlighting. Enabled by more frequent revisit times of EO satellite constellations, these products have the potential to improve the value proposition of a satellite data provider in applications such as disaster relief, surveillance and other applications that could benefit from real-time monitoring 87 . Canadian company, UrtheCast, has been granted the exclusive right to operate two cameras on the Russian module of the International Space Station (ISS) 88 . As the ISS passes over the Earth, UrtheCast’s twin cameras capture and download large amounts of HD (5 metre resolution) video and photos. This data is then stored and made available via APIs on the basis of a payfor-use model 89 . One of the innovative characteristics of UrtheCast’s business model is the way it approaches the revenue streams it can tap into, for example by providing Indicator of Trends Report
videos free of charge and generating an online advertisinglike revenue from companies that will have their logos featured on the video in relation to their locations 90 .
THEMATIC PLATFORMS
The platform model creates a community and within this user community it is possible to leverage the combined effort of a network of developers. The focus on leveraging existing cloud infrastructure investment and making it easier to discover, access and process EO datasets in the cloud will help to drive increased adoption of EO data in applications. A paradigm shift has occurred in the way big data is processed and distributed - now the “computations” move to the “data”, and not the data to the users. In return, the new way of exploiting big data is driving new requirements and innovation for the data infrastructure. Such technologies are leading to the emergence of an ecosystem of Thematic Exploitation Platforms (TEPs), capitalising on co-location of computing resources and data storage, such as the Super Site Exploitation Platform (SSEP) in ESA. The platform was developed in close collaboration with, among others, NASA, JAXA and the National Science Foundation (NSF). The aim is to provide tools and services that can help the EO community in exploiting EO data, assist researchers in developing applications and facilitate service providers in generating value added information 91 .
The Data Cube in Australia is another example of a TEP. It provides Landsat, Terra (and soon Sentinel data) that dates back to 1979 and covers the whole of Australia and some surrounding countries. It is a way of organising satellite data and ensuring every pixel and image is a measurement of change over time. The Data Cube puts EO data into a high performance computing (HPC) environment where it can be accessed and used more effectively. Users can do their work on the data via the platform, rather than downloading and taking copies of the data. The aim is to move away from data processing and preparation for users and put that in the power of the user through creation of algorithms, for example.
83 Planet Labs website, see www.planet.com/flock1/ retrieved on 29th January 2015 84 Skybox Imaging website, see www.skyboximaging.com/products/analytics retrieved on 29th January 2015 85 Henry, C. (2014) CloudEO Starts ‘Virtual Constellation’ Access with Beta Online Marketplace, see www.satellitetoday.com/technology/2014/03/26/cloudeo-starts-virtual-constellation-access-with-beta-online-marketplace/ retrieved on 28th January 2015 86 M. Kazmierski et al (2014) GEOSUD SDI: accessing Earth Observation data collections with semantic-based services, see www.agile-online.org/Conference_Paper/cds/ agile_2014/agile2014_138.pdf retrieved on 19th January 2015 87 Northern Sky Research (2013) Satellite-Based Earth Observation, 5th Edition 88 UrtheCast (2013), see www.investors.urthecast.com/interactive/lookandfeel/4388192/UrtheCast-Investor-Deck.pdf retrieved on 29th January 2015 89 IAC (2014) UrtheCast is #DisruptiveTech, Onwards and Upwards Blog, see www.blog.nicholaskellett.com/2014/10/03/iac-2014-urthecast-is-disruptivetech/ retrieved on 19th January 2015 90 UstreamTV (2012) UrtheCast Business Model, see www.ustream.tv/recorded/26973814 retrieved on 19th January 2015 91 Loekken, S. and Farres, J. (2013) ESA Earth Observation Big Data R&D Past, Present, & Future Activities, Earth Observation Programmes Directorate, ESA
More is being done to pool EO resources. The Group on Earth Observations (GEO) is a voluntary partnership between 90 countries, the European Commission, and 77 intergovernmental, international, and regional organisations that share EO data and science 92 . This partnership has combined efforts to build a Global Earth Observation System of Systems (GEOSS), which pools several EO datasets, making them available online 93 .
EO VALUE CHAIN - SECTOR SEGMENTATION
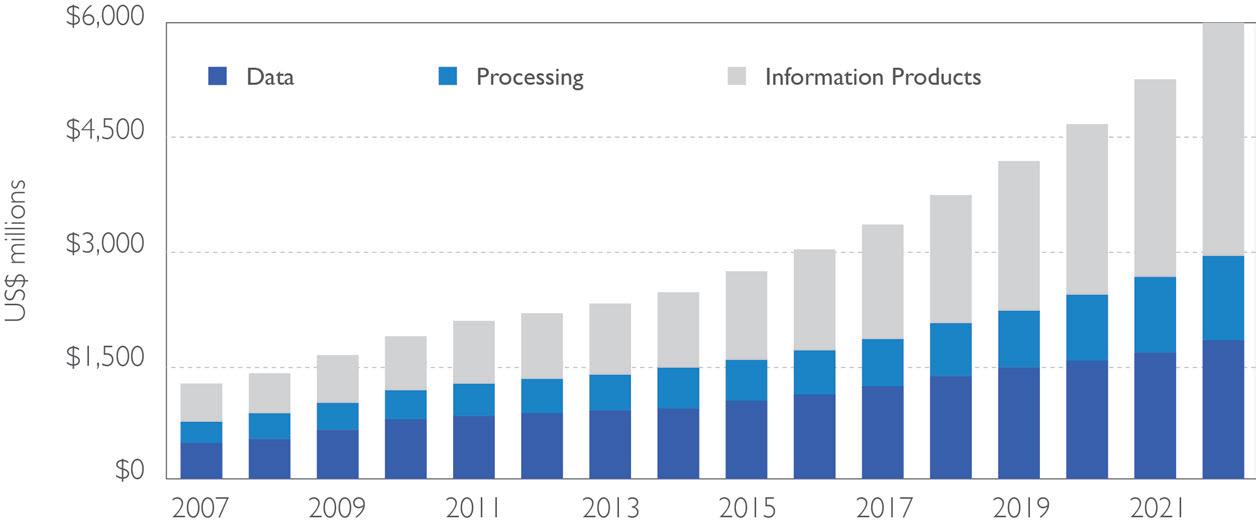
In 2012, the global space-based EO market was estimated to be worth €1.8 billion 94 . The segment with the greatest potential is valueadded/information products. A report by Northern Sky Research has forecast that this area will grow to €2.5 billion between 2012 and 2022. The EO data sales segment will represent less than a third of the EO sector’s overall global revenues, while information products will represent more than half of the total 95 . Figure 15: EO market size by segment
Source: Northern Sky Research (2013)
Figure 16: EO sector market verticals: value projection to 2022

Source: Northern Sky Research (2013)
This forecast is in line with recent developments in the EO sector, namely:
• volume and quality of EO datasets is increasing; • data processing and storage capabilities are improving both in terms of performance and affordability; and • proliferation of devices and sensors is expanding the range of data sources.
The EO sector has delivered value to a large array of market verticals, ranging from Defence and Intelligence to Living Resources, and several sources are predicting sustained growth in these markets.
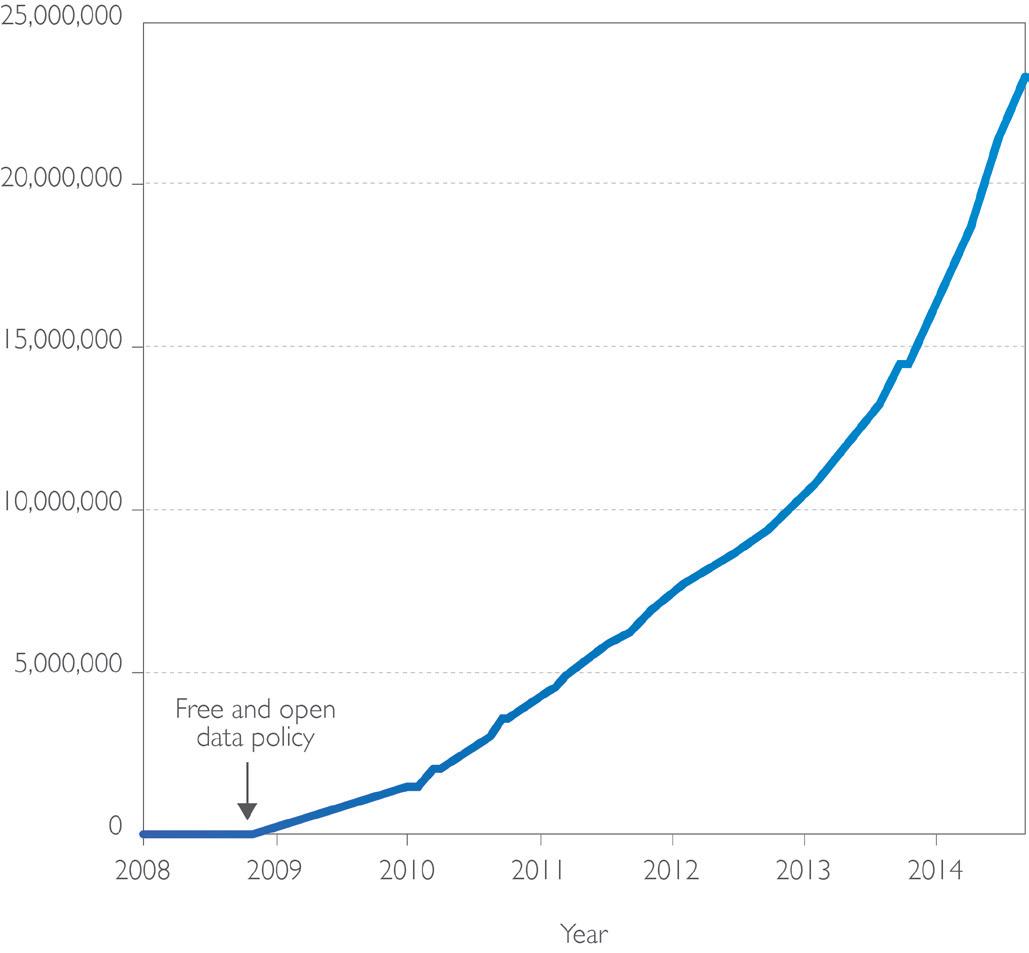
Figure 17: Landsat images downloaded from USGS EROS Centre (cumulative data) Cultural
ACCESS TO DATA POLICY “Data can be equated with money that has value only if it is used and circulated. 96 ” - Partnership for Advanced Data in Europe (PARADE) (2009) There is a trend towards an open data sharing policy and certain organisations are naturally positioned to collect and store large volumes of data, for example public sector bodies. These organisations have to produce, collect and distribute a large variety of information, ranging from business and economic data and statistics, to geographic and meteorological information. Copernicus programme The Copernicus programme (formerly known as GMES) is a European system for monitoring the Earth, co-ordinated and managed by the European Commission. It consists of a complex set of systems that collect data from multiple sources, including EO satellites, in situ sensors (e.g. ground stations, airborne and sea-borne sensors) 97 . It will ensure the regular observation and monitoring of our planet and will provide users with reliable and up-to-date information via services that address six thematic areas: land, marine, atmosphere, climate change, emergency management and security. Datasets will be open and accessible to any citizen with one of the main objectives of the programme being 98 : 2030 100 . Lessons can also be learned from the Brazil-China CBERS and US Landsat programmes, both of which have shown that after distributing the datasets free for several years, strong user growth has been achieved 101 . According to a 2013 U.S. Geological Survey (USGS) report, in 2011, the economic benefit from Landsat imagery obtained from EROS (Earth Resources Observation and Science) was estimated to be just over $1.79 billion for U.S. users and almost $400 million for international users, resulting in a total annual economic benefit of $2.19 billion. This estimate does not include benefits from reuse of the imagery after it has been obtained from EROS or from the use of value-added products based on Landsat imagery. Landsat programme The Landsat programme provides the longest continuous space-based record of Earth’s land in existence. Since 2008 imagery has been made available free of charge to users and the rate of downloads has increased significantly as a result 102 . EO data is no different to other data sources - if not used and circulated their value cannot be captured fully.
“To create massive business opportunities for European companies, in particular SMEs, to boost innovation and employment in Europe 99 ”
SpaceTec analysed the potential impact of the Copernicus programme on the EO midstream sector (defined as the market segment made up of companies that sell or distribute EO data) and concluded that there would be between €560 million and €635 million worth of positive externalities on the employment market during 2014-
Source: Northern Sky Research (2013)
96 Koski, K. et al (2009) Strategy for a European Data Infrastructure: White Paper, see www.grdi2020.eu/Pages/SelectedDocument.aspx?id_documento=a852120d-5f20- 4fce-b758-0416c01fbb56 retrieved on 6th January 2015 97 ESA website, see www.copernicus.eu/pages-principales/overview/copernicus-in-brief/ retrieved on 9th February 2015 98 ESA website, see www.copernicus.eu/pages-principales/overview/faqs/ retrieved on 9th February 2015 99 European Commission (2012) GMES/Copernicus – monitoring our earth from space, good for jobs, good for the environment, see www.europa.eu/rapid/press-release_ MEMO-12-966_en.htm retrieved on 2nd February 2015 100 SpaceTec Partners (2013) European Earth Observation and Copernicus Midstream Market Study 101 Northern Sky Research (2013) Satellite-Based Earth Observation, 5th Edition 102 National Geospatial Advisory Committee Landsat Advisory Group (2014) The Value Proposition for Landsat Applications, see www.fgdc.gov/ngac/meetings/december-2014/ngac-landsat-economic-value-paper-2014-update.pdf retrieved on 9th February 2015
Figure 18: Average price per square km of main commercial EO products and Copernicus programme impact The cumulative savings achieved are estimated to be between $350 million and $436 million per year for Federal and State governments, NGO’s and the private sector 103 . More EO data available leads to greater use of datasets, which in turn enables developers and entrepreneurs to approach data analysis from different and previously unexplored perspectives. The Climate Corporation (Climate Corp), recently acquired by global agri-company Monsanto for close to $1 Billion 104 , sells customised weather insurance policies to US farmers alongside a number of advisory services aimed at increasing crop yields. Climate Corp’s development started from the collection of freely available datasets, including Landsat images and topography maps from the US Geological Service 105 . • very high resolution (VHR) (sub-metre); • high resolution (HR) (between 1 metre and 2.5 metres); and • medium resolution (MR) and low resolution (LR) (above 2.6 metres). The trend towards increased availability of free EO data through programmes like Landsat and Copernicus will mainly address the MR and LR segments, with commercial operators focusing on the HR and VHR data market 107 .
DATA PRICE REDUCTION

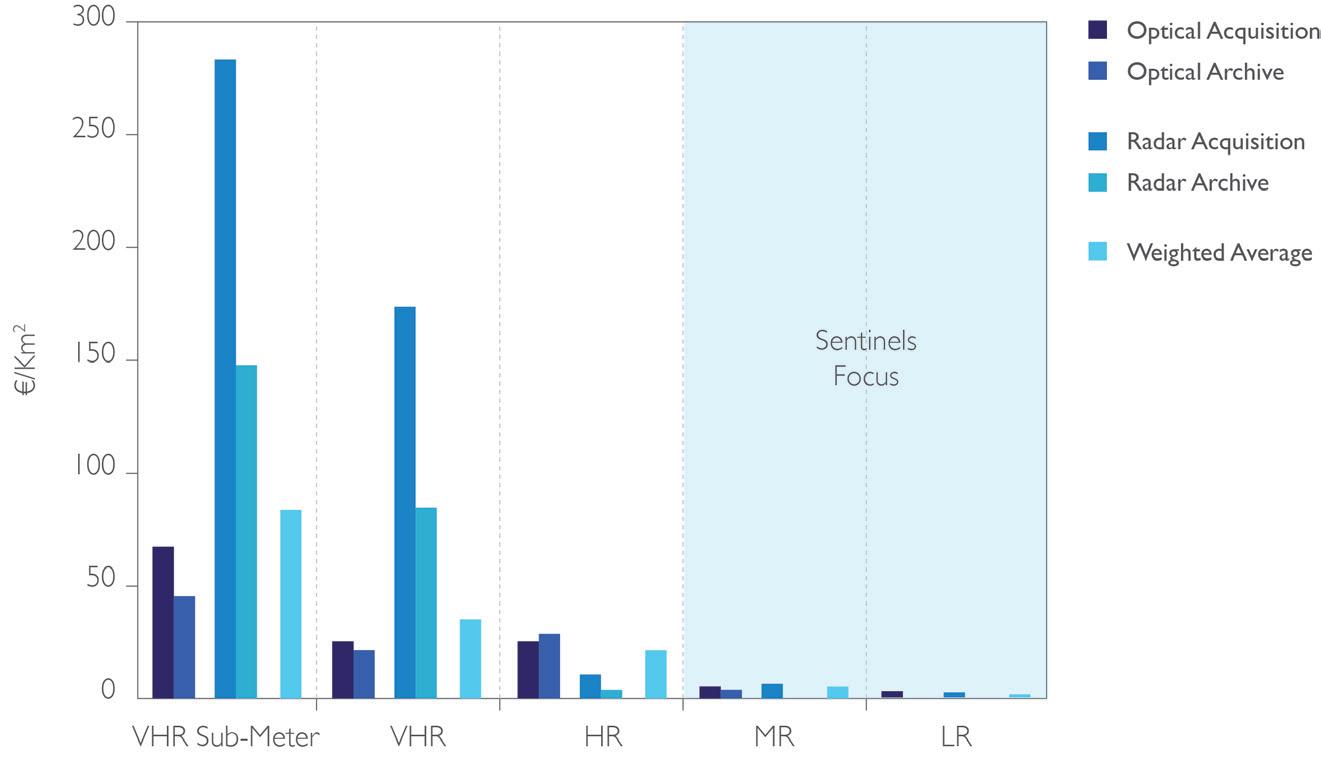
Figure 19: HR data price forecasts Source: EARSC (2012) – Public company data, STP analysis
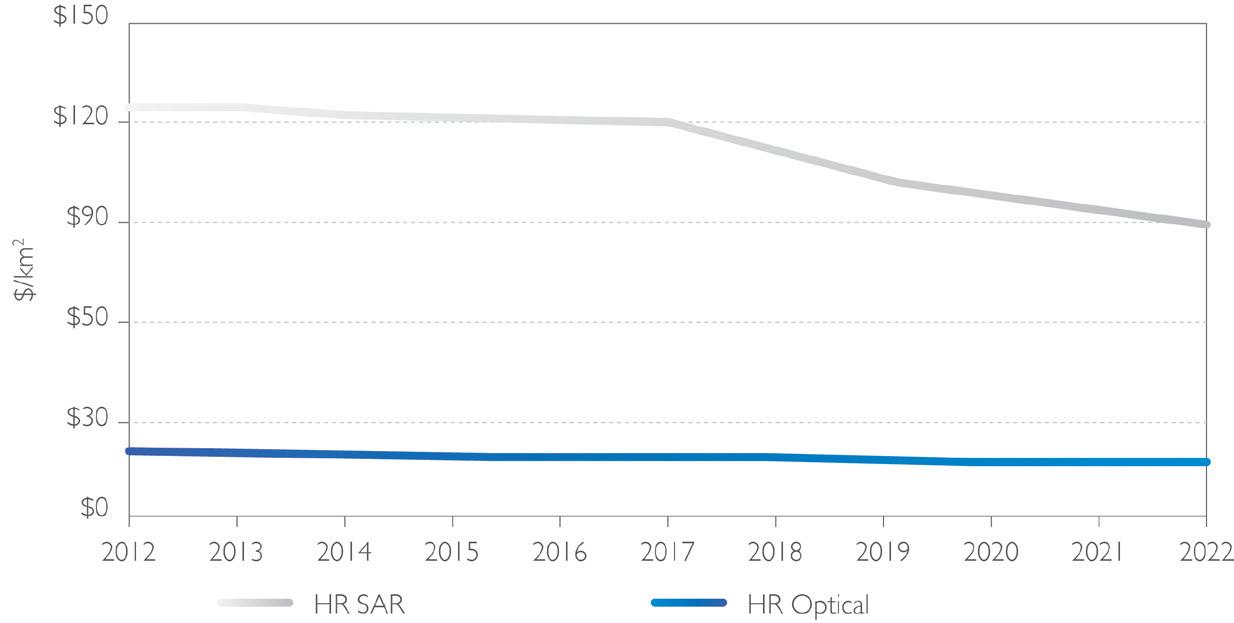
Note: prices are indicated as $ per sq km. Source: Northern Sky Research (2013) Commercially available EO data has been experiencing a sustained decrease in price over time and this trend is expected to continue. One of the main drivers of this price reduction is growth in the supply of EO data - determined by the increased number of EO missions launched worldwide, free and open data policies and new market entrants. Planet Labs, for example, will offer a tiered pricing system as well as a ‘freemium’ model. In an interview with Forbes in 2014, Robbie Schingler, cofounder of Planet Labs said: “If you are a small farmer in Mozambique and you’re only looking at a hectare of data, take it. If you are a commodity trader looking at the Kenyan crop and you’re looking at millions of hectares, we have a different pricing structure. This allows us to ensure the democratisation of data 106 .” EO data pricing itself is determined by a number of different factors, including: • technical parameters and capabilities of data - ground and spectral resolutions, revisit time, accuracy and geographic area coverage; • region of data sale - commercial operators can decide to apply different data pricing policies in different regions. Price dynamics can be better analysed when categorised into three main resolution segments: High Resolution (HR) and Very High Resolution (VHR) In June 2014 the US Government announced that restrictions on EO data sales were to be lifted - imagery from satellites with a resolution of sub-50cm can now be sold 108 . Recent analysis estimates the EO data segment will grow by close to €780 million in the next 10 years and that most of this growth will come from the HR segment, accounting for more than €740 million 109 . The HR segment has grown strongly in the last few years, its global market share within the EO data market increased from 58.9% in 2007 to 74.8% in 2012 110 . HR EO data prices are expected to remain relatively high (SAR data in particular) 111 .
Source: Northern Sky Research (2013)
Figure 21: EO satellites: spatial resolution vs. revisit time Indicator of Trends Report
Low Resolution (LR) It is expected that free access to EO data will have the most impact on this segment of the EO data market. Commercial value will be determined by the capability of the private players in this segment to offer additional services. New players using small satellite constellations are aiming to differentiate their offering with more frequent revisits. They are challenging existing revisit times offered by EO commercial operators and moving from an existing multi day revisit time to a daily revisit time. These new market entrants include Skybox Imaging with its SkySat satellite and Planet Labs, with its Flock satellite constellation.

Source: Satellite Applications Catapult (2014)
103 National Geospatial Advisory Committee Landsat Advisory Group (2014) The Value Proposition for Landsat Applications, see www.fgdc.gov/ngac/meetings/december-2014/ngac-landsat-economic-value-paper-2014-update.pdf retrieved on 9th February 2015 104 Forbes (2013) see www.forbes.com/sites/bruceupbin/2013/10/02/monsanto-buys-climate-corp-for-930-million/ retrieved on 2nd February 2015 105 University of Washington (2014) The Climate Corporation’s hyper-local weather insurance, see www.conservationmagazine.org/2014/07/the-climate-corporations-hyper-local-weather-insurance/ retrieved on 30th January 2015 106 Forbes website (2014), This Radical Satellite Startup is Democratizing Space, see www.forbes.com/sites/joshwolfe/2014/04/02/this-radical-satellite-startup-is-democratizing-space-video/ retrieved on 17th March 2015 107 Euroconsult (2012) Satellite-Based Earth Observation: Market Prospects to 2021 108 BBC News (2014) see www.bbc.co.uk/news/technology-27868703 retrieved on 9th February 2015 109-110-111 Northern Sky Research (2013) Satellite-Based Earth Observation, 5th Edition


