

Australia’s most trusted & innovative property group ADVISORY. RESEARCH. VALUATIONS. PROJECTS. Local Market Intelligence Residential Market Overview Clyde North March 2023 charterkc.com.au

Melbourne is a city of international significance. It has long been ranked in the top ten of the world’s most liveable cities, including number one from 2011-2017.
Melbourne contains two universities ranked in the top 100 global universities.
Victoria, Australia’s second-largest economy, grew by +5.6% over FY21/22 as it rebounded from the pandemic.
Victoria’s economy performed remarkably well following the extended lockdowns over 2020 and 2021. The unemployment rate in Victoria as at Jan 2023 was 3.8%. This represents a significant contraction since the peak levels observed during the pandemic.
Prior to the onset of the Covid-19 pandemic, Victoria was the fastest-growing state in Australia, leading the nation in population growth since 2015. Strong population growth was underpinned by high volumes of Net Overseas Migration (NOM).
The onset of the Covid-19 pandemic saw international borders close and NOM fall substantially. This severely limited Victoria’s population growth over 2020 and into 2021.
Victoria’s NOM has rebounded strongly and is poised to return as a key driver of housing demand across the state. Importantly, Melbourne is forecast to once again become Australia’s fastest growing Capital City by 2023/24.
Detached housing is the predominant form of housing stock in Melbourne. Policy aspirations however aim to achieve greater levels of higher density dwellings to accommodate future population growth.
House price growth in Melbourne has been high over the last two decades which has supported the development of higherdensity stock. Despite the headwinds of the Covid-19 pandemic, prices remained resilient and demonstrated robust growth.
Melbourne continues to remain the leading supplier of new greenfield lots across Australia with an average of 19,500 annual lot sales recorded over the past decade.
Liveability
Most Liveable Cities
(Ranked 1st 7 Consecutive Times, 2011-2017)
Economic Activity
+5.6% +3.6%
(Victorian Economic Growth FY21-FY22) (Australian Economic Growth FY21-FY22)
Victoria Population Growth Population (June 2022) Annual Change (2021-2022)
6,613,727 +1.0%
Future Housing Requirements
1.57 million Dwellings
Metropolitan Melbourne’s Requirements 2016 - 2051
Existing Housing Composition
Education
2 Universities in the Top 100 Global Universities
(University of Melbourne = 34th and Monash University = 44th)
Unemployment Rate
3.8%

January 2023 (Down from 4.1% in Jan 2022)
Components of Annual Population Growth
Overseas Migration Rebound
(55,631 – Net Overseas Migration, -17,233 - Net Interstate Migration, 29,014 - Natural Increase)
Melbourne Population Outlook Fastest Growing City by 23/24
(Australian Government - Centre for Population Annual Population Statement 2022)
Composition of Future Housing Supply 31% : 36% : 34%
(Higher Density) :(Medium Density):(Detached Houses) (2011-2051)
Greenfield Lot Sales
19,500 Annual Lot Sales
(2013 - 2022) Metropolitan Melbourne
*Refer to end of report for all sources used in compiling this report.
AFFORDABILITY: Clyde North offers an affordable alternative when compared to the broader metropolitan Melbourne region
CONNECTIVITY: Clyde North is located close to key arterial roads and public transport nodes.

AMENITY: Clyde North is complemented by its proximity to amenity including a number of retail precincts, recreational areas and educational institutions
$738,000 & $875,000
Clyde North & Berwick 2022 median house price (Metro Melbourne = $875,000)
+9.0% p.a.
Clyde North 3-year average annual house price growth (Metro Melbourne = +7.0% p.a.)
+5.5% p.a.
Clyde North 3-year average annual house rent growth (Metro Melbourne +3.1% p.a.)
(See page 2 for more info.)

» Clyde North is a suburb within the City of Casey Local Government Area (LGA), located approximately 43km south-east of the Melbourne CBD.

» Significant residential development in Clyde North first began in the mid 2010s. Prior to then, the area was an undeveloped rural locality mostly comprising farmland.
» Clyde North has the advantage of having not been affected by the legacy of older generation facilities and is representative of a new suburb which, of itself, has strong market appeal to a wide range of future homeowners.
» Clyde North is predominantly a residential suburb, with small pockets of retail activity located throughout. Much of the suburb is presently undeveloped but will support additional housing over the coming years.
25 – 44 year-olds
The predominant age cohort across Clyde North accounting for 41% of all residents.

Largest household type across Clyde North accounting for 59% of all households
Younger age demographic than metropolitan Melbourne (Metro Melbourne = 37 years)
(See page 3 for more info.)
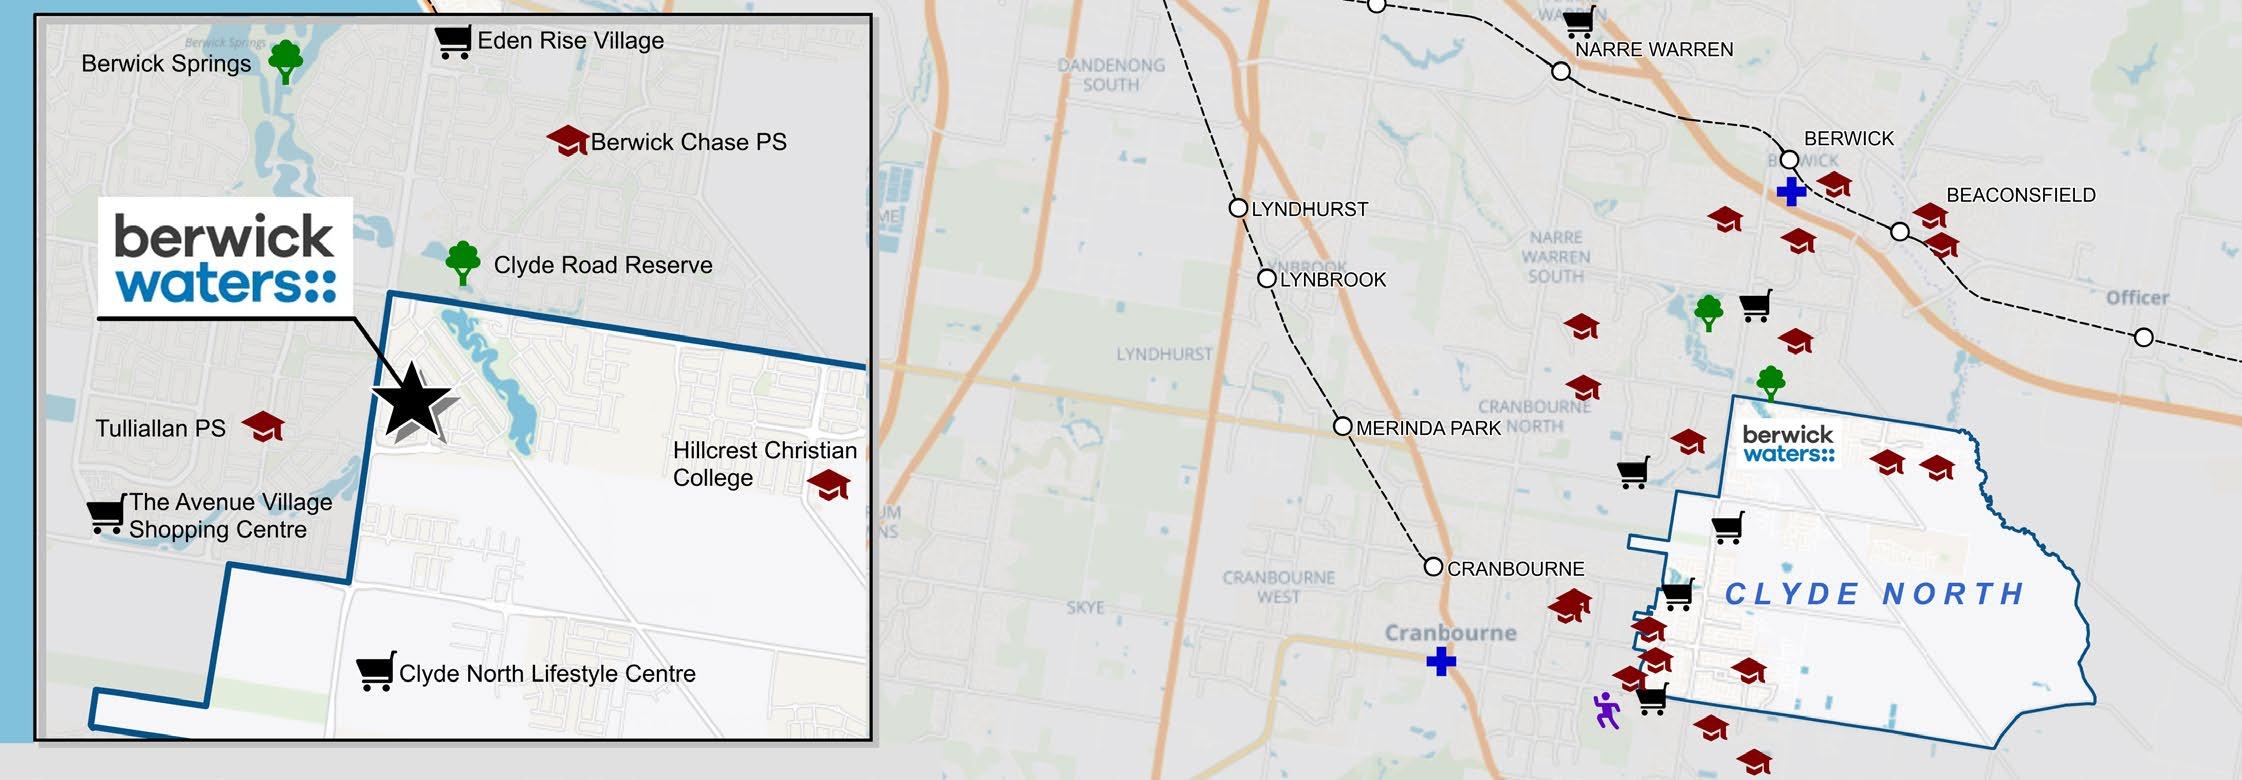
There are numerous parks and watercourses within or nearby the suburb including; Clyde Road Reserve, Clyde Wetlands, Clyde Creek, Berwick Springs, Hallam Main Drain Reserve and Cardinia Creek. Additionally, there are many playgrounds located throughout the suburb’s housing developments.
There are a number of shopping centres within and surrounding Clyde North including the newly developed Clyde North Lifestyle Centre, Selandra Rise Shopping Centre, The Avenue Village Shopping Centre, Eden Rise Village and Fountain Gate Shopping Centre.

Clyde North has numerous Primary Schools and is in close proximity to a number of Secondary Schools.
Casey Hospital, Casey Cardinia Health Services and Monash Health Cranbourne Centre are closely located to Clyde North.


Number of new residential dwellings approved in 2022. Approvals have contracted since levels observed during 2021.
97% of dwellings in Clyde North are detached houses (Metro Melbourne = 68%)
77% of houses are owned outright or owned subject to a mortgage.
(See page 4 for more info.)
43km south-east of the Melbourne CBD.
Direct connectivity to the CBD and Dandenong, via Princes Freeway and South Gippsland Highway Connectivity to Princes Freeway to be improved by current Beaconsfield interchange works. Proximity to hospitals and employment precincts of Dandenong and the Monash corridor.

Clyde North is serviced by the Cranbourne and Pakenham rail lines via Berwick and Cranbourne Stations - each within a short drive. Numerous bus routes run through the suburb, providing a connection to the train stations, and key shopping precincts
Clyde Creek provides a popular shared bike and pedestrian trail.
Approximately one hour drive to Melbourne Airport via M1 and M2 freeways.


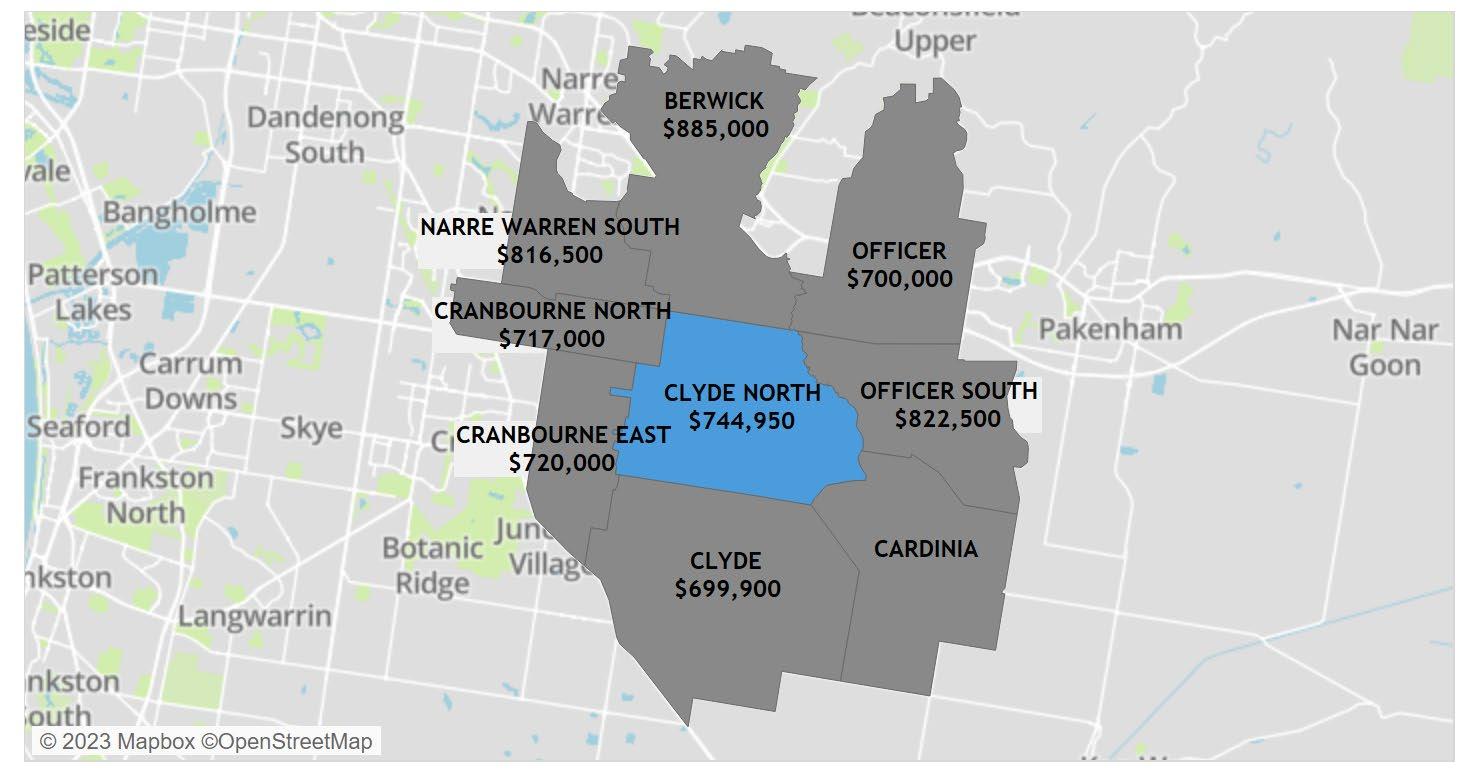
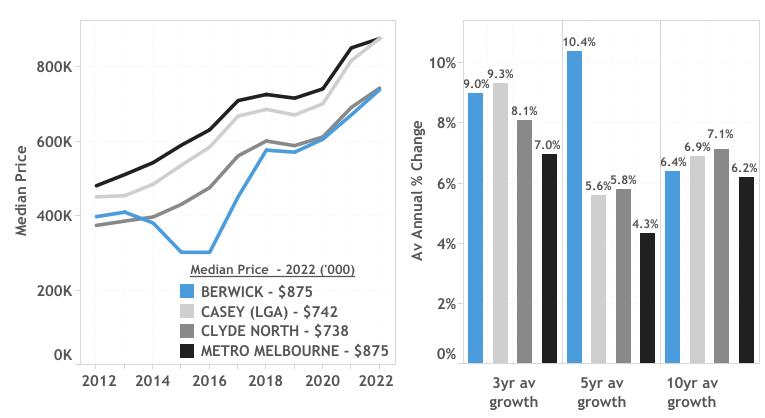
The 2022 median house price in Clyde North was $738,000 The neighbouring suburb of Berwick recorded a notably higher median price of $875,000, in line with metropolitan Melbourne ($875K) and well above the broader Casey LGA ($742K).
Clyde North and Berwick have historically recorded stronger house price growth compared to metropolitan Melbourne. During the past three years, Clyde North and Berwick recorded strong price growth of +9.0% p.a. and +9.3% p.a. respectively
Clyde North is a highly sought-after location within the Casey LGA with significant housing demand driving strong price growth.
Clyde North contains a lower median house price than many of the suburbs that surround it however the suburb has benefited from the development of new infrastructure and retail precincts. This has been capitalised into strong price growth as highlighted above.
Clyde North’s amenity and locational attributes will continue to attract strong housing demand into the future and the northern portion of this suburb stands to attract buyers from more expensive housing markets such as Berwick and Narre Warren South.
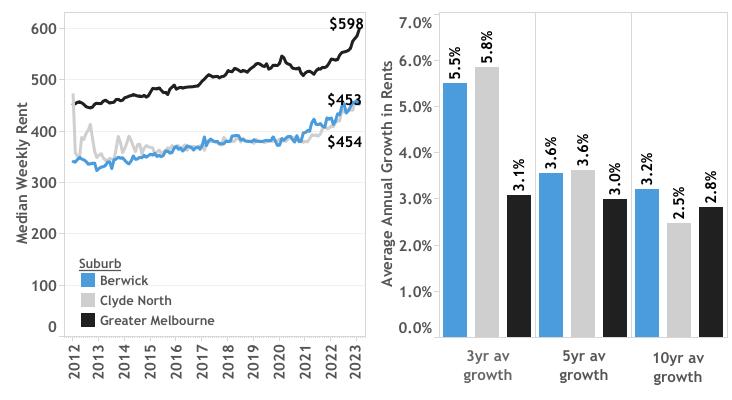
At the end of February 2023, the median weekly rent for a threebedroom house in Clyde North was $454 p.w. which was noticeably more affordable than the metropolitan Melbourne equivalent ($598 p.w.).
Weekly rents in Clyde North and Berwick were generally insulated from the effects of COVID-19 and did not experience the contractions observed across metropolitan Melbourne. This is reflected in the comparatively strong recent rental growth in Clyde North and Berwick.
Despite weekly median rents measuring below metropolitan Melbourne, rental growth indicates that there is an increasing demand for rental properties in the area
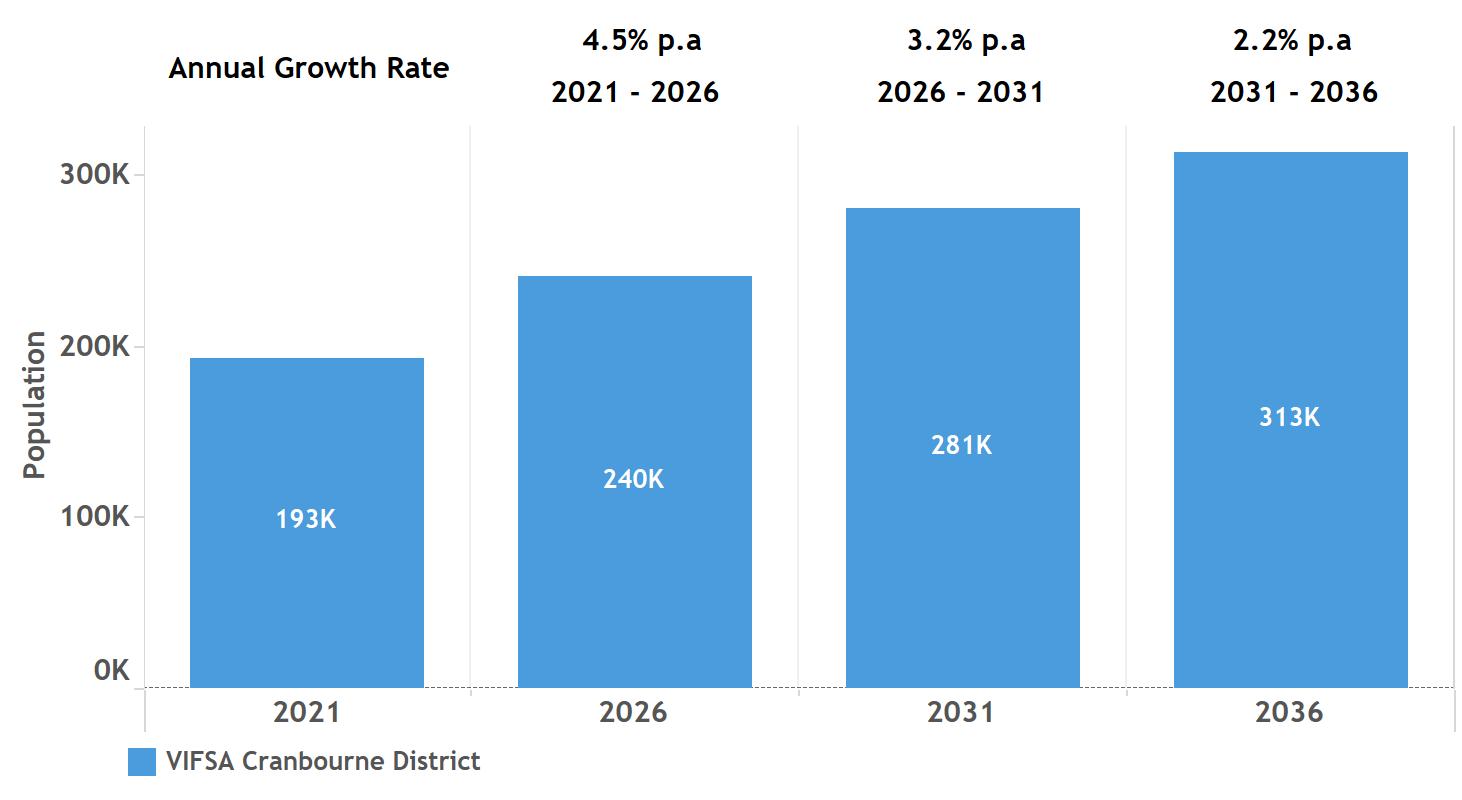
Based on the Victoria in Future (VIF) 2019 projections, the population in the Cranbourne District VIFSA* is forecast to grow considerably to 2036. At +3.3% p.a., average annual growth is set to outpace metropolitan Melbourne (+1.7% p.a.)
Due to the fall in overseas migration, the COVID-19 pandemic is likely to disrupt, but not derail, Cranbourne District VIFSA’s population growth. Short-term growth outcomes are likely to fall short of projections but will return to projected growth rates moving forward.
The 25-44years(41%) age cohort makes up the largest segment of Clyde North’s population, whilst the predominant household type is Couples withChildren(59%).
The median age of Clyde North’s residents is 30 years, notably below that of metropolitan Melbourne. This is reflective of its strong appeal to firsthome buyers and young families. Over 50% of Clyde North’s population were born overseas, with 19% of the total population born in India.
Clyde North is a diverse suburb with a notable proportion of residents born overseas. Clyde North is home to many young families as evidenced by its young median age and large proportion of family households.
SOCIO-ECONOMIC INDICATORS
The primary occupation for residents in Clyde North in 2021 was Professionals (21%) and the primary industry of employment was HealthCare&Social Assistance(20%).
The median annual household income of residents in Clyde North was $113,000 in 2021. This measured above the metropolitan Melbourne equivalent ($99,000).
Residents of Clyde North tend to be employed in higher paying jobs (compared to metropolitan Melbourne) across a diverse range of industries and occupations. Greater purchasing power has the potential to lead to price and rental growth as these households can afford to live in the area.
% OF POPULATION
25 - 44 YEARS OLD
SOURCE - ABS (2021)
Clyde North 41%
Metro Melbourne 31%
MEDIAN AGE
SOURCE - ABS (2021)
Clyde North
30 Years
PRIMARY OCCUPATION
SOURCE - ABS (2021)
Metro Melbourne 37 Years
PREDOMINANT HOUSEHOLD TYPE
SOURCE - ABS (2021)
Couples with Children
Clyde North 59% Metro Melbourne 35%
TOP 3 COUNTRIES OF BIRTH
(NON-AUSTRALIAN RESIDENTS, % OF POPULATION)
SOURCE - ABS (2021)
India, Sri Lanka & Philippines 31% Total Born Overseas 53%
SOURCE - ABS (2021)
Professionals
Clyde North 21%
Metro Melbourne 27%
MEDIAN HOUSEHOLD INCOME
SOURCE - ABS (2021)
Clyde North $113,000 p.a.
Metro Melbourne $99,000 p.a.
Health Care & Social Assistance
Clyde North 20% Metro Melbourne 14%
LEVEL OF EDUCATION
SOURCE - ABS (2021)
Bachelor Degree or Higher
Clyde North 30% Metro Melbourne 30%
Clyde North contains a high proportion of detached housing (97%) with only a limited number of townhouses (3%) and no representation of apartment stock (as at the 2021 Census).
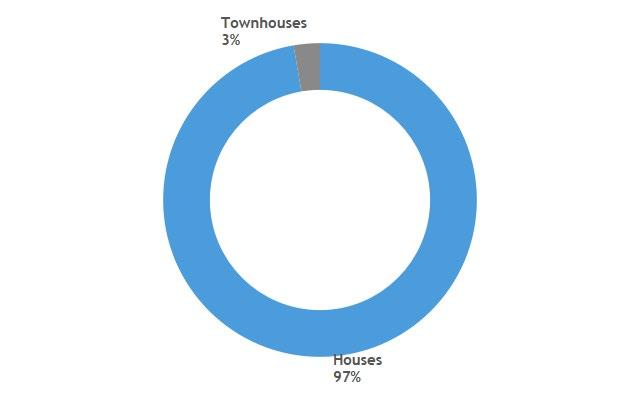
Clyde North’s dwelling mix contains a significantly larger proportion of detached dwellings than metropolitan Melbourne (68%).
Clyde North’s location in Melbourne’s south-eastern growth corridor makes it one of the leading providers of new detached dwellings in Victoria.
Clyde North is a relatively new suburb making it a popular destination for first home buyers attracted by the area’s comparative affordability. As a result, Clyde North contains a significant proportion of homes being purchased (68%) but only a small number of homes which are owned outright (8%)
In comparison to metropolitan Melbourne, a greater proportion of dwellings in Clyde North are currently being purchased or rented.
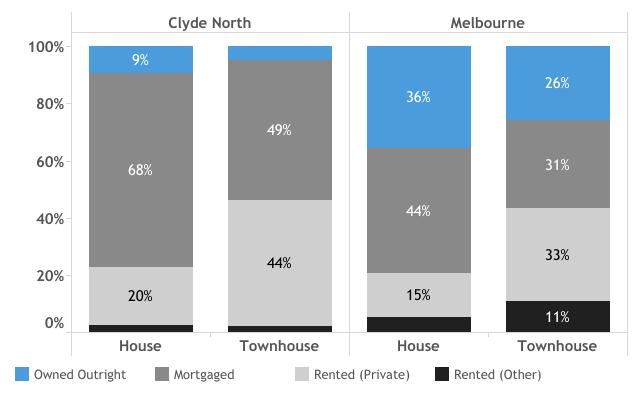
Across Clyde North, a significant proportion of houses are mortgaged, pointing to the substantial demand from first home buyers. While less significant, the investor market supports the notable proportion of rented properties in the suburb.
Building approvals for new residential dwellings in Clyde North averaged around 370 approvals per quarter since Q3-2016.
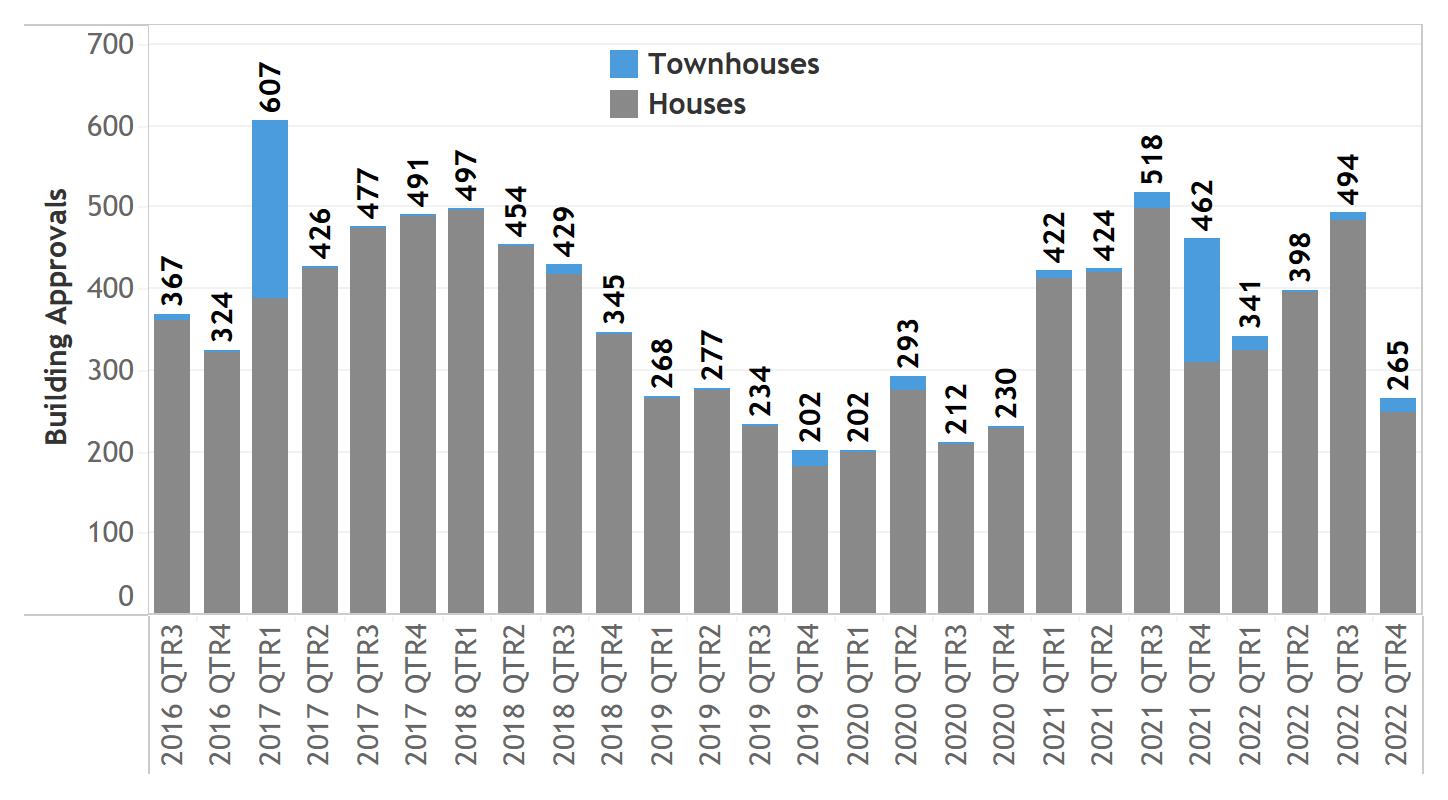
Whilst the market slowed through 2019-20, there was an evident market uplift through 2021 (457 approvals per quarter). This was supported by the HomeBuilder Grant and historic-low interest rates. Following increased construction costs and rising interest rates, building approvals tapered during Q4-22.
There has been some representation from townhouses in Clyde North, however, detached housing remains the predominant form of new dwelling in this suburb.
Melbourne
Level 7/161 Collins Street
Melbourne VIC 3000
T 1300 242 787
Sydney
Level 25/52 Martin Place
Sydney NSW 2000
T 1300 242 787
Brisbane
Level 32/123 Eagle Street
Brisbane Queensland 4000
T 1300 242 787
Gold Coast
Level 18/50 Cavill Avenue
Surfers Paradise Queensland 4217
T 1300 242 787
Singapore
138 Market Street, CapitaGreen
Level 24-01
Singapore 048946
T 1300 242 787
enquiry@charterkc.com.au charterkc.com.au
Charter Keck Cramer Pty Ltd
ABN 78 618 794 853
This Report provides an independent and unbiased overview of the suburb Clyde North and has been carefully prepared by Charter Keck Cramer at the instruction of Frasers Property. This Report does not render financial or investment advice and neither Charter Keck Cramer nor any persons involved in its preparation accepts any form of liability for its contents. The information contained herein was compiled in March 2023 and should not be relied upon to replace professional advice on specific matters. Charter Keck Cramer is not providing advice about the suitability of investment in any specific project or financial product and is not a holder of an Australian Financial Services Licence. This report is Copyright and cannot be reproduced without written permission of Charter Keck Cramer.
© 2023 Charter Keck Cramer Visit charterkc.com.au
Sources: Charter Keck Cramer, Australian Bureau of Statistics, APM, SQM Research, Australian Government – Centre for Population, Economist Intelligence Unit, Plan Melbourne, VIF 2019, Times Higher Education World University Rankings 2023.