Local Market Intelligence Residential Market Overview Tarneit April 2023 RESEARCH Australia’s most trusted & innovative property group. charterkc.com.au
The Melbourne Story
Metropolitan Melbourne: Key Considerations
RESEARCH


Melbourne is a city of international significance. It has long been ranked in the top ten of the world’s most liveable cities, including number one from 2011-2017.
Melbourne contains two universities ranked in the top 100 global universities.
Victoria, Australia’s second-largest economy, grew by +5.6% over FY21/22 as it rebounded from the pandemic.
Victoria’s economy performed remarkably well following the extended lockdowns over 2020 and 2021. The unemployment rate in Victoria as at Jan 2023 was 3.8%. This represents a significant contraction since the peak levels observed during the pandemic.
(Ranked 1st 7 Consecutive Times, 2011-2017)
2 Universities in the Top 100 Global Universities
(University of Melbourne = 34th and Monash University = 44th)
+5.6%
(Victorian Economic Growth FY21-FY22)
+3.6%
(Australian Economic Growth FY21-FY22)
Unemployment Rate
3.8%
January 2023 (Down from 4.1% in Jan 2022)
Prior to the onset of the Covid-19 pandemic, Victoria was the fastestgrowing state in Australia, leading the nation in population growth since 2015. Strong population growth was underpinned by high volumes of Net Overseas Migration (NOM).
The onset of the Covid-19 pandemic saw international borders close and NOM fall substantially. This severely limited Victoria’s population growth over 2020 and into 2021.
Victoria’s NOM has rebounded strongly and is poised to return as a key driver of housing demand across the state. Importantly, Melbourne is forecast to once again become Australia’s fastest growing Capital City by 2023/24.
Population (June 2022)
6,613,727
Annual Change (2021-2022) +1.0%
(55,631 – Net Overseas Migration, -17,233 - Net Interstate Migration, 29,014 - Natural Increase)
1.57 million
Metropolitan Melbourne’s Requirements 2016 - 2051
Melbourne Population Outlook
Fastest
City by 23/24
(Australian Government - Centre for Population Annual Population Statement 2022)
Detached housing is the predominant form of housing stock in Melbourne. Policy aspirations however aim to achieve greater levels of higher density dwellings to accommodate future population growth.
House price growth in Melbourne has been high over the last two decades which has supported the development of higher-density stock. Despite the headwinds of the Covid-19 pandemic, prices remained resilient and demonstrated robust growth.
Melbourne continues to remain the leading supplier of new greenfield lots across Australia with an average of 19,500 annual lot sales recorded over the past decade.
16% : 16% : 68%
(Higher Density) :(Medium Density) : (Detached Houses) (2021)
31% : 36% : 34%
(Higher Density) :(Medium Density) : (Detached Houses) (2011-2051)
19,500 Annual Lot Sales
(2013 - 2022) Metropolitan Melbourne
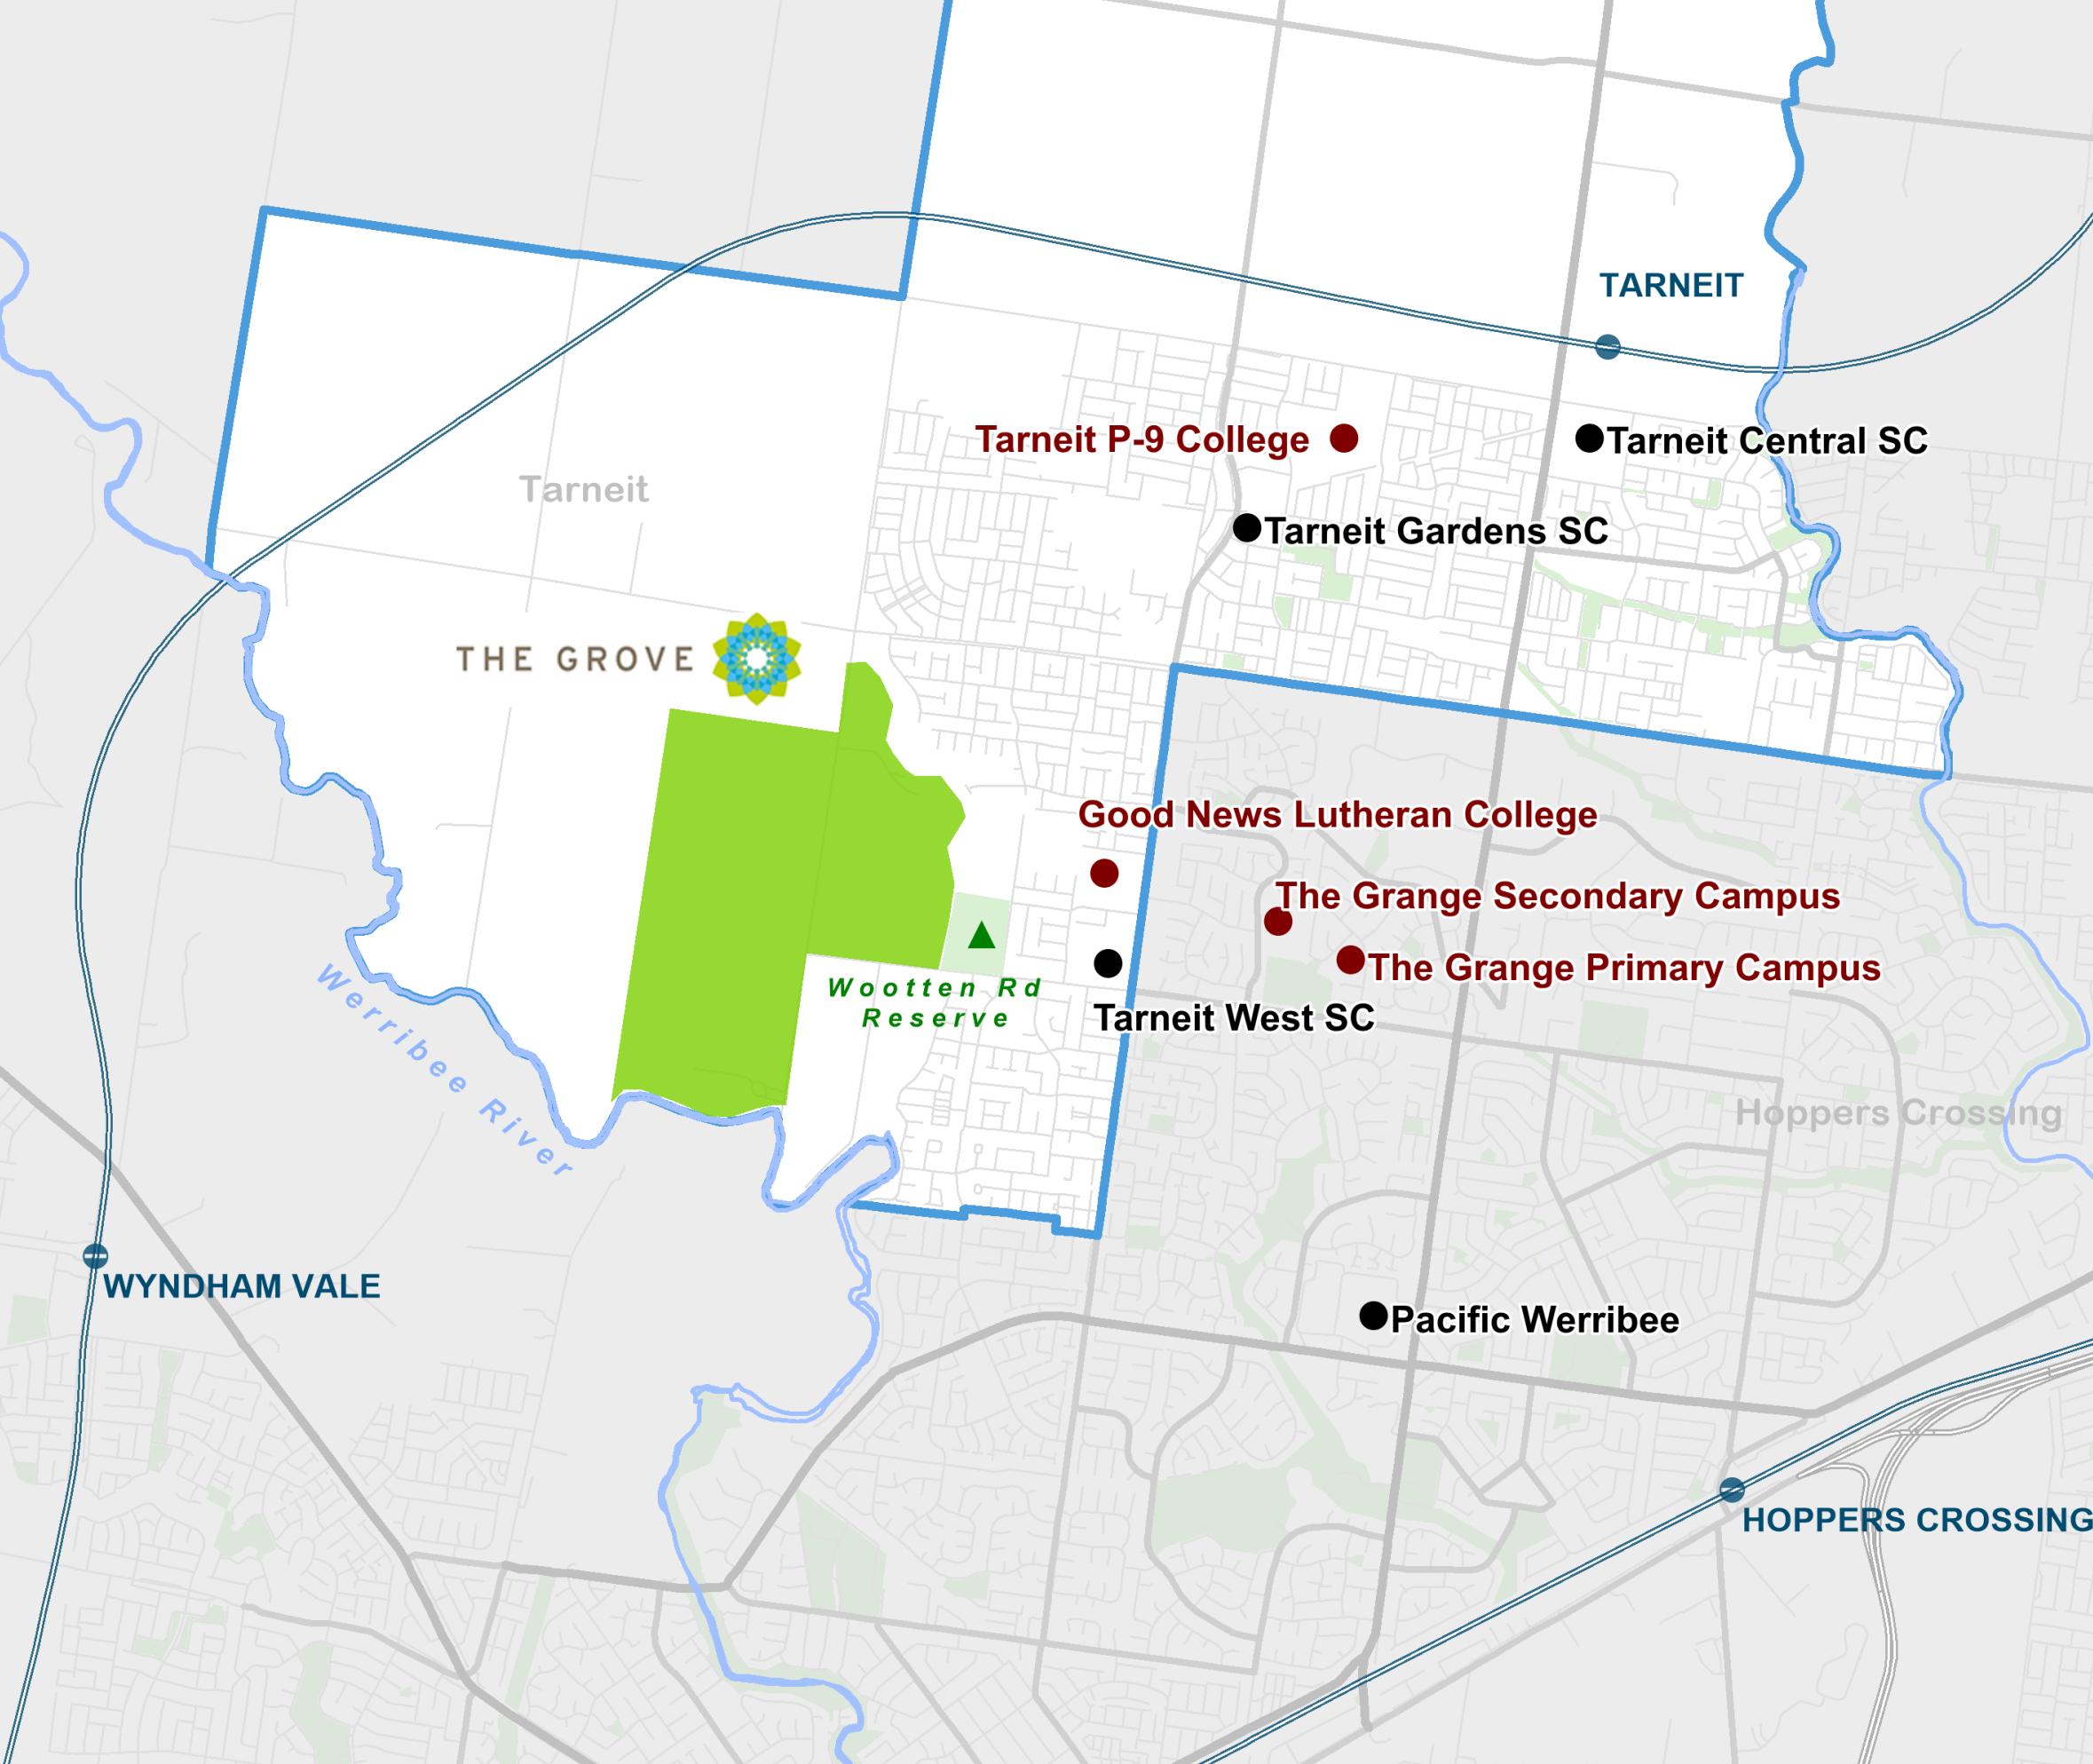
AMENITY: Tarneit possesses a higher level of amenity than other greenfield locations due to the presence of a railway station and multiple shopping centres.
$650,000
There are numerous and significant cityshaping infrastructure upgrades that will transform Melbourne’s West and have a positive impact on Tarneit over the next decade. A selection of these are outlined below.
Due to complete in 2025, the West Gate Tunnel Project will provide a secondary freeway link between Melbourne’s West and the City. New and improved road infrastructure will ease congestion along the West Gate Freeway and Bridge, creating a better experience for travellers. Additionally, the project will also add and improve walking and cycling paths and create approximately 9ha of new parks and wetlands.
A number of new and upgraded train stations will be built across Melbourne’s West, improving connectivity to the region. Due for completion in 2026, a new station at Tarneit West will incorporate a pedestrian crossing, four-bay bus interchange as well as parking for 400 commuters.
Construction has commenced on the Wyndham Stadium Precinct which will deliver major sporting and social infrastructure within Tarneit. The project will form a sports and entertainment precinct that incorporates a 15,000-seat stadium (to be home of an A-League team), sports grounds for professional and community use as well as a range of commercial and residential development.
Tarneit 2022 median house price (Metro Melbourne = $875,000).
+6.3% p.a.
Tarneit 10-year average annual house price growth (Metro Melbourne = +6.2% p.a.).
+3.2% p.a.
10-year average annual three-bedroom house rental growth in local area (Metro Melbourne 2.5% p.a.).
(See pages 9-11 for info.)
The predominant age cohort across Tarneit accounting for 42% of all residents.
Largest household type across Tarneit accounting for 59% of all households.
Younger age demographic than metropolitan Melbourne (Metro Melbourne = 37 years).
(See pages 12-14 for more info.)
Number of new residential dwellings approved in 2022. This is a contraction since peak levels observed during 2020/21.
90% of dwellings in Tarneit are detached houses (Metro Melbourne = 68%).
71% of houses are owned outright or owned subject to a mortgage.
(See pages 15-17 for more info.)
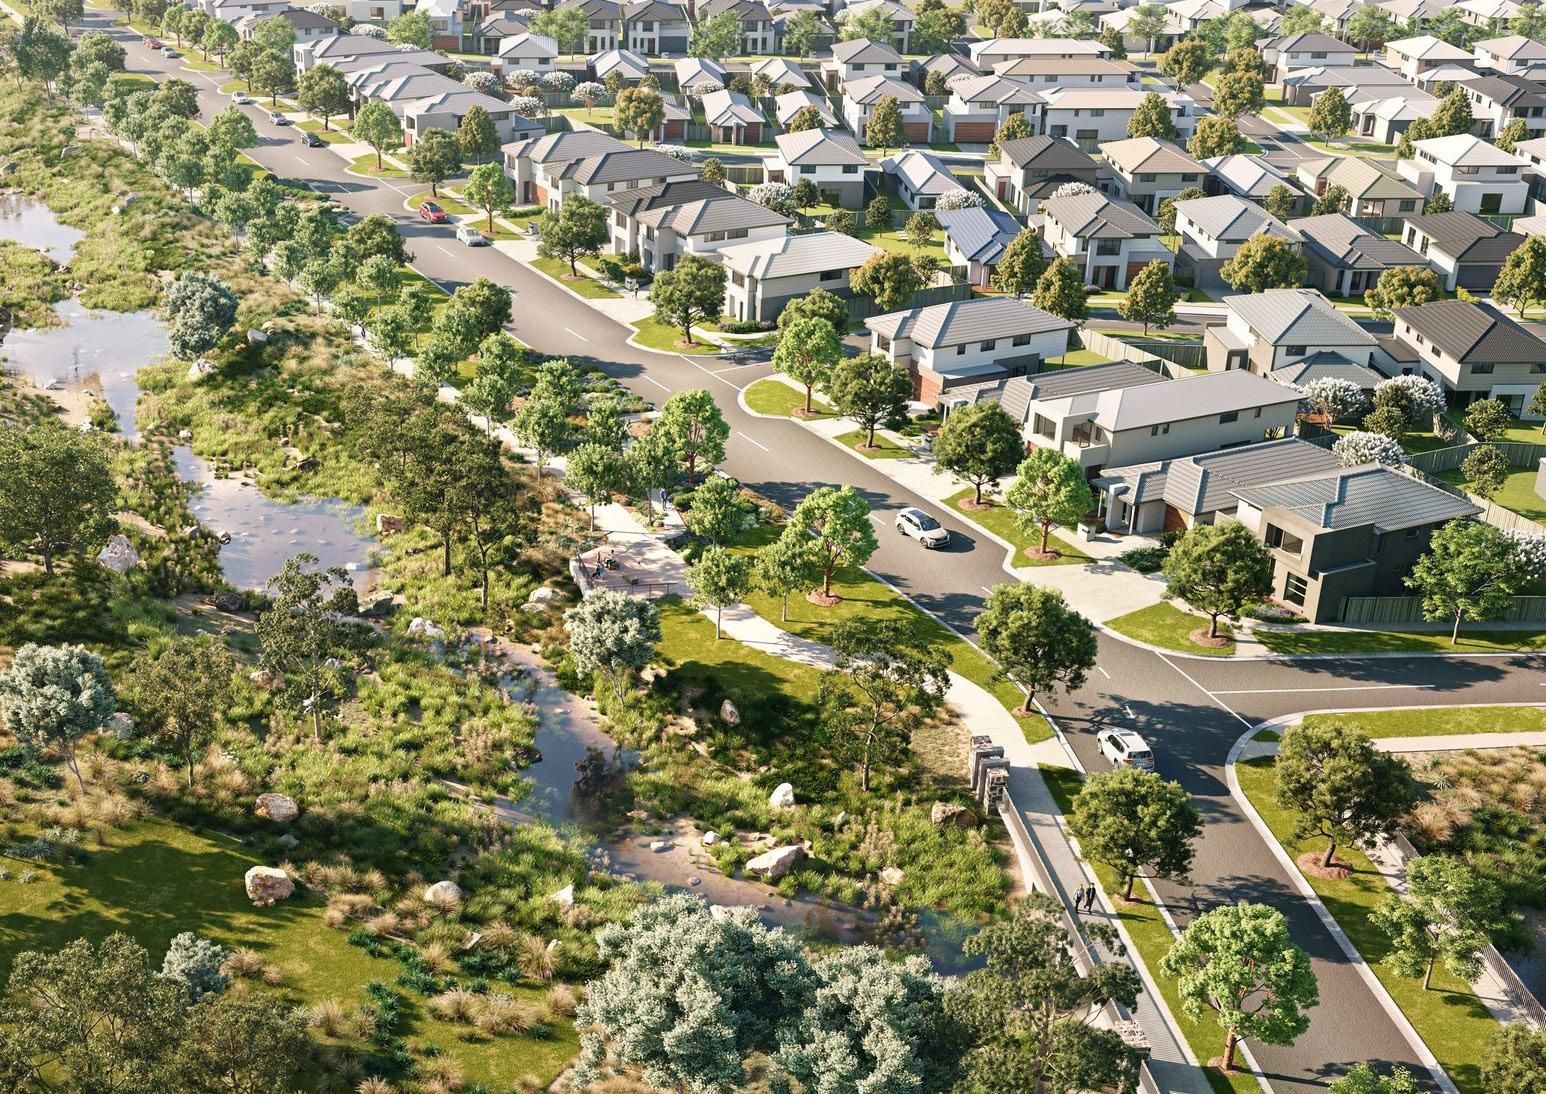
» Tarneit is a suburb within the City of Wyndham Local Government Area (LGA), located approximately 28km west of the Melbourne CBD.
» Significant residential development in Tarneit first began in the mid 2000s prior to that the area was an undeveloped rural locality mostly comprising farmland.
» The suburb is bounded by Truganina to the east, Hoppers Crossing and Werribee to the south and Wyndham Vale to the west.
» Tarneit is predominantly a residential suburb, with small pockets of retail activity located throughout. The western and northern portions of the suburb are presently undeveloped but will support additional housing over the coming years.
Numerous watercourses run through the suburb including; Werribee River, Skeleton Creek, Tarneit Creek and Davis Creek. Numerous parks are located throughout the suburb’s many housing developments. The Werribee Mansion and the Werribee Open Range Zoo, are both within close proximity.
Tarneit Central Shopping Centre is situated in the heart of the suburb, anchoring major retailers. Other shopping centres include Wyndham Village SC, Tarneit Gardens SC, and Tarneit West SC. Pacific Werribee in Hoppers Crossing is the nearest super-regional shopping centre containing most major retailers.
Tarneit has numerous Primary & Secondary schools. Victoria University’s Werribee Campus is also in close proximity.
Werribee Mercy & St. Vincent Private Hospitals anchor Wyndham’s major medical precinct located in the nearby suburb of Werribee.
28km west of the Melbourne CBD.
Direct connectivity to the CBD, via Sayers and Leakes Roads which connect to the Princes Freeway.
Proximity to the Melbourne CBD and Laverton North Industrial precinct.
Tarneit Station provides a direct connection to both the Melbourne CBD and Geelong via a Vline service, additional rail connectivity to the CBD is provided via metro services from Hoppers Crossing and Werribee Stations. Numerous bus routes run through the suburb, providing a connection to the train stations, and key shopping precincts.
Federation Trail provides access to the Inner West and Melbourne CBD. Skeleton Creek trail and Werribee river trail are also popular.
Approximately 30 minutes drive to both Melbourne Airport and Avalon Airport via Princes Freeway and Western Ring Road.
 Karwan Primary School
The 2022 median house price in Tarneit was $650,000. This was more affordable than the median house price observed across metropolitan Melbourne ($875,000).
Since its establishment as a residential suburb, Tarneit has experienced robust housing price growth with prices increasing by +6.3% p.a. over the past decade. This measures in line with both Wyndham LGA and metropolitan Melbourne.
Tarneit is a highly sought after location within the Wyndham LGA evidenced by its strong recent price growth. Historically, housing prices in Tarneit have mirrored those of the broader Wyndham LGA.
In comparison to other surrounding suburbs in the Wyndham LGA, Tarneit contains a higher median house price than the older more established Wyndham suburbs of Hoppers Crossing ($617,000) and Werribee ($605,000).
Tarneit has greater established infrastructure than the other greenfield markets in the region through the provision of shopping centres and a railway station. Tarneit’s strong amenity will continue to drive demand into the future with housing price growth likely to remain strong.
At the end of December 2022, the median weekly rent for a threebedroom house in Tarneit was $399, noticeably below that of metropolitan Melbourne ($580 per week).
Long term rental price growth across Tarneit (+3.2% p.a) has outpaced that of metropolitan Melbourne (+2.5% p.a) with above average price growth observed over the last decade.
Despite the low weekly median rent, the above average long term rental price growth indicates that there is an increasing demand for rental properties in Tarneit.
Based on the Victoria in Future (VIF) 2019 projections, the population of the Hoppers Crossing – Truganina VIFSA* is forecast to grow considerably to 2036. At an average annual growth rate of +2.7% p.a., Tarneit’s growth is set to outpace metropolitan Melbourne (+1.7% p.a.) over this period.
Due to the fall in overseas migration, the COVID-19 pandemic has likely delayed, but not derailed, local population growth.
Short-term growth outcomes are likely to fall short of projections but will return to projected growth rates moving forward, particularly given the recent strong return of net overseas migration.
The 25-44 years (42%) age cohort makes up the largest segment of Tarneit’s population, whilst the predominant household type is Couples with Children (59%).
The median age of Tarneit residents is 30 years, significantly below that of metropolitan Melbourne. A majority of Tarneit’s population were born overseas. Of its overseas born population, 53% were born in India.
Tarneit is a diverse suburb with more than 60% of all residents born overseas. Tarneit is home to many young families as evidenced by its young median age and large proportion of family households.
DEMOGRAPHIC DRIVERS OF DEMAND, TARNEIT (2021)
% OF POPULATION
25 - 44 YEARS OLD
SOURCE - ABS (2021)
SOURCE - ABS (2021)
SOURCE - ABS (2021)
TOP 3 COUNTRIE OF BIRTH (NON-AUSTRALIAN RESIDENTS, % OF POPULATION)
SOURCE - ABS (2021)
The primary occupation for residents in Tarneit in 2021 was Professionals (21%) and the primary industry of employment was Transport, Postal and Warehousing (14%).
SOURCE
PROFESSIONALS
SOURCE
The 2021 median annual household income of residents in Tarneit was $109,000. This measured above the metropolitan Melbourne equivalent ($99,000).
Residents of Tarneit tend to be well educated and employed in well paying jobs across a diverse range of industries and occupations. Greater purchasing power has the potential to translate to price and rental growth as these households can afford to live in the area.
SOURCE
SOURCE
p.a.
Tarneit contains a high proportion of detached housing (90%) with some representation from townhouses (10%).
Tarneit’s dwelling mix contains a significantly larger proportion of detached dwellings than metropolitan Melbourne (68%).
Tarneit’s location in Melbourne’s western growth corridor makes it one of the leading providers of new detached dwellings in Victoria. The suburb has seen an increase in the proportion of townhouses with 10% of all dwellings being townhouses, a greater proportion in comparison to other greenfield markets across metropolitan Melbourne.
10% 90%
Tarneit is a relatively new suburb making it a popular destination for first home buyers attracted by the area’s comparative affordability. As a result, Tarneit contains a significant proportion of homes being purchased (61%) but only a small number of homes which are owned outright (10%).
In comparison to metropolitan Melbourne, a greater proportion of houses in Tarneit are currently being purchased or rented.
Across Tarneit a significant proportion of houses (29%) are rented, indicating demand from investors to purchase in the suburb. The most likely purchasers of new dwellings in Tarneit are first home buyers followed by investors.
Building approvals for new residential dwellings in the study area averaged around 310 approvals per quarter during 2016-19.
Supported by the HomeBuilder Grant and historic-low interest rates, there was an evident market uplift through 2020 –2021 (550 approvals per quarter). Approvals tapered slightly through 2022 (463 approvals per quarter) following increased construction costs and rising interest rates.
The significant volume of land sales through 20/21-21/22 are supporting new building approvals, however, tightened land supply in Melbourne’s West may contribute to a further contraction in approvals moving forward.
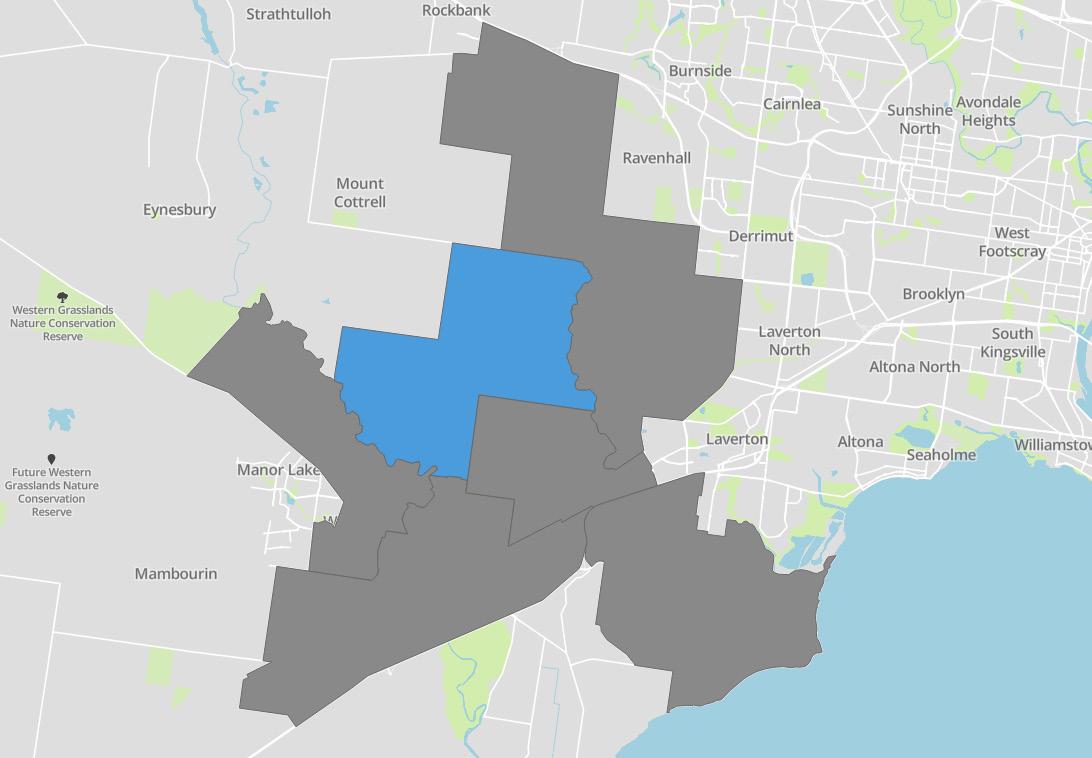
*Data was sourced from ABS. Data is at an SA2 level and includes southern portion of Mount Cottrell. Charter notes building approvals can be granted for a lot on a certified plan, and may therefore reflect more recent supply conditions than settled sales
Melbourne
Level 7/161 Collins Street
Melbourne VIC 3000
T 1300 242 787
Sydney
Level 25/52 Martin Place
Sydney NSW 2000
T 1300 242 787
Brisbane
Level 32/123 Eagle Street
Brisbane Queensland 4000
T 1300 242 787
Gold Coast Oracle East Building, E316 / 3 Oracle Boulevard
Broadbeach QLD 4218
T 1300 242 787
Singapore 138 Market Street, CapitaGreen
Level 24-01
Singapore 048946
T 1300 242 787
enquiry@charterkc.com.au
charterkc.com.au
Charter Keck Cramer Pty Ltd
ABN 78 618 794 853
DOCUMENT
PREPARED BY CHARTER RESEARCH
This Report provides an independent and unbiased overview of the suburb Tarneit and has been carefully prepared by Charter Keck Cramer at the instruction of Frasers Property. This Report does not render financial or investment advice and neither Charter Keck Cramer nor any persons involved in its preparation accepts any form of liability for its contents. The information contained herein was compiled in March 2023 and should not be relied upon to replace professional advice on specific matters. Charter Keck Cramer is not providing advice about the suitability of investment in any specific project or financial product and is not a holder of an Australian Financial Services Licence. This report is Copyright and cannot be reproduced without written permission of Charter Keck Cramer.
© 2023 Charter Keck Cramer Visit charterkc.com.au
Sources: Charter Keck Cramer, Australian Bureau of Statistics, APM, SQM Research, Australian Government – Centre for Population, Economist Intelligence Unit, Plan Melbourne, VIF 2019, Times Higher Education World University Rankings 2023.