3 minute read
About Front Row Ag Feed Charts

Front Row Ag Feed Chart Phases & Phase Recipes
On each Front Row Ag Feed Chart, you’ll see that there are several “Recipes” that are used strategically at different stages: Stretch, Stack, Swell and Ripen. These recipes represent different ratios of the input fertilizers, that create different elemental ratios of plant nutrients. This allows cultivators to deliver the general ratios of minerals appropriate for each phase of plant development.
Clones and Mother Plants
Most nitrogen forward recipe favoring calcium for biomass growth.
Weeks 1 & 2 of Flower
Introduces Bloom, first increases of P&K, giving cues to initiate flower.
Weeks 3, 4, 5 of Flower
Most balanced flower recipe. Heighten levels of P, K plus Mg and S.
Weeks 6, 7, 8 of Flower
Highest P&K relative to equal parts A & B for promoting density and flower swell
Final 2 Weeks of Flower
Decreases N for finishing cues promoting optimal aroma, yield, color, and cure.
Prefer to keep it simple? Use The Stack Recipe
While using all the recipes can be quite beneficial, it’s important to note that most cultivars don’t need to have the recipe changed across the growth phases and perform optimally running the “Stack” recipe for the entire flowering cycle.
ANATOMY OF A FEED CHART
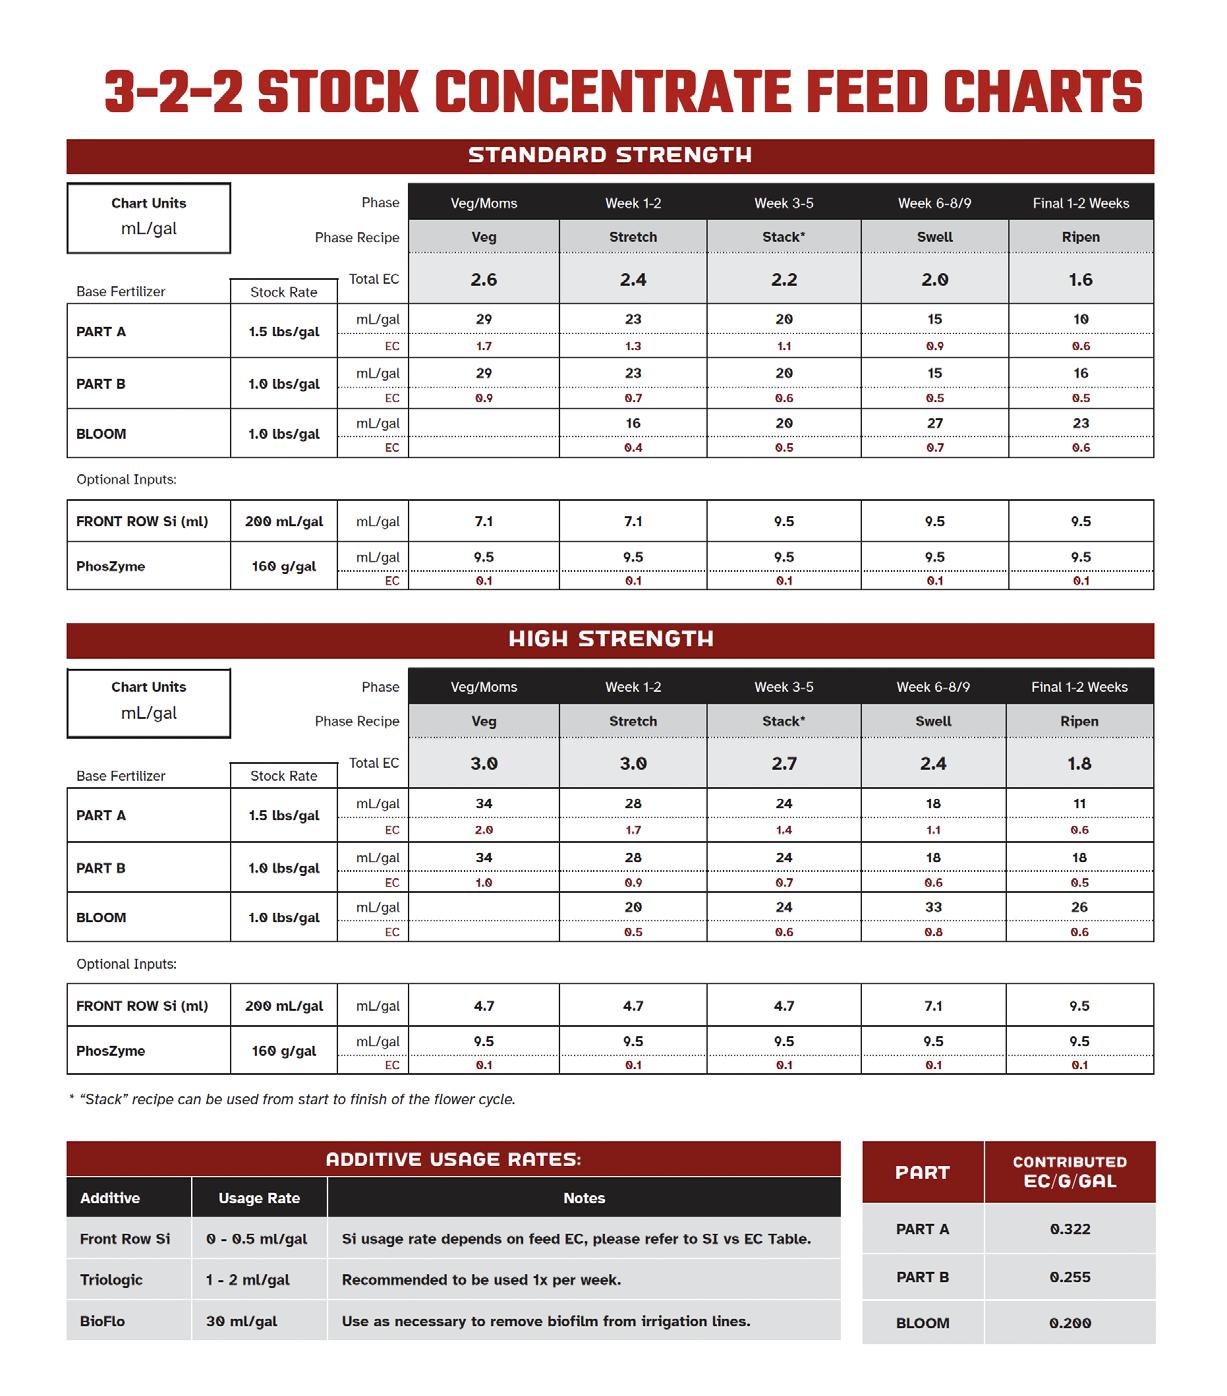
2 Strength Options: Standard or High Strength
Standard strength charts are designed for general use, high strength feed charts are tailored for more intensive agricultural practices where plants require higher concentrations of nutrients, often due to specific growth conditions, higher lighting intensity, and advanced cultivation techniques.
Units of Measurement
Feed Charts show the usage rate for each part in “grams per gallon” or “grams per liter” for dry powder and “mL per gallon” or “mL per liter” for liquids. When mixing tanks, multiply the usage rate by the total number of gallons or liters being mixed to determine how much fertilizer to use.
EC Contributions
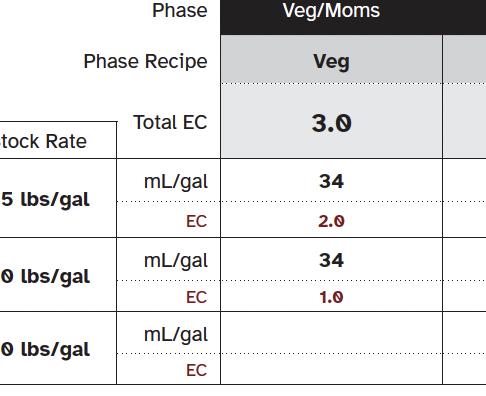
Each input row on the feed chart contains the usage rate e.g. g/gal or ml/gal as well as the EC contributed from that part. This indicates the EC in the batch tank that is directly contributed from that part alone. Ex. In the High Strength Chart Veg Recipe, Part A is contributing 2.0 EC, Part B is contributing 1.0 EC. This can be used as a good way to verify accurate additions of fertilizer.
We also provide the Contributed EC per gram per gallon. We rounded to the nearest tenth on the chart in order to match most EC meter displays.