Seaport capacity manual: application to container terminals

Arturo Monfort
José Aguilar
Paula Vieira
Noemí Monterde
Roser Obrer
David Calduch
Ana María Martín
Rafael Sapiña

Seaport Capacity Manual: Application to Container Terminals

Authors: Arturo Monfort Mulinas
José Aguilar Herrando
Paula Vieira Gonçalves de Souza
Noemí Monterde Higuero
Roser Obrer Marco
David Calduch Verduch
Ana María Martín Soberón
Rafael Sapiña García
Collaborator: Elisabet Maroñas Mira
Collection: Technical Collection of Fundación VALENCIAPORT
Series: Port Planning and Port Management
Edit: © Fundación VALENCIAPORT
Nuevo Edificio Autoridad Portuaria de Valencia
Avda. del Muelle del Turia, s/n – 46024 Valencia
www.fundacion.valenciaport.com
ISBN: 978-84-940351-1-1
D L : V-2087-2012
Printed: La Imprenta Comunicación Gráfica
Lay designer:
Caligrama
Photography: Ana María Martín Soberón
David Calduch Verduch
Paula Vieira Gonçalves de Souza
Noemí Monterde Higuero
Mª Carmen Jiménez Zaragoza
All rights reserved. No part of this publication may be reproduced, stored in a retrieval system, or transmitted, in any form or by any means, without the prior written permission of the holders of the intellectual property
4 Index of tables 6 Index of figures 9 Index of graphs 12 Acronyms 14 Notation 16 Acknowledgement 19 1. Introduction 23 2. The port terminal 39 2.1 The terminal as a system 39 2.2 Types of port terminals 42 2.2.1 Terminals according to cargo format and type of handling 42 2.2.2 Terminals by type of traffic 65 3. Container terminals 69 3.1. Types of container terminals according to yard equipment 70 3.1.1. Chassis 70 3.1.2. Frontloaders 72 3.1.3. Reachstackers (RSs) 73 3.1.4. Straddle Carriers (SCs) 77 3.1.5. Rubber Tyred Gantry cranes (RTGs) 78 3.1.6. Rail Mounted Gantry cranes (RMGs) 80 3.1.7. Automated Terminals 81 3.2. Description of operations 84 4. Measuring port performance, efficiency, capacity and level of service 91 4.1. Measuring performance in ports 91 4.2. Operational port performance 97 4.2.1. Output 98 4.2.2. Productivity 99 4.2.3. Utilisation 102 Index
5 4.3. Efficiency 102 4.4. Capacity 104 4.5. Level of Service 105 5. Measuring port terminal capacity 111 5.1. Methods of measurement 111 5.2. Analytical calculation by subsystem: hypothesis 113 5.3. Berth capacity 115 5.3.1. Definition 115 5.3.2. Recommendations regarding berth capacity 120 5.4. Storage capacity 145 5.4.1. Definition 145 5.4.2. Specific reference to container terminals 146 6. Examples of capacity calculations 181 6.1. Scenario and source data for the new port container terminals 181 6.2. Calculation of berth capacity 185 6.3. Calculation of storage capacity 197 6.4. Terminal restricting capacities 205 Appendix 1: Remarks and limitations on the calculation of berth capacity 209 Appendix 2: Safe distance (berthing gap) 221 Appendix 3: Annual capacity per metre of berth with berths of 250 and 350 metres in length 223 Appendix 4: Estimation of the Average Annual Berth Productivity 239 Bibliography 247
6
Table 1: Classification of general cargo and transportation format 43 Table 2: Type of handling operation by cargo format 44 Table 3: Types of Frontloaders 76 Table 4: Description of terminal operations by type of yard equipment used 83 Table 5: Decoupling in the transfer system 87 Table 6: Equipment for transfers between the various subsystems according to yard equipment 89 Table 7: Operative and financial indicators 93 Table 8: Port performance categories and indicators 94 Table 9: Indicator categories, typical Indicators and units 97 Table 10: Examples of productivity indicators 101 Table 11: Main relation between productivity indicators and objectives 101 Table 12: LoS proposal for intermodal terminals 109 Table 13: Berth capacity per berth type (“Chile case” analysis) 118 Table 14: Example of the influence of the type of queue system and the number of berths on the berth occupancy ratio for a given level of quality of service associated to the relative waiting time 122 Table 15: Recommended acceptable berth occupancy ratio (Ø) according to the number of berths and the queue system for multipurpose terminals (T w /T s=0.25) and bulk terminals (T w /T s =0.50) 127 Table 16: Recommended acceptable berth occupancy ratio (Ø) according to the number of berths and the queue system for container terminals (T w /T s=0.05, T w /T s =0.10 and T w /T s=0.20) 128 Table 17: Examples of performance indicator scores for a container terminal contract 129 Table 18: Recommendations on productivity and level of service 130 Table 19: Container terminal berth capacity according to terminal size and type of traffic 131 Table 20: Annual capacity per metre of berth according to type of traffic , vessel productivity at berth and number of berths (ber ths of 300 metres in length) 132 Table 21: Relation between call size and performance 134 Table 22: Level of service proposal for the ship to shore subsystem or berthing facilities 142
Index of tables
7 Table 23: Level of service for M/E4/2 case and berth of 300 m (Berth capacity in containers/metre) 143 Table 24: Level of service for M/E4/2 case and berth of 300 m (Berth capacity in TEU/metre) 143 Table 25: Summary of productivity indicators per area in certain international container terminals 166 Table 26: Area density according to author and storage equipment 167 Table 27: Storage static capacity of the container yard according to type of equipment 170 Table 28: Area density according to yard equipment 172 Table 29: Stacking density –incorporating stack height– according to author and type of handling equipment 174 Table 30: Area density, operational average stacking height and static capacity of container terminals according to type of equipment 176 Table 31: Operative and geometric data of reference Container Terminal (CUT and DT) of the Container Terminals on the Southern Dock at Green Valley Por t 183 Table 32: Minimum vessel productivity over the period of the concession in a common-user terminal’s concession 186 Table 33: Berth capacity in a CUT on the Southern Dock for a productivity of 40 containers/hour 188 Table 34: Berth capacity in a CUT on the Southern Dock for productivities of 44 and 48 containers/hour 188 Table 35: Minimum vessel productivity over the period of the concession in a dedicated terminal (DT) 191 Table 36: Berth capacity in a DT (E2/E4/n) on the Southern Dock for a productivity of 70 containers/hour 192 Table 37: Berth capacity in a DT (E2/E4/n) on the Southern Dock for productivities of 65 and 75 containers/hour 192 Table 38: Berth capacity in a DT (M/E4/n) on the Southern Dock for a productivity of 70 containers/hour 194 Table 39: Berth capacity in a DT (M/E4/n) on the Southern Dock for productivities of 65 and 75 containers/hour 194 Table 40: Storage capacity in a CUT 199 Table 41: Storage capacity in a DT 199 Table 42: Storage capacity in a CUT – Graph 11 203
8 Table 43: Storage capacity in a DT – Graph 11 203 Table 44: Variation storage capacity of CUT and DT on the Southern Dock depending on dwell time 205 Table 45: Annual berth capacity per metre of quay according to type of traffic, annual average productivity of vessel at ber th and number of berths, considering berths of 250 metres in length 224 Table 46: Annual berth capacity per metre of quay according to type of traffic, average annual productivity of vessel at ber th and number of berths, considering berths of 350 metres in length 231 Table 47: Example of calculating annual average productivity of vessel at ber th 242 Table 48: Calculation of annual average productivity of vessel at ber th (P) for referred terminals of Ashar (2009) based on the ber th productivity 243 Table 49: Calculation of annual average productivity of vessel at ber th (P) for 500-1,000 range of Drewry (2002 and 2010) for referred terminals of Ashar (2009) and comparison 244 Table 50: Comparison between the capacity increase result of raising the average productivity of vessel at berth or to change 2 into 3 berths 245
Index of figures
9
Figure 1: Port of Valencia. Inner Basin. 1910 ca. 27 Figure 2: Port of Valencia. 1920 ca. 27 Figure 3: Quay for General Cargo. 1960-1970 29 Figure 4: Cleveland Mineral Terminal (unloading towers) 30 Figure 5: Tiber ship from Sea-land Company. First call at Valencia serviced by “the Liebherr” crane at Marítima Valenciana Terminal. 1972 31 Figure 6: First container crane at the Port of Valencia: “the Liebherr” at the “miniterminal” in 1972 32 Figure 7: Example of subsystems in a container terminal 41 Figure 8: Horizon Singapore Terminals. Liquid bulk por t terminal (Singapore Jurong Island – Singapore) 45 Figure 9: Offshore terminal with single buoy mooring 46 Figure 10: Example of the layout of a liquid bulk terminal 47 Figure 11: El Musel dry bulk port terminal (Port of Gijón – Spain) 48 Figure 12: CHS dry bulk port terminal (Port of Duluth – USA) 49 Figure 13: Hopper and bucket system in El Musel (Port of Gijón – Spain) 50 Figure 14: Special bulk unloading facility “Jellyfish” (Port of A Coruña – Spain) 52 Figure 15: Example of the layout of a dry bulk terminal 54 Figure 16: Marítima Candina general cargo terminal (Port of Bilbao – Spain) 55 Figure 17: Example of the layout of a conventional general cargo terminal 56 Figure 18: Bergé Carport Sagunto ro-ro terminal for vehicles (Port of Sagunto – Spain) 57 Figure 19: Quay layouts for a Ro-Ro terminal 58 Figure 20: Example of the layout of a ro-ro an ferry terminal 59 Figure 21: Noatum Container Terminal Valencia (Port of Valencia – Spain) 61 Figure 22: Example of the layout of a container terminal 62 Figure 23: Tisur Multipurpose Terminal (Port of Matarani – Peru) 64 Figure 24: Example of the layout of a multipurpose terminal 65 Figure 25: California United Terminal (Port of Long Beach – USA) 71 Figure 26: Examples of reachstackers 74 Figure 27: Terminal P. Castellón (Port of Castellón – Spain) 75 Figure 28: Straddle carrier and storage yard 77 Figure 29: RTG yard. Noatum Container Terminal Valencia (Port of Valencia – Spain) 79
10 Figure 30: Automated RMGs (ASCs). APM Terminals Virginia (Port of Virginia –USA) 82 Figure 31: Relationships between equipments (ship-to shore cranes, internal and external trucks and RTGs) 86 Figure 32: Proposal for strategic map for a container terminal 92 Figure 33: Conflict of interests in a port terminal 96 Figure 34: Time accounting system for berth operations 100 Figure 35: Basic matrix of performance measurement dimensions 103 Figure 36: Port terminal capacity by subsystems 113 Figure 37: Berth capacity of port terminals 119 Figure 38: Container terminal storage capacity 151 Figure 39: Yard layouts according to type of terminal 153 Figure 40: Chassis yard at Global Gateway South (Port of Los Angeles – USA) 154 Figure 41: Chassis yard at California United Terminals (Por t of Los Angeles – USA)155 Figure 42: Reachstackers yard at Terminal Polivalente Castellon (Port of Castellón – Spain) 156 Figure 43: Reachstackers yard at Puerto Quetzal (Puerto Quetzal – Guatemala) 157 Figure 44: Reachstackers yard at San Antonio Terminal Internacional (Port of San Antonio – Chile) 158 Figure 45: Straddle carriers yard at TCB, S.L. (Port of Barcelona – Spain) 158 Figure 46: Straddle carriers yard at Eurogate Container Terminal (Port of Hamburg – Germany) 159 Figure 47: RTGs (6+1) yard at Noatum Container Terminal Valencia (Port of Valencia – Spain) 159 Figure 48: RTGs (6+1) yard at MSC Terminal Valencia (Port of Valencia – Spain) 160 Figure 49: RTGs (6+1) yard at Terminal Darsena Toscana (Port of Livorno – Italy) 161 Figure 50: RTGs (7+1) yard at TECON Santos (Port of Santos – Brazil) 161 Figure 51: RTGs (8+1) yard at Brani Terminal (Por t of Singapore – Singapore) 162 Figure 52: RMGs (9) yard at London Thamesport (London Thamesport – United Kingdom) 163 Figure 53: RMGs (8) yard at APM Terminals Virginia (Port of Norfolk – USA) 164 Figure 54: RMGs (9) yard at Antwerp Gateway Terminal – DP World (Port of Antwerp – Belgium) 165
11 Figure 55: Example of yard layout with RTG (6-wide, 1 over 4) 168 Figure 56: Example of yard layout with RMG (9-wide, 1 over 4) 168 Figure 57: Model of Container Terminal (CUT and DT) – Green Valley Port 182 Figure 58: Calculation of annual average productivity of vessel at ber th (P) 240
Index of graphs
12
Graph 1: Relative waiting time (T w /T s) and berth occupancy ratio (Ø) according to queue system (M/E4/n and E2/E4/n) for 1, 2 and 3 berths 123 Graph 2: Relationships between berth occupancy ratio (Ø) and relative waiting time for M/M/n, M/E2/n and M/E4/n queue system and 1 to 6 berths 125 Graph 3: Relationships between berth occupancy ratio (Ø) and relative waiting time for E2/E2/n and E2/E4/n queue system and 1 to 6 berths 126 Graph 4: Annual berth capacity for M/E4/n queue system and relative waiting time of 0.05 with berths of 300 metres in length 135 Graph 5: Annual berth capacity for E2/E4 /n queue system and relative waiting time of 0.05 with berths of 300 metres in length 136 Graph 6: Annual berth capacity for M/E4/n queue system and relative waiting time of 0.10 with berths of 300 metres in length 137 Graph 7: Annual berth capacity for E2/E4 /n queue system and relative waiting time of 0.10 with berths of 300 metres in length 138 Graph 8: Annual berth capacity for M/E4/n queue system and relative waiting time of 0.20 with berths of 300 metres in length 139 Graph 9: Annual berth capacity for E2/E4 /n queue system and relative waiting time of 0.20 with berths of 300 metres in length 140 Graph 10: Level of service for M/E4/n case for n=2 and n=3 and berth of 300 m 144 Graph 11: Annual Storage capacity (TEU/ha per year) according area density and dwell-time 177 Graph 12: Storage static capacity of the yard equipment as the result of annual capacity requirements and dwell-time 178 Graph 13: Throughput forecast for model of Container Terminal (CUT and DT) – Green Valley Por t 184 Graph 14: Comparison of berth capacity in the CUT with the throughput forecast 189 Graph 15: Comparison of berth capacity in the DT (E2/E4/n) with the throughput forecast 193 Graph 16: Comparison of berth capacity in the DT (M/E4/n) with the throughput forecast 195 Graph 17: Trends of berth capacity of CUT and DT related to waiting ser vice (M/E4/n) 196 Graph 18: Comparison of stacking capacity for RTGs and SCs in the CUT (15% of transhipment) with the throughput forecast 200
13 Graph 19: Comparison of stacking capacity for RTGs and SCs in the DT (75% of transhipment) with the throughput forecast 201 Graph 20: Restricting capacity in the CUT for T w /T s =0.20 206 Graph 21: Restricting capacity in the DT (M/E4/n) for T w /T s =0.10 207 Graph 22: Natural variability of berth occupancy ratio. The M/E4 /5 case 210 Graph 23: Curves superimposition for M/EK /4 queue systems, with K from 4 to 7 211 Graph 24: Berth occupancy ratio correspondence with the relative waiting time of M/E4 /n queue systems, for n between 5 and 6, and constant vessel lengths 216 Graph 25: Improvement of berth occupancy ratio 218 Graph 26: Worsening of Berth occupancy ratio 219 Graph 27: Annual berth capacity for M/E4/n queue system and relative waiting time of 0.05 with berths of 250 metres in length 225 Graph 28: Annual berth capacity for E2/E4 /n queue system and relative waiting time of 0.05 with berths of 250 metres in length 226 Graph 29: Annual berth capacity for M/E4/n queue system and relative waiting time of 0.10 with berths of 250 metres in length 227 Graph 30: Annual berth capacity for E2/E4/n queue system and relative waiting time of 0.10 with berths of 250 metres in length 228 Graph 31: Annual berth capacity for M/E4/n queue system and relative waiting time of 0.20 with berths of 250 metres in length 229 Graph 32: Annual berth capacity for E2/E4 /n queue system and relative waiting time of 0.20 with berths of 250 metres in length 230 Graph 33: Annual berth capacity for M/E4/n queue system and relative waiting time of 0.05 with berths of 350 metres in length 232 Graph 34: Annual berth capacity for E2/E4 /n queue system and relative waiting time of 0.05 with berths of 350 metres in length 233 Graph 35: Annual berth capacity for M/E4/n queue system and relative waiting time of 0.10 with berths of 350 metres in length 234 Graph 36: Annual berth capacity for E2/E4 /n queue system and relative waiting time of 0.10 with berths of 350 metres in length 235 Graph 37: Annual berth capacity for M/E4/n queue system and relative waiting time of 0.20 with berths of 350 metres in length 236 Graph 38: Annual berth capacity for E2/E4 /n queue system and relative waiting time of 0.20 with berths of 350 metres in length 237 Graph 39: Relation between number of movements and productivity (gross) of vessel at berth (sample of Port of Valencia, 2010) 241
Acronyms
€ Euro
AGV Automated Guided Vehicle
ASC Automated Stacking Crane
BSC Balance Scorecard
ca. Circa. Approximately
CFS Container Freight Station
cont.Container
CTQIContainer Terminal Quality Indicator (Germanischer Lloyd trademark)
CUT Common-user Terminal
DEA Data Envelopment Analysis
DGMM Dirección General de la Marina Mercante (Spain)
DRMGDouble Rail Mounted Gantry crane
DT Dedicated Terminal
ESPO European Sea Ports Organisation
FL Frontloader
GT Gross tonnage (volume measurement)
GVPA Green Valley Port Authority
h Hour
ha Hectare
KPIs Key Performance Indicators
l.m. Linear metre
Lo-Lo Lift on – Lift off
LoS Level of Service
m Metre (meter in USA)
Max.Maximum
MASPORT MASPORT: Automation and Simulation Methodologies for the Assessment and Enhancement of Port Container Terminal Capacity, Performance and Level of Service
MFOM Ministerio de Fomento (Ministry of Public Works, Spain)
14
N/A Not applicable
NV Naamloze vennootschap (similar to a Spanish S.A.; or a Public Limited Company in United Kingdom)
O/D Inland origin and destiny trade
OHBC OverHead Bridge Crane
OPPE Organismo Público Puertos del Estado (Spain)
P Annual average productivity of vessel at berth
PPRISMProject “Port Performance Indicators, Selection and Measurement”
prod.Productivity
R/D Receipt and Delivery
RMGRail Mounted Gantry crane
ROM Recomendaciones para Obras Marítimas (Maritime Civil Works Recommendations)
Ro-Pax Roll on – Roll off and passengers
Ro-Ro Roll on – Roll off
RS Reachstacker
RTG Rubber Tyred Gantry crane
S.A. Sociedad Anónima (Public Limited Company)
S.L. Sociedad Limitada (Limited Liability Company)
SC Straddle carrier
ShC Shuttle Carrier
SLU Sociedad Limitada Unipersonal (Single-member Limited Liability Company)
t Metric tonne (103 kg)
T+C Tractor + Chassis
TEU Twenty-foot Equivalent Unit
TOS Terminal Operating System
TRB Transportation Research Board
UNCTADUnited Nations Conference on Trade and Development
Ut Unit
15
Notation
α o Net storage coefficient
ε Relative waiting time
Φ Berth Occupancy or utilization factor in the queueing theory
Ai Storage area according to type of traffic i
AY Storage area or yard area
AYN Net storage area
AT Terminal area
CB Berth Capacity
CY Terminal annual yard capacity
CS Static storage capacity
DY Storage area density
DT Terminal area density
go Occupancy factor, or peak factor
Ground-slotsNumber of slots available for a TEU on the ground at a terminal
h Average stack height
H Maximum height of stacks or nominal height of equipment
hi Stack factor
HF/HE Maximum stack height of full/empty containers
K Operational factor
KF Operational factor for full containers
KE Operational factor for empty containers
K separation Berthing gap coefficient
KYTS Container yard capacity vs. container berth capacity transformation coefficient
n Number of berths
P Average productivity of vessel at berth
Q Amount of cargo to be handled in a call at port
16
si
Gross unit area required by type of traffic i
Tdw Dwell Time
TF/TE Average dwell time of full/empty containers
T p Vessel time at port
T s Service time (vessel berth time)
T w Waiting time
t year Quay operating hours per year
TS Percentage of transhipment
17
18
Acknowledgement
This manual is the result of work undertaken as part of the project entitled MASPORT: Automation and Simulation Methodologies for the Assessment and Enhancement of Port Container Terminal Capacity, Performance and Level of Service, financed by the National Plan for Scientific Research, Development and Technological Innovation (R+D+i) 2008-2011.
The authors greatly appreciate the trust that the Ministry of Public Works and the Ministry of Science and Innovation has placed in the project and the team charged with the task of executing it. Similarly, the authors would like to thank all the members of the MASPORT Project team for their cooperation and dedication: TCV Stevedoring Company S.A., MSC Terminal Valencia S.A., Polytechnic University of Valencia and Open Kode S.L.
Finally, we would like to give our special thanks to all those people, companies and institutions that have cooperated by lending material to illustrate the handbook:

• ARTURO MONFORT MULINAS
• PORT AUTHORITY OF A CORUÑA
• PORT AUTHORITY OF VALENCIA
• CARPORT SAGUNTO S.L. (GRUPO BERGÉ Y CIA., S.L.)
19
Seaport Capacity Manual: Application to Container Terminals
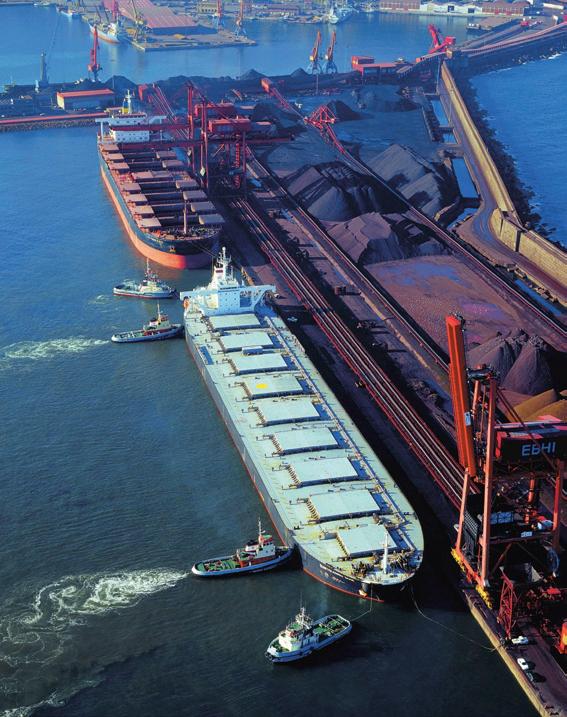
• EUROPEAN BULK HANDLING INSTALLATION, S.A. (E.B.H.I., S.A.)
• FANTUZZI NOELL IBERIA SLU
• HORIZON SINGAPORE TERMINALS PRIVATE LIMITED
• KONECRANES AUSIO SLU
• LIEBHERR-WERK NENZING GMBH
• SBM OFFSHORE N.V.
• SVETRUCK AB
• TERMINAL INTERNACIONAL DEL SUR S.A. (TISUR)
20
21 Acknowledgement
Que el blanco sea blanco, que el negro sea negro, que uno y uno sean dos, porque exactos son los números,… depende Depende… ¿de qué depende? de según como se mire, todo depende…
(White being white/ black being black / one and one makes two/ because numbers are exact,…it depends / It depends… what does it depend on?/ It depends on the way we look at it...)


Jarabe de Palo, 1998

22
Introduction
The objective of this study is to present a methodology for calculating the capacity of port terminals that can be used as a practical manual to plan container terminals.
The ongoing challenge in relation to planning port infrastructures is to organise and anticipate supply to meet demand of traffic growth or demand over time and to do so in sustainable way, in terms of economic, social and environmental. This normally ends up becoming a document known as the Port Master Plan or the Master Plan for Infrastructures. So, while forecasting demand is not easy, assessing supply capacity is much more difficult than may seem at first glance.
Supply must be planned and developed taking into account sustainability. This means, first, to maximize the use of the existing resources (infrastructure, superstructure, infostructure and labour), and secondly, to have new resources available to cover what the former cannot absorb. This task generally sparks a debate regarding environmental issues and the utilisation of the waterfront. Moreover, in order for the supply created to be competitive, which is a must, there have to be satisfactory and well known levels of service that must also be constantly monitored and controlled.
23 01 01
Seaport Capacity Manual: Application to Container Terminals
The historical and in fact presently topical interest in studying and analysing port performance is due to the development of several port planning and operating roles. Therefore, this task is necessary, for example, in order to:
• Plan port infrastructure and superstructure (quay, areas and equipment), that is, to plan supply capacity;
• Improve infrastructure and superstructure capacity;
• Establish port handling charges; or,
• Enhance infrastructure and superstructure productivity.
When addressing the task of forecasting demand, the technique called “generating scenarios” has been used from long time ago; and in the case of some of the port services (those to the cargo and the vessels), the use of measures of productivity to estimate the berth and yard needed. Now, it is the time to take a brief look back over the last quarter of the 19th century, taking the Port of Valencia as the common case study.
Understanding the past
In 1878, engineer Alejandro Cerdá, the Director (1874-1882) of the Port of Valencia Works Board (old name for the Port Authority), as part of the “Report on the technical specifications of the Port basin”, stated that starting with some 250,000 tonnes of traffic that year, he predicted an annual growth since 1883 of 50,000 tonnes up to a total of 1,250,000 tonnes 20 years later (1903). He added that “should we be able to confirm the handling of 400 tonnes a year per metre of quay line during that time, the port must have 3,125 linear metres of quays for loading and unloading, adding a quarter of this total for stairs, angles, curves and the rest of the quay that cannot be used, in which case, 3,750 metres of quays would be required”.
He also said “we must insist that this interesting figure is not extravagant, because even if the tonnes handled by the port increased by less than we assume, 400 tonnes per metre of quay line is a maximum that would make it difficult to use the quays”.
Engineer Manuel Maese (1896), Director of the Port of Valencia Works Board (18881902 and 1918-1924), in the “Report on the technical specifications of the seawalls for the enlargement and improvement of the Port of Valencia”, stated that “annual traffic has reached 753,000 tonnes and, as this figure has risen by 38,000 tonnes over the period
24
dating from 1877 to 1891, it can be expected to exceed 2,000,000 in 30 years time (1921), providing nothing happens that markedly disturbs the output, wealth or economic personality of the country”. The Port of Valencia had little more than 2,000 metres of quays at the time, and Maese argued that if annual performance amounted to 300 tonnes per linear metre, 2,000,000 tonnes would require nearly 7,000 metres of quay, concluding that further works were necessary to be able to construct up to 5,000 metres of additional berths in the future.
Indeed, in the beginnings of the 20th century, productivity per linear metre of quay ranged from 300 to 400 tonnes. Engineer and Professor Pedro Perez de la Sala, included international references in his work entitled “Ports and lighthouses” in 1889:
“Chevalier, from a study of the main English ports, deduces that a one-metre quay handles between 180 and 430 tonnes, taking 300 as the average. Stevenson adds a table in his treaty of ports that includes broader parameters: the lowest of 154 being found at the Santa Carolina Docks in London, and the highest of 477 in Glasgow. In Southampton the figure was 380, but could easily have been higher. In summary, when a port is well equipped for loading and unloading, it is not extravagant to indicate 400 tonnes per linear metre of quay”.
He added to the above that “we must not only take into account the dockage and draft when judging port performance; surface area is no less important. In the table referred to above that was published by Stevenson, Tyne Docks registered the highest figure of 90,000 tonnes per hectare, while Southampton recorded the lowest at 44,500 tonnes. Therefore, there is a relationship between the area of a port and dockage. In some cases, such as Genoa,Trieste and Marseille, the length of the quay per hectare varies from 90 to 200. In large commercial ports, such as London, Liverpool, Antwerp and Amsterdam, a figure of up to 350 can be reached in some basins”.
In 1911, engineer José Mª Fuster, director of the Port of Valencia Works Board (19101917) stated in the Revista de Obras Públicas (Public Works Journal) that the Port of Valencia had handled 1,083,471 tonnes in 1909 with slightly more than 2,000 linear metres of usable berths (see Figure 1). As a result, “the annual handling per linear metre of quay amounted to 537 tonnes, an exorbitant figure as it is generally considered that traffic should not exceed 300 tonnes or even 270, according to studies by the Italian Commission in charge of establishing the basic specifications for the construction of ports in that country”. Then, at a rate of 300 tonnes per year and per metre of quay, he estimated, just like Maese before him,
Introduction 25
Seaport Capacity Manual: Application to Container Terminals
that almost 7,000 metres of quay would be required to cope with the 2,000,000 tonnes of traffic forecast in a timeframe of 15 years (1924). A figure of 1,500,000 tonnes was achieved that year with practically the same length of quay.
How was it possible to achieve such extraordinary berth productivity?
It is worth adding that such “exorbitant” berth productivity was achieved with a minimum of modern machinery. In fact, in 1912 the port only had 6 electric cranes: two 3-tonne cranes on the quay that runs perpendicular to the outer east quay, another two 3-tonne cranes on the quay that runs perpendicular to the outer west quay and two 15-tonne cranes: one on the quay that runs perpendicular to the inner west quay and another on the west seawall. The port had plans to bring in 4 more at the most, as demanded by the Chamber of Commerce (two 3-tonne cranes and two 5-tonne cranes). However, Fuster himself acknowledged that “if the construction work on the seawalls and new commercial quays does not progress, there is not enough berth space for ships and it will be impossible to increase the number of cranes”. He was referring particularly to the problem of “loading oranges and fruit from the region”: “Hopper barges are overused, which leads to high transport costs for boxes, and until barges disappear, tackle will exist, as the agent that has them is interested in using them.When the enlargement of the Western Seawall on the sea side is completed and when the progress made on the outer construction work provides more shelter in the outport, there will be enough berthing space and there will consequently be no excuse for ships not mooring next to the quay” (Port of Valencia Works Board,1913).
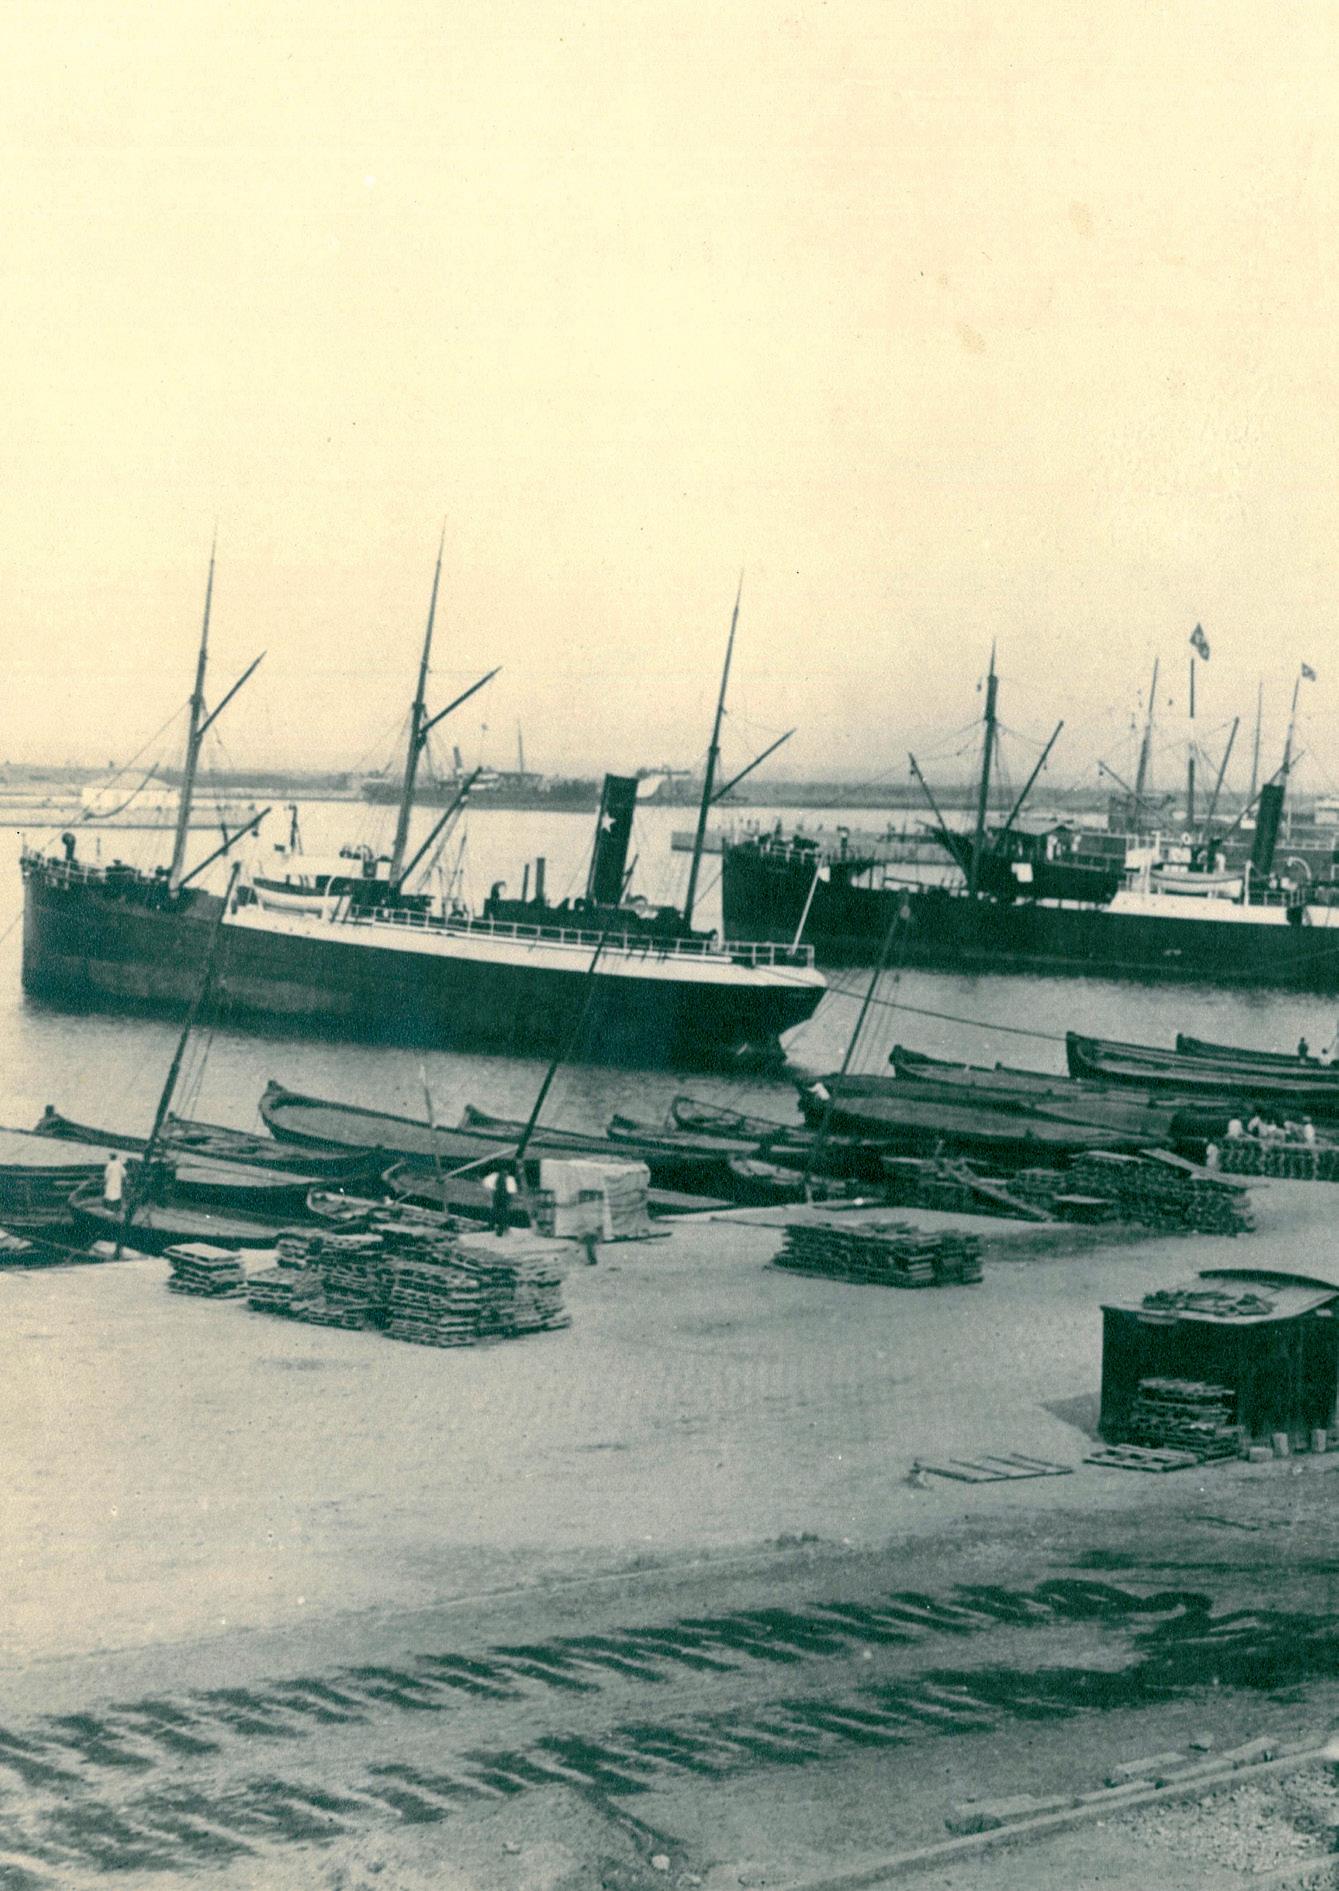
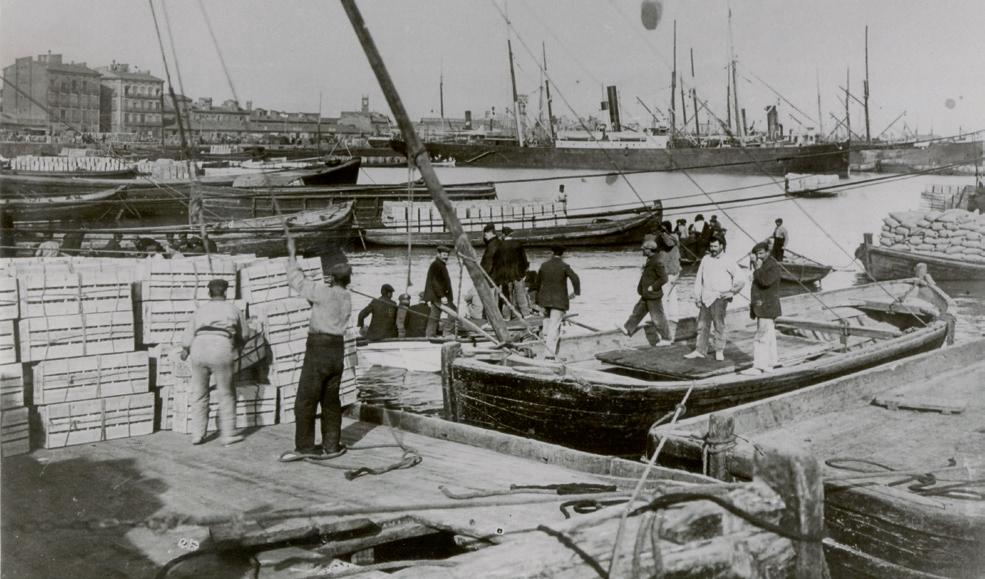
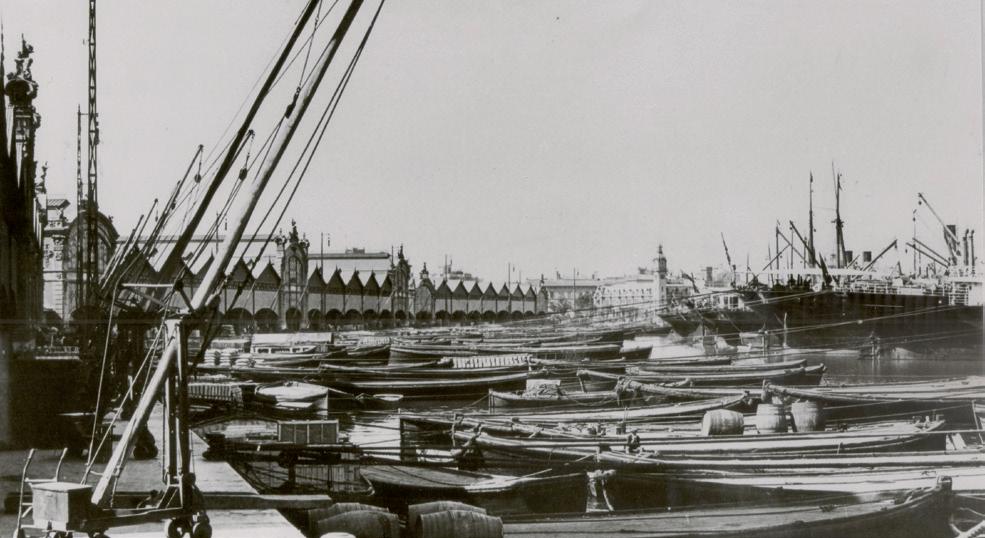
The “secret” to the aforementioned productivity was the mooring and loading system, which used cranes or floating sheerlegs (locally called “tecles”) or ship-to-shore cranes (locally called “caballetes” or “easels” in English), manned in all cases, and hopper barges. As it can be observed in Figure 1 and Figure 2, ships anchored in the basin perpendicular to the quay and were loaded using vessel gear, or vessel gear tackle (cranes and cargo booms). While productivity figures were excellent, the problem was the increase in costs mentioned by the engineer, as a result of double handling.
26
27
Introduction
Figure 1. Port of Valencia. Inner Basin. 1910 ca.
Source: Port Authority of Valencia
Figure 2. Port of Valencia. 1920 ca.
Source: Port Authority of Valencia
Seaport Capacity Manual: Application to Container Terminals
The figure of two million tonnes was reached in 1929, but with much more berthing space following the completion of the outport works planned 35 years earlier by Maese, which added 1,300 metres of berth in 1931 on the Eastern and Western Quays. Unfortunately, the Spanish civil war and World War II ensued and the port had to wait until 1958 to recover the figure of 2,000,000 tonnes in traffic.
Fifty years after the forecast made by Fuster, in 1961, Francisco Enríquez, who was also an engineer, published an article in the Public Works Journal entitled “Port Productivity”, stating in the introduction that “it would have been better to give the article a title halfway between a good-humoured one such as “port enigmas”, and the more pompous and grandiose, but not as compromising title that was actually chosen”. Enriquez was certainly right, even though the container had just appeared on the scene and the best was still to come. It is worth adding that 30 years later, the same author also wrote a series of monographic articles that address the complex world of multipurpose terminals (Enríquez, 1991).
Finally, after a brief reference to bulk cargo and before “presenting” the real star of the Manual, namely containers, we shall quote Rafael del Moral (1991), Head Engineer (19812000) and then President (2000-2004) of the Port Authority of Valencia that “the 1960s began with a plan for general cargo quays with an annual ratio of 500 tonnes per linear metre” (see Figure 3).
28
Berth productivity for general cargo had actually improved very little in more than 80 years (1878-1960).
Bulk cargo
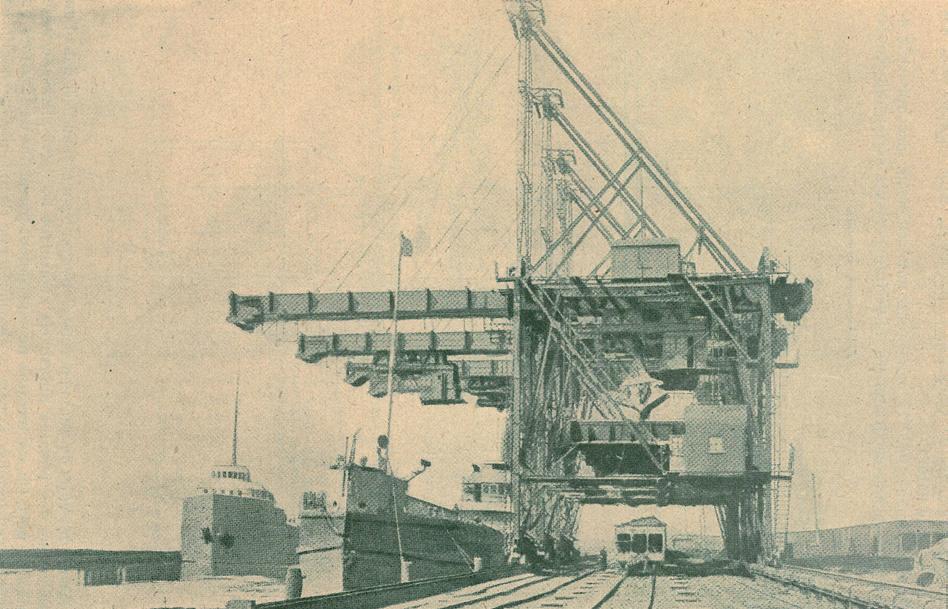
Dry bulk and semi-bulk handling was a different story, however, as this format of cargo is easier to transport. Technological advances, which resulted in greater vessel tonnage and also enhanced crane performance, boosted the development of highly productive specialised terminals. By way of example, it is worth mentioning the Hullet system for unloading minerals and coals, which was introduced in 1905. The Cleveland terminal (see Figure 4), which has 4 cranes, managed to unload 11,800 tonnes in three and a half hours. Other more conventional facilities, such as the one at the Port of Rouen, achieved daily unloading averages of 2,000 tonnes per ship-to-shore tower. Semi-bulk cargo, such as posts for mines, also had specialised facilities, as in the case of the Port of Bordeaux.
Introduction 29
Figure 3. Quay for General Cargo. 1960-1970
Source: Vigueras (1977)
Seaport Capacity Manual: Application to Container Terminals
The same can be said of liquid bulk, which was even easier to handle than dry bulk. Technological advances saw oil tankers enlarged from the T-2 tankers in the 1950s to the gigantic oil tankers of the early 1970s, with a capacity of nearly 500,000 DWT.
The container
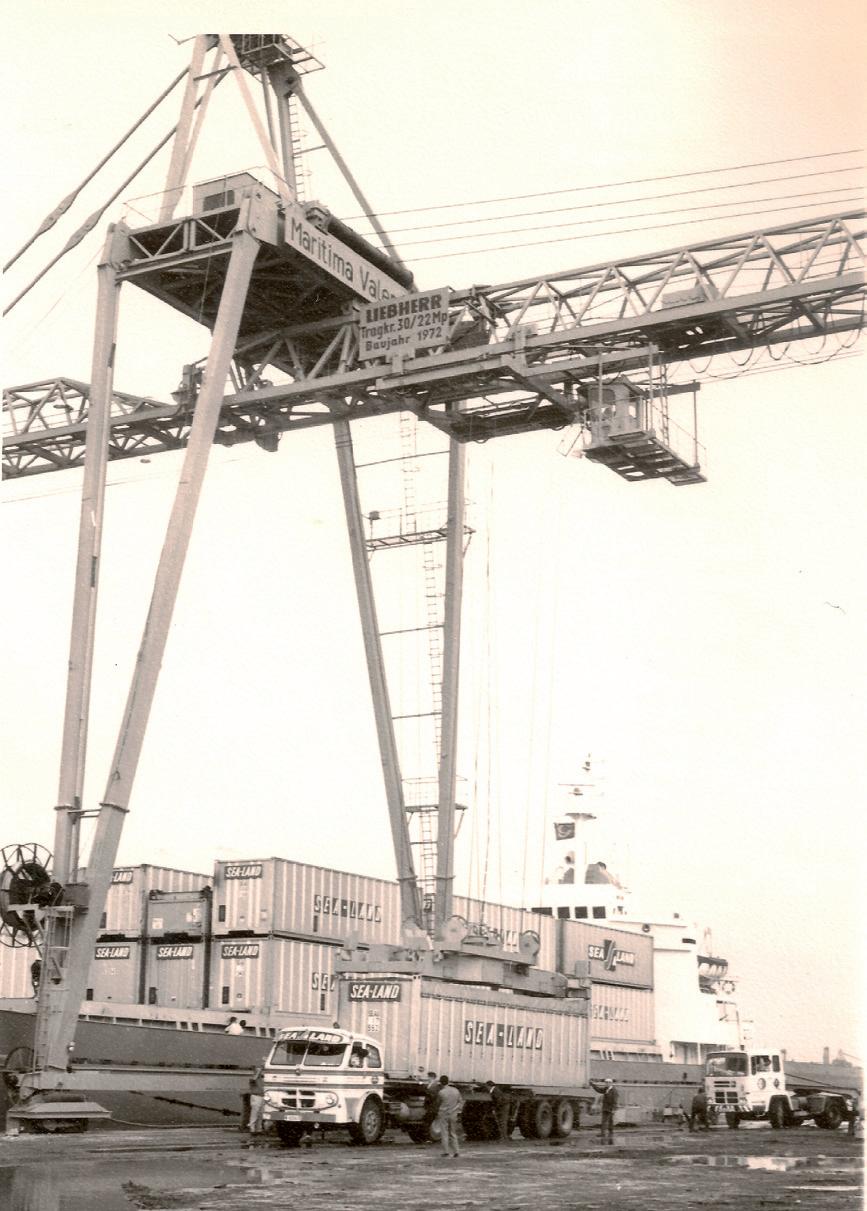
The seeds of revolution in ports in the 20th century (containers), invented in the mid 1950s by Malcom McLean (1913-2001), founder of the shipping line Sea-Land in 1960 (see Figure 5), germinated in the 1960s and gave fruit in the 1970s, constituting the start of the race for port space, due to the need for larger storage areas. Indeed, the progressive increase in berth productivity resulted in ships staying less time in port, which in turn led to an increase in the size of container vessels and the cranes capable of serving them, in a self-fuelled process that continues today.
30
Figure 4. Cleveland Mineral Terminal (unloading towers)
Source: Bénéfit (1921)
Introduction 31
Figure 5. Tiber ship from Sea-land Company. First call at Valencia serviced by “the Liebherr” crane at Marítima Valenciana Terminal. 1972
Source: Port Authority of Valencia
Seaport Capacity Manual: Application to Container Terminals
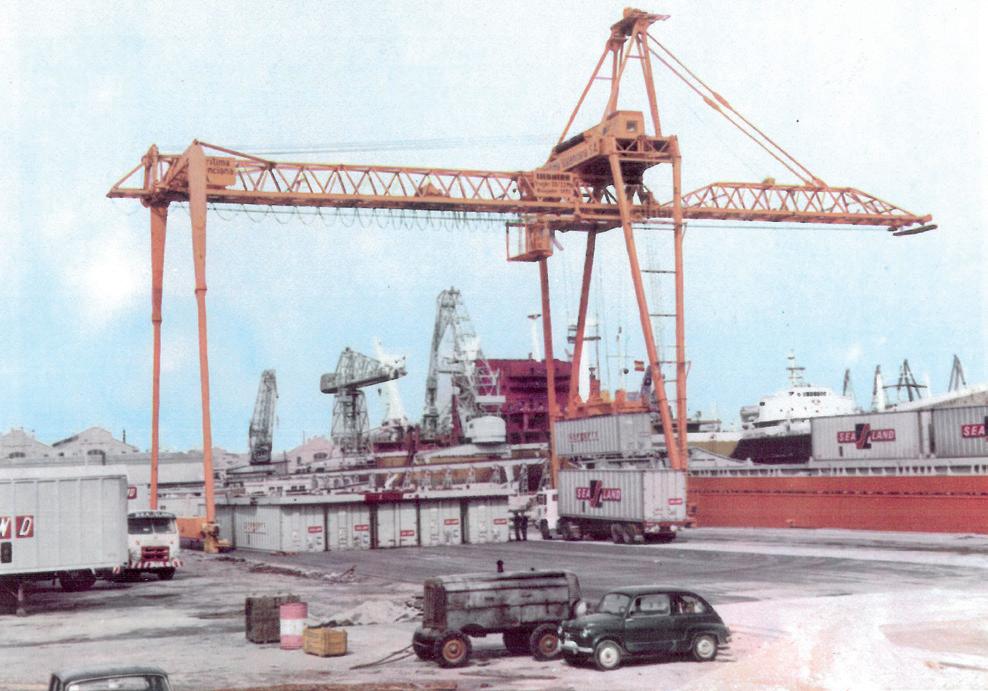
Containers first appeared on the scene at the Port of Valencia at the end of the 1960s, but grew rapidly (Monfort, 1994). In fact, the 1972 Annual Report by the Port Board (another old name for the Port Authority) explains the situation during those early years: “up until halfway through the year, container traffic was handled in conditions that only the ability to improvise could overcome. That year a private terminal station started operations as a result of a contract tender for the management of public container loading and unloading services. In the first six months, this facility has surpassed all the orders stipulated by the contract in terms of minimum number of units handled”. The competitive bidding process referred to was won by Marítima Valencia, S.A The “miniterminal” was located on the Espigón del Turia Norte Quay (see Figure 6), with a surface area of 0.71 hectares and one crane –“the Liebherr”– for loading and unloading on a 135-metre berth with 9 metres of draft.
32
Figure 6. First container crane at the Port of Valencia: “the Liebherr” at the “miniterminal” in 1972
Source: Port Authority of Valencia
Capacity
Apart from the use of empirical indicators of berth and storage productivity, the most complete reference for Spain in terms of measuring port capacity dates back to 1977. Under the title of “Quay capacity”, Fernando Rodríguez produced an extensive text on this subject, that he would later summarise in his book entitled “Managing and operating ports”, edited in 1985 by the Autonomous Port of Bilbao (old name for the Port Authority of Bilbao). The very title of the first article evokes the use of port infrastructure in a model known as a “free” or “multi operator” quay (which has fallen into disuse today), whereby several operators worked on the same quay. Progressive specialisation of port traffic and the way it grew faster has brought about a “quay-to-terminal” shift in order to enhance productivity, the new conception of these terminals now involving one sole operator (“single operator” model), generally by way of a concession or another type of contract.
Rodríguez (1977) stated that “until recent years, capacity was defined empirically establishing the performance acceptable per linear metre of quay (for example, 500 t/m for general cargo, 1,200 t/m for bulk moved by crane, etc.), which is overly simplistic because performance depends on the nature of the cargo, that is, on the make-up of the traffic, the number of cranes allocated, etc. It is true that this simplification could be partly reduced by using a more detailed scale that takes into account the circumstances indicated previously, but even still, this method is inappropriate because it does not take into account the increase in unit capacity that is caused by increasing the number of berths, as theory demonstrates and experience confirms, and such an increase cannot be covered by applying correcting coefficients as they would have to be different for each level of traffic intensity”.
In 1978, UNCTAD stated that “there has been considerable inaccuracy in predicting container terminal productivity: average throughput in a sample of 21 ports was 442 containers per 24 hours in port, which is considerably less than the figures used by consultants, experts and potential operators in their theoretical calculations”. This was followed by a theoretical calculation that yielded 860 containers in 24 hours, adding the comment that “the actual average throughput of the sample was slightly more than 50% of this theoretical figure. Clearly, the figures used in this procedure are too optimistic for planning purposes and more realistic figures should be used when calculating ship turn-around time for the economic analyses”.
Introduction 33
Seaport Capacity Manual: Application to Container Terminals
A few years later, Rodríguez (1985) established the “basic berth ratio” at “650 t/m for general cargo and 2,600 t/m for containers”. Four correcting coefficients were applied to these figures:
• For quay draft (between 0.5 and 1);
• For average call size (only for general cargo), between 0.5 and 1;
• For concessions and specialised traffic, between 1.1 and 1.2; and
• For number of berths: between 1 and 1.5.
In the case of concession of a container terminal with a draft of 12 or more metres, the ratio would be 2,860 t/m for one berth, 3,718 t/m for three berths and 4,290 t/m for six or more berths.
Dominance of the TEU
The tonne quickly gave up its place as the unit of measurement to the dominant TEU (Twenty-foot Equivalent Unit), as containers can be more or less full or empty and they come in different sizes. As a result, a new unit of measurement was required, which ended up “betraying” many authors in their calculations of performance, capacity, efficiency and level of service.
By illustrating a series of indicators for a concession contract for a container terminal, UNCTAD (1998) took 300 TEU per metre of quay as a benchmark when operations began, raising the target to 500 TEU/m by the eighth year of the contract (see Table 17 in Chapter 5).
In 1998, Drewry Shipping Consultants established the benchmark for capacity at 750 TEU/m in the case of terminals with less than 500 metres of quay line, and at 800 TEU/m for larger facilities. In 2002, the same consultancy revised its capacity benchmarks, which then ranged from 800 to 1,700 TEU per metre of quay, depending on the size of the terminal (length of quay) and the characteristics of the traffic (frequency, distribution between export/import and transhipment, etc.). Even then, the Port of Rotterdam used a ratio of 1,500 TEU per metre of quay for the long term planning of future terminals (2020).
If we take an average of 10 tonnes per TEU, the values referred to would amount to 8,000 and 17,000 tonnes per metre of quay respectively; that is, the container revo-
34
lution would have multiplied the 500 t/m figure from the 1960s by 16 and 34 times respectively.
Another interesting figure, in this case included in the terms of the tender of the Prat Quay at the Port of Barcelona (2006) for a 1,500 metre quay terminal over a contract period of 30 years, literally stated “minimum performance to be achieved throughout the entire contract period:
• On achieving maximum berth capacity, berth performance must be in excess of 1,350 TEU per metre of quay line and per year.
• On achieving maximum area capacity, storage capacity must be in excess of 750 TEU per hectare of the storage yard (excluding the space for manoeuvring, rail terminals and other areas not directly used for container storage or receipt/delivery operations). The resulting capacity will be no less than 2,000,000 TEU/year”.
Going back to the case of the Port of Valencia, we must provide the figure for containerized traffic achieved in 2010, which stood at 4.2 million TEU (49,029,766 tonnes) and that the productivity of the MSC dedicated container terminal, with 770 metres of berth, amounted to 1,807 TEU per metre of quay (22,384 t/m), which is the equivalent, in this case, of 45 times the 500 t/m achieved in the 1960s. Anyone who had been capable of anticipating this revolution would certainly have been considered a visionary at least.
The challenge of managing a port is to continue advancing along the aforementioned scale of productivity, even though the capacity of a terminal, as this Manual reveals, is not only inherent to the port itself, its dimensions and machinery, but also depends on the type of traffic it will receive and the level of service provided. These variables therefore condition maximum achievable capacity.
Yard storage capacity has occasionally constituted a bottleneck for container terminals, restricting their capacity, the most prominent factors being: the size of the storage yard, static storage capacity in relation to the handling system and, of course, container dwell time.
The methodology proposed in this Manual is the result of a combination of both analytical and simulation methods applied to port planning.
Introduction 35
Seaport Capacity Manual: Application to Container Terminals
It makes sense to use more or less complex simulation models, depending on the level of abstraction, when assessing the capacity of a terminal that is still in the design stage, particularly when valuing the variety of yard equipment. The same can be said when the objective is to improve a terminal that is already operating. Finally, it is worth mentioning that, as part of the MASPORT Project, the ai2 Institute at the Polytechnic University of Valencia has developed, parallel to the content of this Manual, a powerful simulation model with various levels of abstraction using data from the terminals managed by TCV and MSCTV for the purpose commented previously.
A draft affair
Before describing the contents of the chapters in the Manual, here is one last warning for seafarers: when calculating capacity, it is necessary to take into account the water draft and air draft of the facility. However, the objective of this Manual is not to analyse the draft necessary to serve the vessels expected to call. As a result, it is assumed that the facility has sufficient draft to provide services to such vessels.
Contents of the Manual
Following this introduction, Chapter 2 tackles the concept of port terminal as a system made up of four subsystems: ship-to-shore, yard-storage, receipt and delivery, and transfer (horizontal). This chapter also provides a classification of the different types of terminals according to cargo presentation, nature and how it is handled, depending on traffic origin and destination and on the stakeholders involved.
Chapter 3 shows the types of container terminals according to the yard equipment of the storage subsystem, describing the basic operations involved. At this point, it is worth indicating that the Manual “La Terminal Portuaria de contenedores como sistema nodal en la cadena logística” (Monfort et al., 2011a) delves into the matter of equipment and container terminal classification as well as other subjects that deals with the concept of including container terminals in the logistics chain.
Chapter 4 is devoted to disentangling the concepts for measuring port performance: operating performance, production categories, productivity and utilisation; efficiency, capacity and level of service.
36
Chapter 5 provides the methodology for calculating terminal capacity based on berth capacity by means of a combination of the analytical and simulation methods; and for calculating storage capacity, which combines the empirical and analytical methods.
A full application of the Manual is provided in Chapter 6, which is intended to clarify the practical use of the Manual, while at the same time illustrating the different variables that influence the variability of container terminal capacity.
The Manual includes four annexes, one about observations and limitations regarding the calculation of berth capacity, another about safe distances between vessels at berth (berthing gap), while the third refers to the graphs and tables of annual berth capacity according to the system and the relative waiting time for berths of 250 and 350 metres in length. The last one indicates how to calculate annual average productivity of vessel at berth (P).
Finally, an extensive reference section is provided, including both the bibliographical references in the body of the Manual, along with other supporting documents used in the Manual.
Introduction 37

38
When something is classified, it means there is a theory behind it
Jorge Wagensberg, scientist and popular sciencie writer
The port terminal
2.1. The terminal as a system
A port terminal is a modal interchange node that normally has a storage area on shore to coordinate the different rates of arrivals of overland and maritime modes of transport (Monfort et al., 2001). Its mission is to provide the means and organisation necessary to interchange cargo between overland and maritime modes as quickly, efficiently and safely as possible in both environmental and economic terms.
Similarly, according to Monfort et al. (2001 and 2011a), a port terminal can also be defined as an integrated system with a physical and information connection to overland and maritime transport networks. For analytical purposes, port terminals are considered to comprise of four subsystems:
1. The subsystem of ship-to-shore or berthing facility is responsible for the maritime interface, including all aspects of infrastructure and equipment this entails (quay, ship-to-shore machinery, etc.), and the interaction necessary at this stage with the players involved.
2. The storage subsystem usually covers the largest area of the terminal and is a temporary warehouse for cargo, allowing the
39
02 02
Seaport Capacity Manual: Application to Container Terminals
terminal to keep up with the arrival rates and assistances of the various modes of transport. The layout of this subsystem and its size depend on the type of cargo and its format, the traffic throughput, the storage equipment main type and the operational logistics (circulation directions, operational heights and zoning, cargo way of grouping) that are employed.
3. The delivery and receipt subsystem is made up of the terminal gates, temporary storage and accesses for trucks and/or railway, pipes or conveyor belts, depending on the case and the facilities used to help capture the large amount of information that is acquired in that area, and the spaces and equipment necessary to undertake the operation.
4. The transfer subsystem ensures the horizontal transportation of cargo among the foregoing subsystems. Rather than being linked to a specific physical area (as would be the case with internal transfer roads), this subsystem includes the technological solution adopted in each case for the physical and information movements that are required. Depending on the type of terminal and storage equipment, a certain type of machinery will be employed for each of the movements and for the internal transportation of cargo.
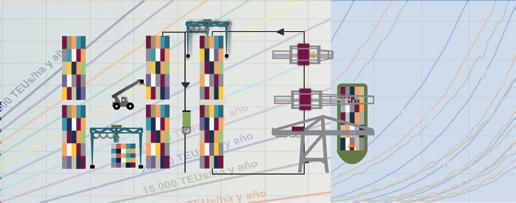
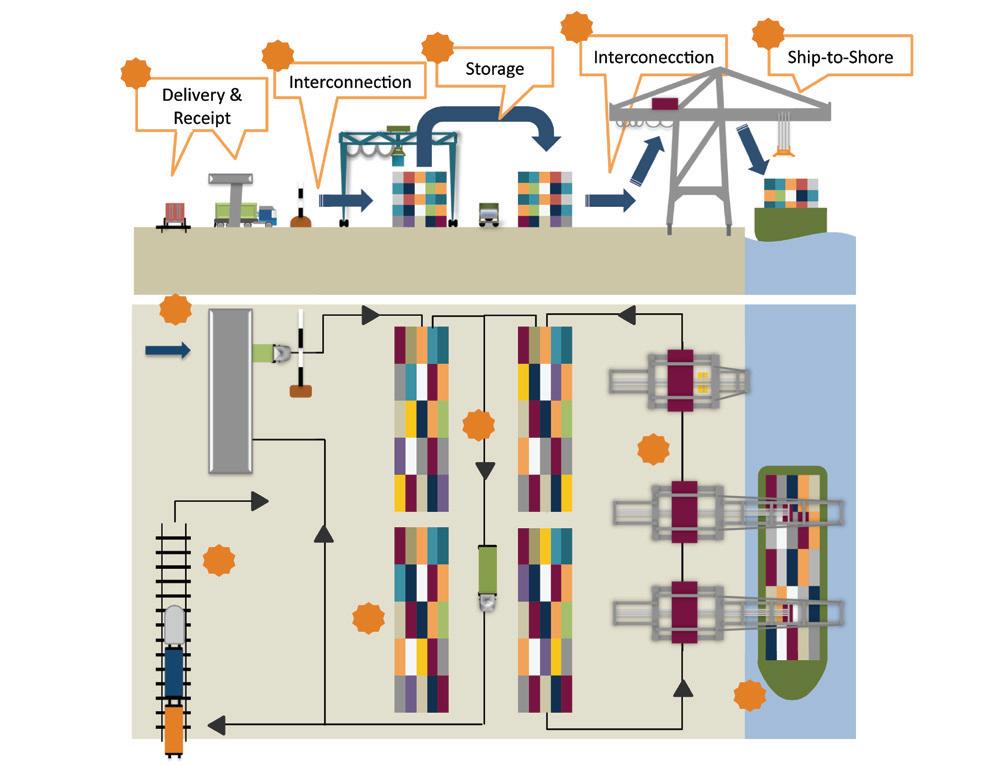
The morphology of these subsystems varies depending on the type of terminal (see Section 2.2). Figure 7 is an example of the layout of a container terminal, with its respective subsystems.
40
The port terminal
Two inseparable flows are managed in a port terminal: the physical flow of cargo and the flow of external and internal information. A third flow is the liability flow, which not always corresponds with the other two, and is not often enough considered, till when problems arise.
Each terminal subsystem has different variables that are related to each other:
• Infrastructure,
• Superstructure (equipment, , gates, buildings, lightening and any other physical installation), and
41
Figure 7. Example of subsystems in a container terminal
Source: Monfort et al. (2011a)
3 3 2 4 1 3 4 4 2 4 1
Seaport Capacity Manual: Application to Container Terminals
• Terminal Operating Systems (TOS), which are a series of equipment and software for exchanging information and generating the orders necessary to run the terminal. More and more, CIT’s are becoming the brain of the CT’s, not only for daily operational work, but also for tactical and strategic. Optimization and automation join the pure TOS and make IT’s absolutely necessary for a proper, efficient and effective running of the CT.
Some equipment and infrastructure are shared by various subsystems.
The next section presents the various types of terminals, together with the different types of equipment used in their subsystems.
2.2. Types of port terminals
There are currently several types of port terminals as a result of traffic specialisation and the handling requirements of different types of cargo. Therefore, port terminals can be classified mainly according to their traffic and the handling equipment they utilise.
With regards to the cargo, different types of port terminals stem from the combination of three classifications related to the nature of the cargo, the format it comes in and how it is handled.
Depending on their nature, ports handle a wide range of cargo, such as liquefied gas, oil products, minerals, foodstuffs, vehicles, wood, paper, electronic products, grain for (or not for) human consumption, etc. In order to classify them, several nomenclatures have been proposed. The one used by the Spanish port system classifies cargo by industry, distinguishing between the following: energy, metallurgy and other minerals, fertilisers, chemicals, building materials, farming and livestock and food, other cargo and special transport.
However, although a large majority of terminals do not specialise in handling one sole type of cargo, they do specialise in cargo formats and handling requirements (see Section 2.2.1). The different types of port terminals are described briefly below according to this classification and to the type of traffic.
42
2.2.1.Terminals according to cargo format and type of handling
This section classifies port terminals considering both the format of the cargo together with how it is handled.
The classification that enjoys the most widespread consensus in terms of cargo format includes two large groups: bulk cargo and break-bulk or general cargo, which at the same time are subdivided into dry bulk, liquid bulk and general containerized and non containerized cargo terminals respectively.
Another way of classifying general cargo is: conventional cargo and unitised cargo. Table 1 presents the different cargo formats in this classification.
General Cargo Format
Conventional
Sacks and bags, boxes… Semi bulk (logs, coils, slabs…) Parts (equipment, structures …) Heavy cargo
Palletised Pre-slung
Unitised
Source: Monfort (2005)
Containers
Chassis
As regards the handling of cargo, it can be distinguished between Lo-Lo operations (Lift on-Lift off) and Ro-Ro operations (Roll on-Roll off). Lo-Lo operations involve either conventional or specialised cranes loading and unloading the vessel above board. Meanwhile, Ro-Ro operations refer to loading and unloading Ro-Ro cargo down a ramp that vessels have to connect its cargo hold to the quay.
Apart from handling Lo-Lo and Ro-Ro cargo, port terminals perform other operations, generally with larger tonne/hour ratios, which are specially designed for loading and unloading bulk cargo that is not crane-lifted or Ro-Ro, but instead transferred by special facilities such as pipelines or conveyor belts, among others.
The port terminal 43
Table 1. Classification of general cargo and transportation format
Seaport Capacity Manual: Application to Container Terminals
Format
Handling operation
Liquid bulk Special facility
Dry bulk Special facility
Lo-Lo (conventional)
Non containerized general cargo Lo-Lo Ro-Ro
Containerized general cargo
Source: Monfort (2005)
Lo-Lo Ro-Ro
Considering all the above criteria, port terminals are classified as follows: bulk (liquid and dry), general cargo (conventional general cargo, Ro-Ro and Ro-Pax cargo and containers) and multipurpose.
2.2.1.1. Bulk terminals
Within the category of bulk terminals, it is worth distinguishing between liquid bulk and dry bulk terminals depending on the manner on which the cargo is presented.
2.2.1.1.1. Liquid bulk terminals
Liquid bulk terminals are port facilities devoted to handling liquid bulk such as oil, oil products, chemical products, liquefied gas, vegetable oils, etc.
44
Table 2 matches cargo format to how it is handled.
Table 2. Type of handling operation by cargo format
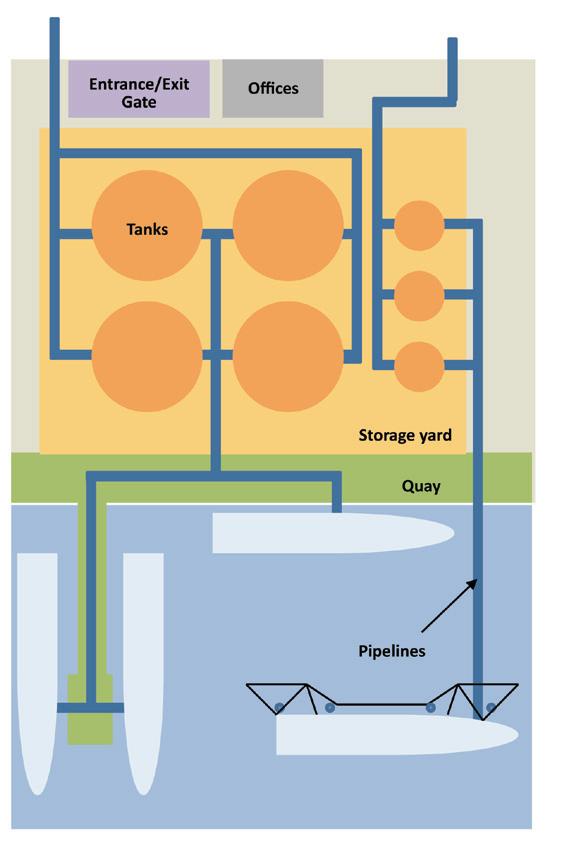
The layout, dimensions and operations performed in these terminals depend on their role and the nature of the cargo. They can basically be classified as transhipment and storage terminals or terminals that supply a given industry or refinery and distribute their products.
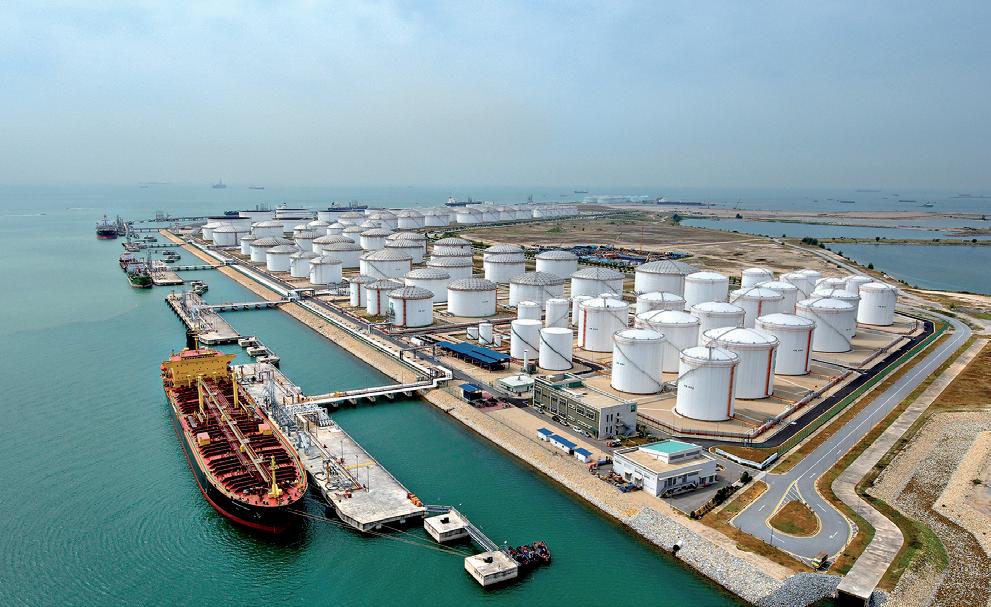
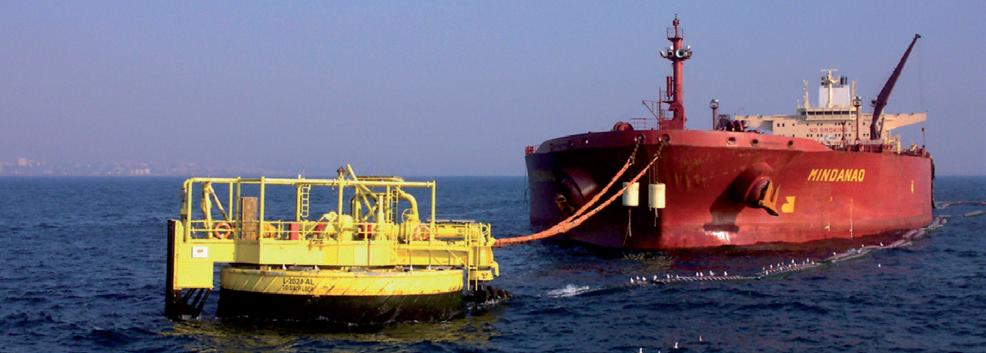
Similarly, several types of terminals are also defined in accordance with their nature and the location of their berthing operations. In this sense, there are terminals in onshore ports (see the example in Figure 8) and offshore terminals (Figure 9), with or without areas and superstructure for storing products. Despite their structural differences, they have one feature in common: regardless of whether or not there is a storage yard, their operations are performed continuously without the need for any handling equipment other than a network of pipes and a pump system (eventually the only need of heating systems for viscous liquids).
45
The port terminal
Figure 8. Horizon Singapore Terminals. Liquid bulk port terminal (Singapore Jurong Island – Singapore)
Source: Horizon Singapore Terminals Private Limited
Seaport Capacity Manual: Application to Container Terminals
In order to gain a better understanding of their operations, each of these types of terminals is described briefly.
Liquid bulk terminals located in onshore ports and with storage facilities consist of a berthing facility (either a quay or a pier) and a certain number of tanks (see Figure 10). Piers can be I, L or T-shaped and are equipped with mooring dolphins. Onshore port terminals are the most common facilities for handling liquid bulk.
At these types of terminals, once a vessel has moored at the quay or pier, loading and unloading is performed by means of pipes that connect the quay to the storage tanks.
Meanwhile, offshore terminals are made up of single or multiple buoy moorings and a pipeline that runs under the seabed connecting the vessel to the land facilities where the cargo is stored.
Both in the terminals at onshore and offshore ports, cargo is received and delivered by means of a pipeline or by tankers, depending on the amount and the product.
When these terminals are responsible for directly supplying industries and refineries or for loading their products to be distributed, the cargo is stored at destination or origin, respectively. In this case, loading, unloading, transhipment and receipt and delivery ope-
46
Figure 9. Offshore terminal with single buoy mooring
Source: SBM Offshore N.V.
The port terminal
rations are performed continuously and using the same means: a pipeline connecting the vessel directly to the industry or refinery.
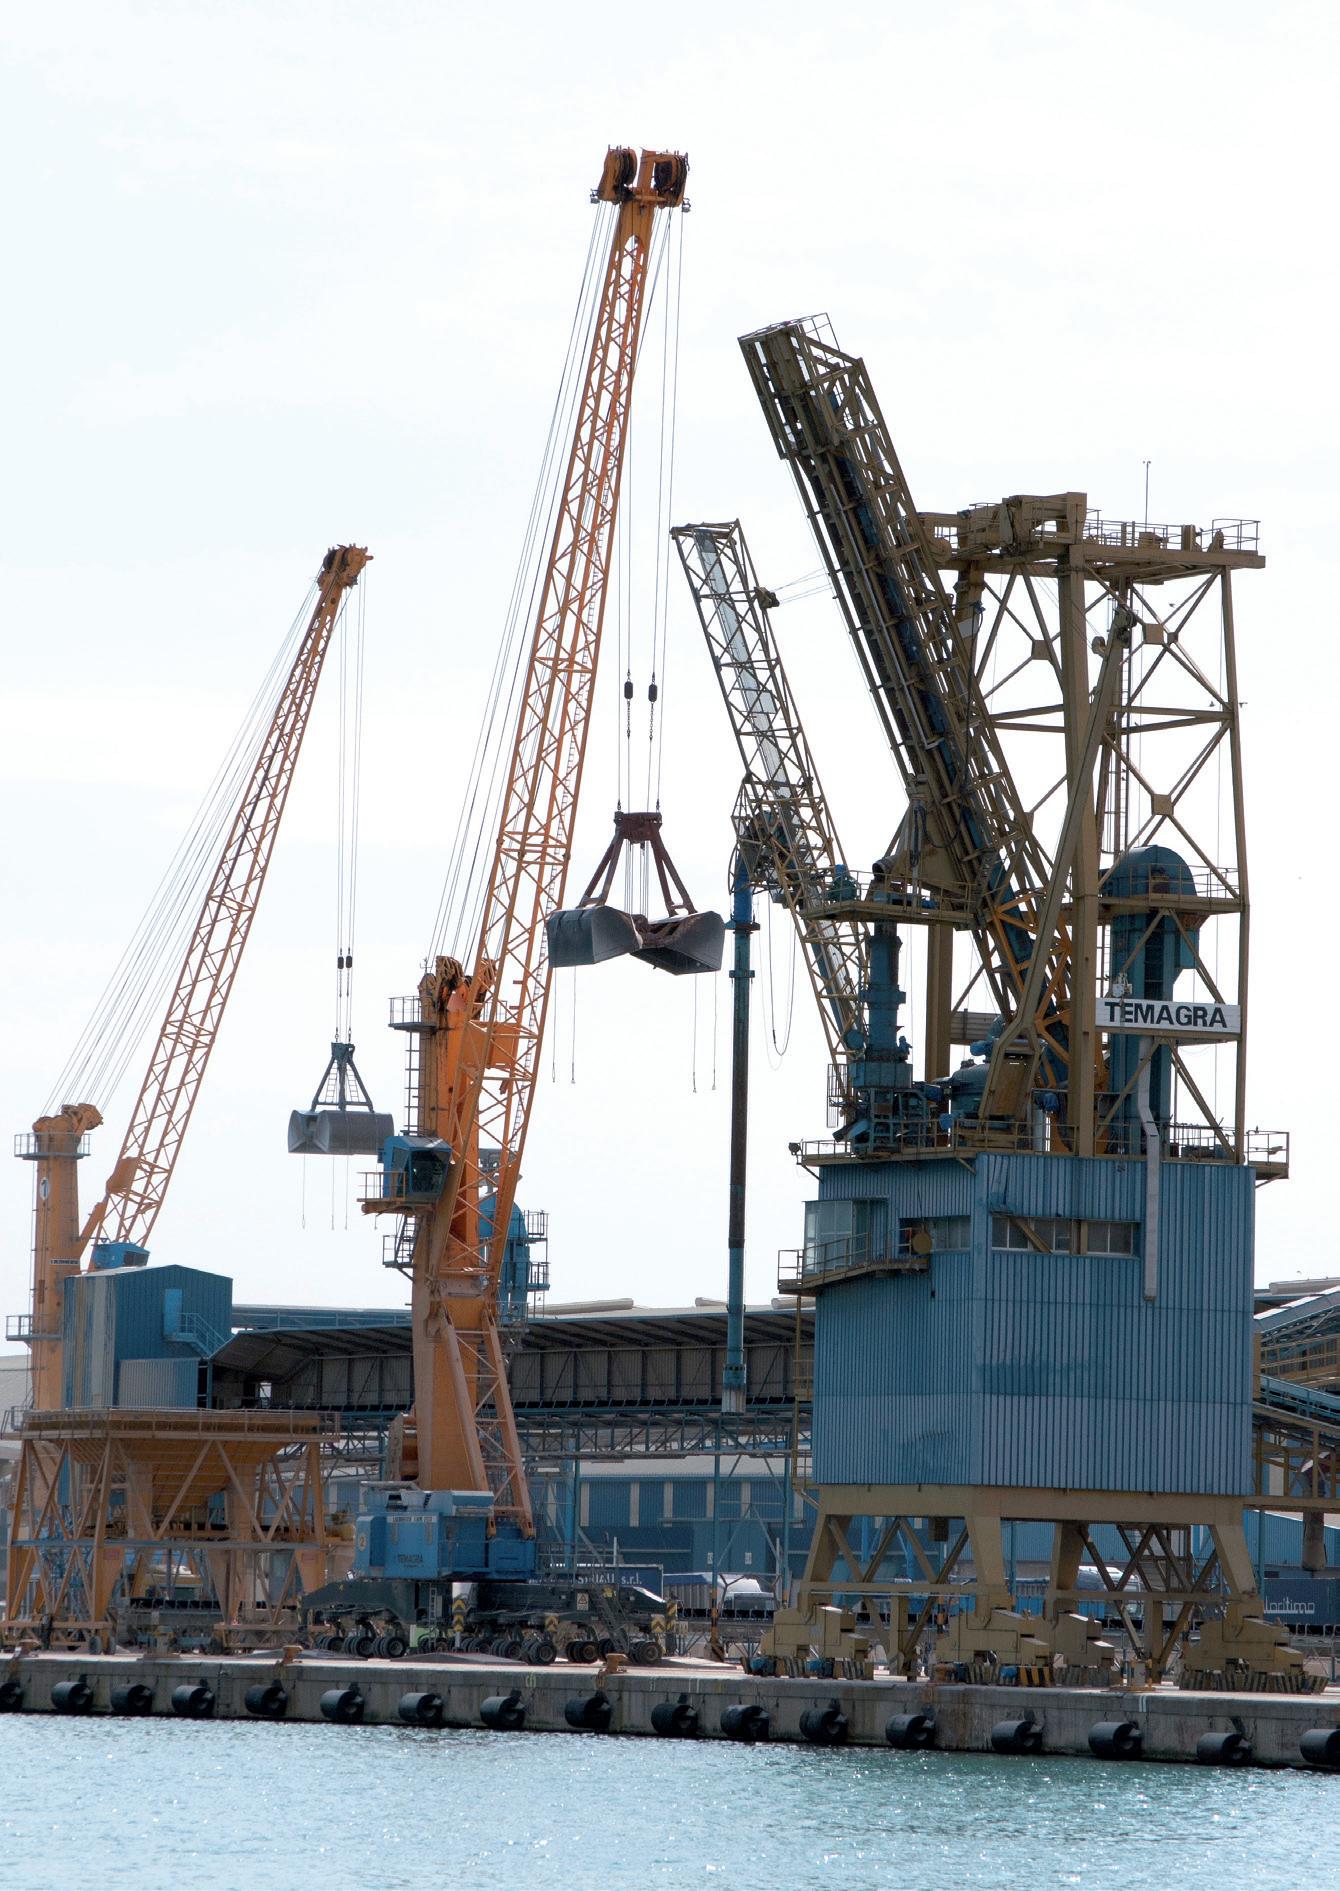
2.2.1.1.2. Dry bulk terminals
The cargo handled by dry bulk terminals mainly includes iron ore, grain, coal, bauxite and phosphates. These products make up a group called main bulk cargo, according to
47
Figure 10. Example of the layout of a liquid bulk terminal
Source: Fundación Valenciaport
Seaport Capacity Manual: Application to Container Terminals
UNCTAD (1984), while other products, such as metals and minerals for building (coke, cast iron, cement, magnesium mineral and scrap metal) and other agricultural products are grouped under the category of secondary bulk cargo.
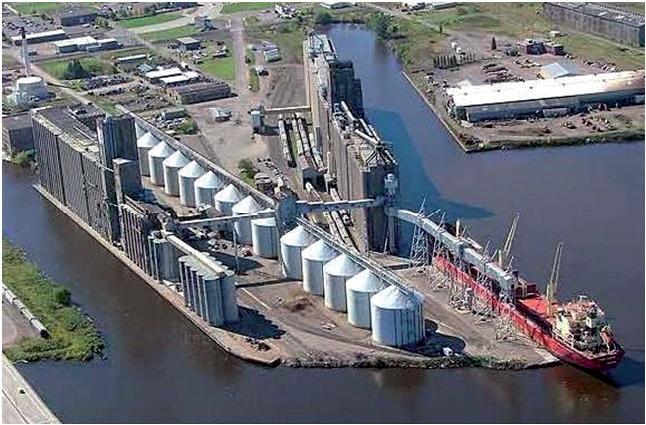
Another widely used classification differentiates between dirty bulk and clean bulk. The term clean bulk is related to products intended for human or animal consumption (grain, flour, fodder), whereas dirty bulk is cargo intended for other uses and which normally comes from mining and metallurgy (cement, clinker, coal, iron, etc.). This distinction is important when determining how the cargo is to be stored and handled. The terminal in Figure 5 is a dirty bulk terminal, while the one in Figure 6 is a clean bulk terminal.
48
Figure 11. El Musel dry bulk port terminal (Port of Gijón – Spain)
Source: European Bulk Handling Installation, S.A. (E.B.H.I., S.A.)
Loading and unloading operations in dry bulk terminals depend on several factors, such as the nature of the material, the size of the operation, the type of vessel, the weather conditions, the environmental restrictions, the distance between the quay and the storage facility and the type of operation itself, distinguishing between loading or unloading a vessel.
Therefore, apart from the conventional equipment used for performing this type of operation (grab cranes), special continuous ship loading and unloading facilities are employed. Those facilities can be classified as mechanical, pneumatic and hydraulic systems. They can be fixed, mobile or revolving, depending on how they move.When special fixed loading and unloading systems are employed, the vessel must be moved along the quay so that the hold hatch is in the correct position.
As regards loading and unloading operations, there are several alternatives. In the first place, it is possible to distinguish between operations that are performed using equipment located on the quay (the most common practice) and those which are performed using the vessel’s own means. In the second place, the loading and unloading process can be continuous or discontinuous, depending on the equipment employed.
The most common systems for unloading bulk vessels are: cranes, pneumatic systems, vertical conveyor belts, bucket elevators, screw conveyors, slurry systems and the selfdischarging vessels.
49
The port terminal
Figure 12. CHS dry bulk port terminal (Port of Duluth – USA)
Source: Duluth Seaway Port Authority
