12 minute read
The Right Tools for Planning: How
FWRJ The Right Tools for Planning: How Pearland Applied Apps, Data Analytics, and Visualization Tools to Optimize its Collection System
Kendall Ryan, Ishita Rahman, Bailey Keller, and Jameson Appel
Advertisement
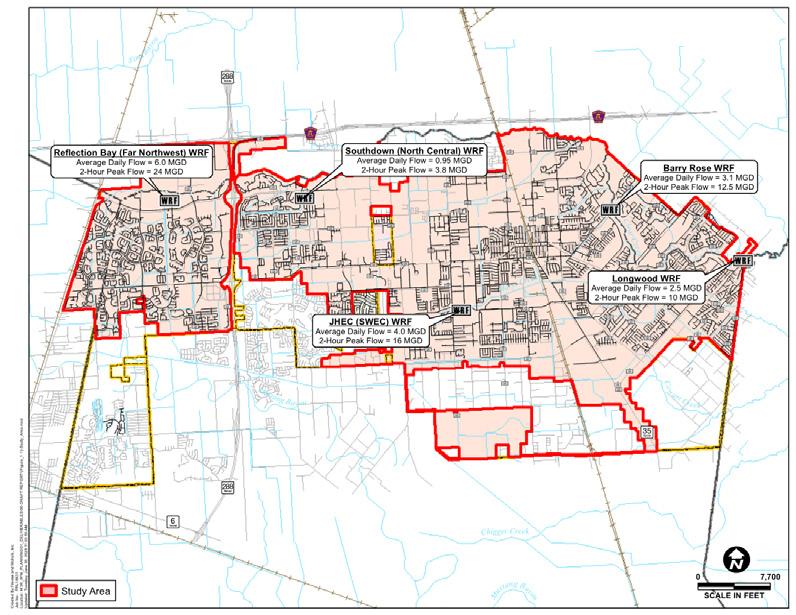
The City of Pearland (city) is home to approximately 130,000 residents and is situated in the southeast Texas metropolitan area 15 minutes south of downtown Houston. The city’s wastewater collection system (Figure 1) consists of five water reclamation facilities (WRFs), approximately 400 mi of gravity wastewater lines ranging from 2 to 54 in., and 70 lift stations throughout the system.
The city recently engaged with Freese and Nichols Inc. (FNI) to conduct a wastewater master plan, with the goals of evaluating the existing wastewater system and developing recommendations for five-year and buildout (22year) wastewater capital improvement projects. The result was a $135 million capital improvement plan that included three treatment facility expansion projects, 15 collection system capacity projects, and 67 lift station and collection system rehabilitation projects.
The city is maturing and facing the challenges of aging sanitary sewer infrastructure. As such, the utility staff is focusing more and more dollars on data collection, asset rehabilitation, and system optimization. The wastewater master plan (project) included significant investments in field data collection, hydraulic modeling, condition assessment, and system analyses. Applying efficient methods of visualizing, collecting, and cataloguing large and disparate data sets throughout the project was critical to developing recommendations to optimize the city’s wastewater system.
The application of the following three tools was key to the project: S Mapping and dashboards to visualize inflow and infiltration (I/I) S Mobile apps to collect condition information S Flagging to catalogue hydraulic model data source
Kendall Ryan, P.E., is associate and water/ wastewater master planning manager; Ishita Rahman, P.E., is water/wastewater master planning project manager; and Bailey Keller, EIT, is water/wastewater master planning assistant project manager with Freese and Nichols Inc. in Houston. Jameson Appel, PMP, CFM, is engineering and capital projects senior project manager with City of Pearland, in Pearland, Texas. The licenses for Ryan, Rahman, and Keller are in Texas only.
Visualizing Inflow and Infiltration
As part of the wastewater master plan, 32 flow meters and six rain gauges were installed throughout the collection system. The data were also utilized to measure I/I throughout the system and prioritize flow meter basins for future sanitary sewer evaluation study (SSES) projects. Flow meters were generally placed near the WRFs or larger-capacity lift stations and strategically situated throughout the system so that the linear footage of gravity lines between each flow meter was relatively consistent (Figure 2).
Consideration was also given to areas of the wastewater system with known or suspected I/I issues. For this project, flow monitoring was conducted from February to May 2019, for a total duration of 91 days.
The flow meters and rain gauges utilized in this study have the ability to collect data in five-minute increments, which resulted in over 26,000 data points per flow meter and rain gauge. During the monitoring period, seven significant
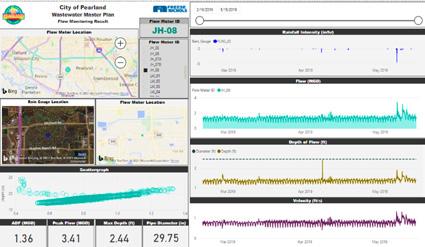
rain events were recorded by the field-testing equipment. Reviewing and analyzing this data was made more efficient by the application of PowerBI visualization dashboards; an example dashboard is shown in Figure 3.
This tool also gave the city the ability to filter through the data and look at specific rain events and the corresponding response from the collection system. Included in the dashboard tool was a scattergraph view of the flow data to identify surcharging in the gravity lines and potential causes. Unique data statistics for observed flow, velocity, depth of flow, and rainfall were also summarized for easy viewing in the dashboard.
The flow meters utilized throughout the city’s collection system helped subdivide the collection system into 32 smaller flow meter basins. Each of these basins represents the portion of the collection system upstream of each flow meter. Utilizing the data collected from the flow meters and rain gauges, a wet weather analysis was performed to calculate the volume of I/I in each flow meter basin.
The I/I represents the amount of rainwater in the pipes that has entered the system through cracks and defects in sewer infrastructure. This additional flow results in a loss of capacity in the system and an increased risk of pipe surcharging and manhole overflows. Quantifying the volume of I/I within the collection system allowed the city to create a prioritized plan to address the sewer basins contributing the most I/I.
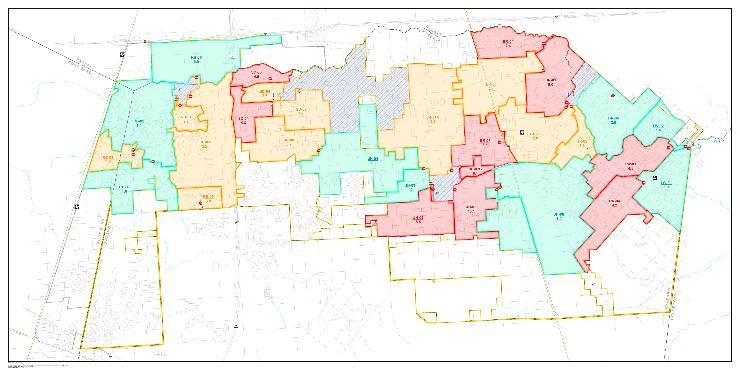
Charts and mapping were developed to help visualize the volume of I/I within each flow meter basin, normalized by the linear footage of gravity lines per in. of rainfall. Figure 4 demonstrates the ranking of basins throughout the city based on calculated I/I values, while Figure 5 shows the spatial distribution of I/I and the leakiest portions of the collection system. In Figures 4 and 5, low I/I (less than 2 gal/lin ft/in.) is shown in blue, moderate I/I (2 to 4 gal/lin ft/in.) is shown in yellow, and high I/I (greater than 4 gal/lin ft/in.) is shown in red.
Apps for Lift Station Data Collection
An important component of the wastewater master plan was evaluating the existing condition of the city’s 72 lift stations and creating a complete prioritized lift station rehabilitation plan. In order to accomplish this, a risk-based assessment of the lift stations was conducted, which considers the likelihood of failure and the consequence of failure of each asset. In this study, a detailed field condition assessment of each lift station informed the likelihood of failure. Seven component groups were evaluated at each lift station site to assess the condition (Table 1).
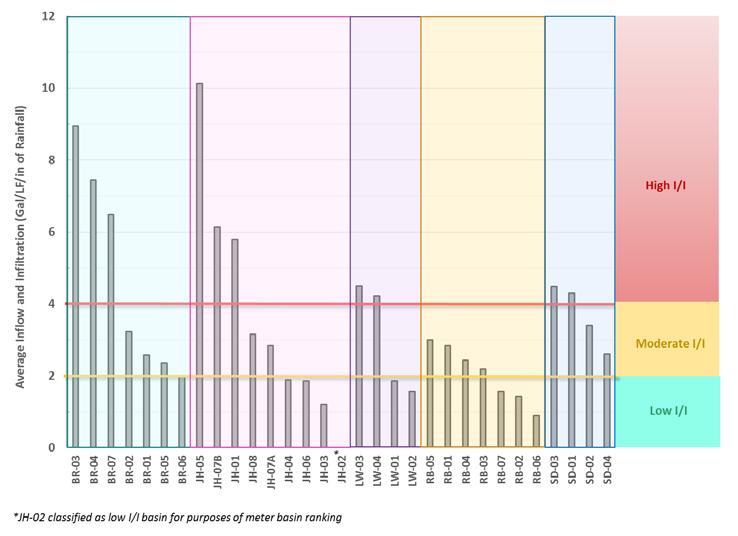
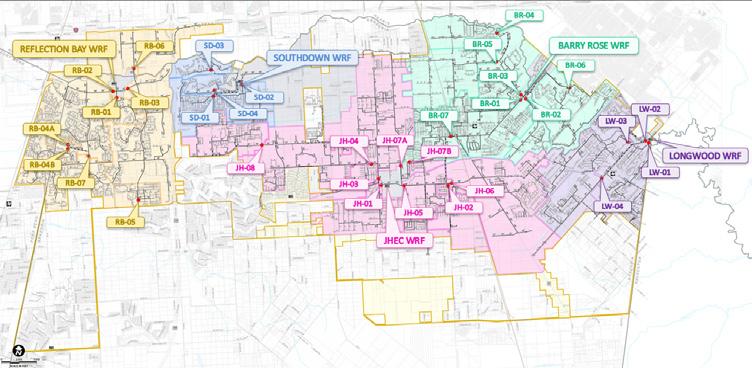
Figure 2. Distribution of Flow Meters in the Pearland Collection System
Figure 3. PowerBI Dashboard for Visualization of Flow Monitoring and Rain Gauge Data
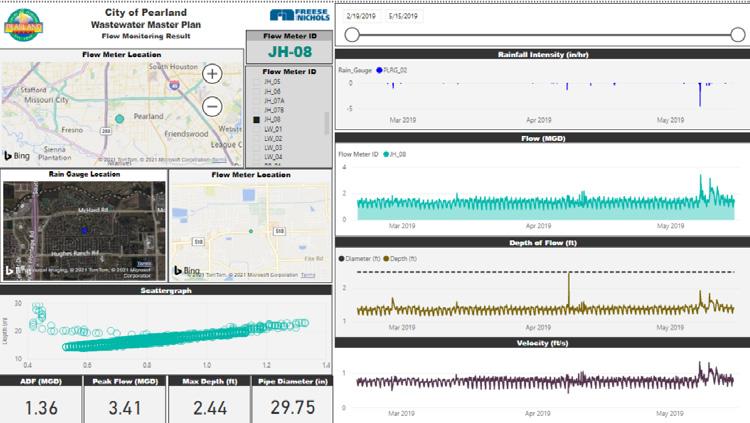
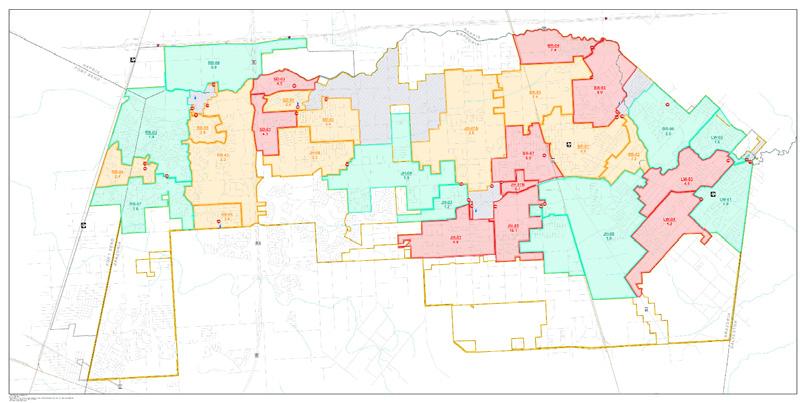
Figure 5. Inflow and Infiltration by Flow Meter Basin
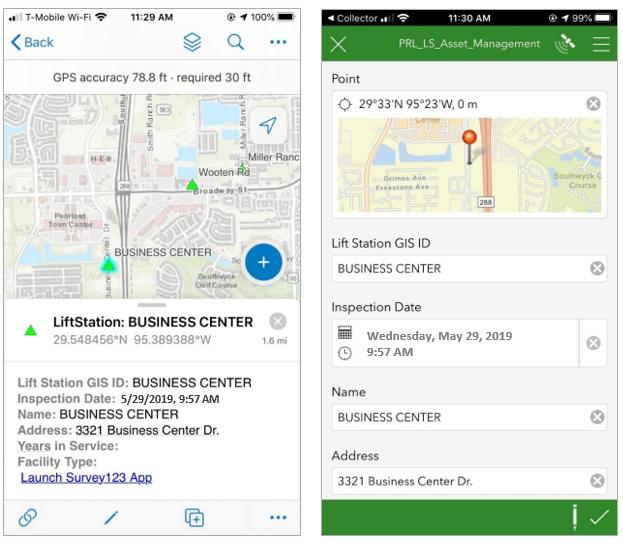
Figure 5. Inflow and Infiltration by Flow Meter Basin Continued from page 13
To streamline the field data collection process, mobile apps were developed that incorporated the condition assessment component groups. The mobile data collection tool was developed utilizing a combination of customized ESRI™ Collector and Survey 123 for ArcGIS applications. As these apps are based on ArcGIS, the project team was able to import the lift station locations into the tool for both navigation and spatial identification of the lift stations during the site visits. Each location entry also included a predetermined list of condition assessment questions. These questions were developed by a multidisciplinary project team to efficiently collect electrical, structural, mechanical, and site-specific information. The app also had options to enter photos taken during site visits and additional comments.
Because it’s mobile-based, team members could load the app onto their mobile phones and enter data simultaneously. This allowed the project team to conduct over 60 lift station condition assessments in a four-day period and eliminated the need for transcribing handwritten notes. A screenshot of the app is show in Figure 6.
The updated geographic information system (GIS) data were also utilized to assess consequence of failure. This criticality assessment was conducted for each lift station based on the four categories shown in Table 2. The GIS tools were utilized to determine the distance from each lift station to the high-impact and environmentally sensitive areas. The GIS, modeled networks, and utility billing information were utilized to determine the served connections and lift station hierarchy.
The results of the likelihood of failure and the consequence of failure calculations were utilized to develop the risk-based assessment of the city’s lift stations. Figure 7 shows an example of the detailed lift station risk-based assessment sheets that were developed for each lift station, which included facility information, individual component group scores for condition and criticality, and additional comments for each lift station.
In order to prioritize rehabilitation recommendations, the lift stations were divided into four risk categories:
Continued on page 16
Table 1. Condition Assessment Component Groups
Component Groups for Lift Station Condition Assessment
Site – Drainage, Access Drive, Fencing, Security, Pavement Mechanical (above ground) – Crane, Vent, Screen, Odor Control Instrumentation – Supervisory Control and Data Acquisition (SCADA) and Alarms Electrical – Panel Condition and Others (including Emergency Power Provision) Structure - Hatches, Wet Well Condition, Material and Piping, Odor Control
Pumps and Motors Piping and Valves
Table 2. Criticality Assessment Component Groups
Component Groups for Lift Station Criticality Assessment Proximity to High-Impact Areas Total Served Connections Proximity to Environmentally Sensitive Areas Lift Station Hierarchy

CONNECT WITH US!

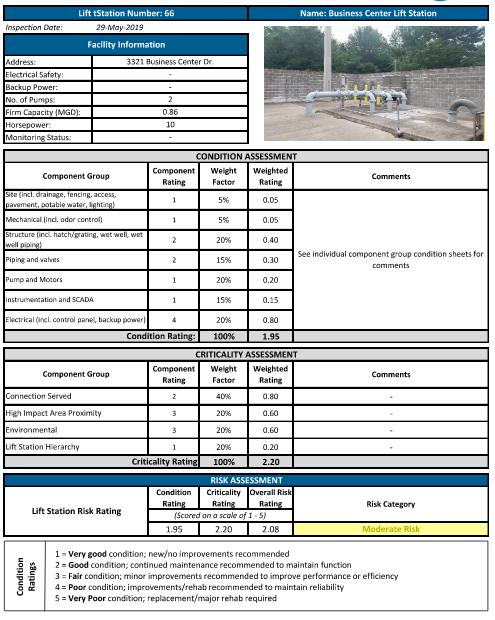
Figure 7. Lift Station Site Visit Records
Table 2. Criticality Assessment Component Groups Continued from page 14 S Extreme risk S High risk S Moderate risk S Low risk
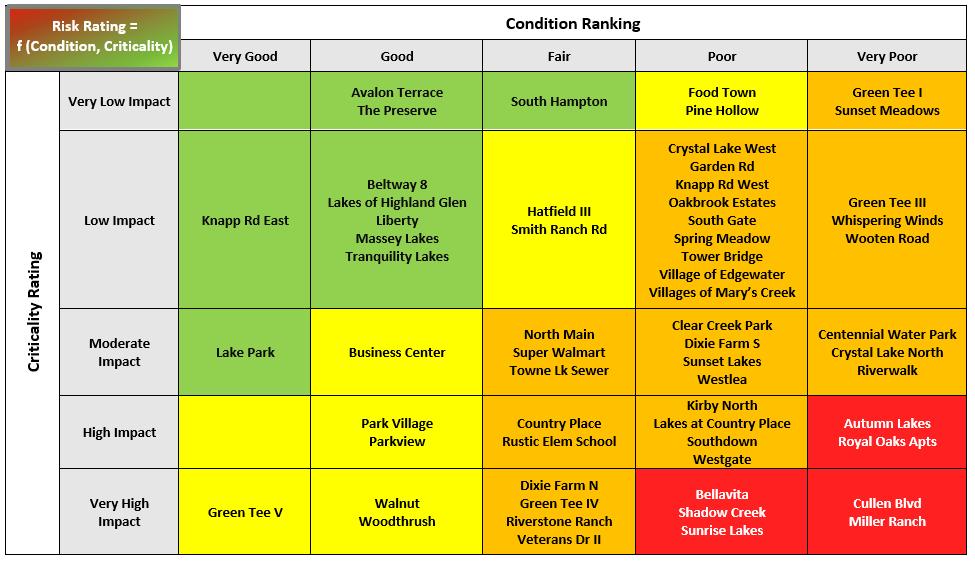
The risk scores were calculated by considering the condition and criticality scores for each lift station and enabled the ranking and prioritization of lift stations for rehabilitation. The lift stations were arranged into a risk-rating matrix, which graphically shows the condition and criticality ratings, as well as the overall risk-of-failure rating. The risk matrix is shown in Table 3. Utilizing the lift station risk-based assessment, a 20-year lift station rehabilitation capital improvement program (CIP) was established for the city.
Modeling With Flagging
As part of this study, the city’s wastewater collection system hydraulic model was updated within Innovyze ICM® software. The hydraulic model included all gravity lines 10 in. and larger and the associated facilities. This included approximately 125 mi of gravity lines and associated manholes, 54 lift stations, 128 pumps, and five treatment facilities. The basis of the wastewater model was the city’s GIS database. The city provided FNI with GIS shapefiles of the collection system components (lift stations, gravity lines, force mains, and manholes). These shapefiles were imported into the modeling software and the wastewater network was reviewed for proper connectivity. The data sources utilized for the model update included the following: S The city’s GIS database S Previous wastewater hydraulic model network (2008) S As-built information (17 plan sets) S The city’s 2019 light detection and ranging (LiDAR) data
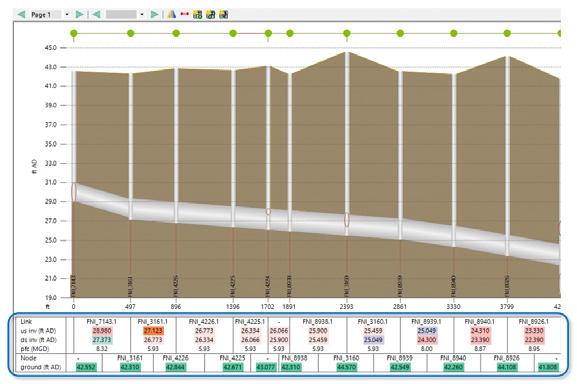
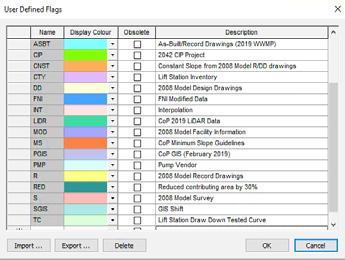
To preserve and catalogue the source information in the city’s wastewater model, information flags were created that identify the source of the information used to populate the model component data. A summary of the information flags utilized in the city’s wastewater model are shown in Figure 8. These flags are useful records for future updates and serve as a repository of source information throughout the city’s collection system network. Figure 9 shows the use of the flags in the InfoWorks modeling interface.
Immediate Benefits
The city leveraged the right tools for its wastewater master plan. Each tool had a direct and immediate benefit to the city:
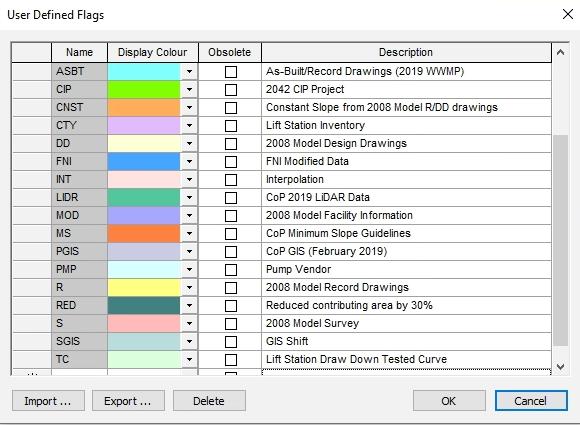
Figure 8. Wastewater Model Information Flags Figure 9. Information Flags in the Wastewater Hydraulic Model Interface
S Quantification and visualization of I/I in the collection system informed the study area for a follow-on SSES and rehabilitation project that is already underway. This SSES and rehabilitation project is consistent with the city’s goal of optimizing the collection system and maximizing the capacity of the conveyance and treatment infrastructure.
The project is incorporating focused flow monitoring to isolate problematic areas, field inspections (smoke testing, closed-circuit television [CCTV], and manhole inspections), and the development of rehabilitation recommendations and subsequent design efforts. S The condition scoring data collected via the mobile apps fed the risk-based assessment utilized to develop the city’s 20-year lift station rehabilitation CIP. This CIP helped to remove uncertainty from the annual budgeting process for the city’s 70 lift stations and provided a prioritized business case for the rehabilitation of each of these critical assets for the city. S Hydraulic modeling applications, such as development reviews and CIP updates, can identify what asset information is known and what should be validated in the future based on the data source identified in the model flags.
Summary
Successful master plans aggregate large quantities of data and transform numbers into an optimized action plan for better utility management. The success and applicability of the city’s wastewater master plan was largely due to the data collection, visualization, and analysis tools implemented throughout the project. Table 4 summarizes these planning tools, along with some key highlights and additional information about each tool.
The data collection, visualization, and analysis tools utilized in this project helped the city staff and elected leadership better understand the collection system challenges and optimize the right solutions for their city. The planning tools that were utilized can also be successfully applied at other county, municipal, and private water and wastewater utilities facing similar challenges. S

Table 4. Summary of Planning Tools
Planning Tool Visual Example Key Highlights and Additional Information
Mapping and Dashboards
Culmination of data from: • 32 flow meters • Five rain gauges • GIS database • I/I volume analyses
Visual Representation of Quantified I/I • Normalized I/I values in units of gal/lin ft/in. • Easy-to-understand color scheme highlights areas of the collection system for investment in I/I reduction efforts
Utilization: • Informed the study areas for follow-on SSES and rehabilitation projects
Mobile Apps
Data Flagging in Model
Mobile field data collection combining: • ESRITM Collector • Survey 123 for ArcGIS
Apps Customized with: • Asset location • Predetermined list of condition assessment questions • Condition score entry options (1 - 5)
Utilization: • Direct input of field-collected data into GIS
Modeling Software: • InfoWorks ICM has built-in flagging capabilities • Flagging process can be utilized in other modeling software
Utilization: • Stored reference information for future updates • Catalogued information from multiple sources, including survey, as-builts, LiDAR, interpolation, etc.


