7 minute read
The Grand Canyon Aquifer and Springs


By Hannah Chambless, Hydrologic Technician, Grand Canyon National Park
As Grand Canyon National Park (GRCA) upgrades the park’s water supply and delivery infrastructure, it is imperative to better understand GRCA water resources, especially considering climate change and mounting visitation. Currently, Grand Canyon’s water supply comes solely from Roaring Springs in the RedwallMuav (R) aquifer (Fig. 1). However, Roaring Springs is just one of hundreds of springs throughout Grand Canyon. Not only are these springs critical for human water needs, but they are also exceptionally diverse and create oases for plants and wildlife. Fun fact: springs support 44 percent of Grand Canyon plant species on only 0.01 percent of the total landscape (Tobin et al. 2020). If you come across a spring oasis while exploring the canyon, be sure to thank the aquifer for providing that water!
Roaring Springs is critical for park operations. A water pipeline built in the 1960s transports about 20 percent of the flow at Roaring Springs to facilities throughout the corridor trail system and to the North and South Rims (Bair et al., 2019). This pipeline supplies spring water to about 6.5 million visitors, residents, and partners every year. However, the pipeline is well past its lifetime and prone to frequent breaks. It’s incredible that it has even lasted for over 60 years. Due to its instability and the critical nature of supplying clean water to millions in a waterlimited region, upgrading this water delivery infrastructure is now the largest project in the National Park Service. Near-future plans are to shift the water intake for the South Rim and much of the inner canyon to surface water from Bright Angel Creek at Phantom Ranch (Fig. 2).
To better inform park management on water intake strategies, sustainable consumption of the park’s water supply, and protection of the water source, our scientists in the Hydrology Program at GRCA have been monitoring the R aquifer for over two decades. Even outside of the park service, researchers for the U.S. Geological Survey and academic institutions have been publishing work on this aquifer since the 1970s. Our current goals include answering the following overarching questions: Where does the water in the aquifer come from? How quickly does water travel through the aquifer? How is water stored in the aquifer? How vulnerable is this aquifer to contamination and climate change?
From many years of study, hydrologists have confidently identified a broad source area for this aquifer and know generally how water travels through Grand Canyon rocks. Sedimentary rock layers exposed by the Grand Canyon house two major aquifers: the shallower Coconino (C) aquifer and the deeper Redwall-Muav (R) aquifer. These two aquifers are in limestone and sandstone layers, which are porous and permeable enough to store and transport water. They are separated by layers of rock that cannot store and transport water except by faults, or fractures in rock. These faults therefore connect the C to the R aquifer, creating what is called a stacked aquifer system (Fig. 3). Next time you hike down into the canyon, notice how the trail is more level on the Hermit and Bright Angel Shales. Just like you, water has to move horizontally across the top of that surface, coming out in springs throughout the canyon.

Fig. 2. Map of Grand Canyon National Park and the Kaibab Plateau, with the locations of Roaring Springs, the water pipeline, the Bright Angel Creek Watershed shown. Phantom Ranch is the newly proposed water intake location. Bounding features to the east and west, sinkhole density on the Kaibab Plateau, and faults throughout the region are also highlighted. Map by Hannah Chambless.
We also know from previous research that water stored in this aquifer
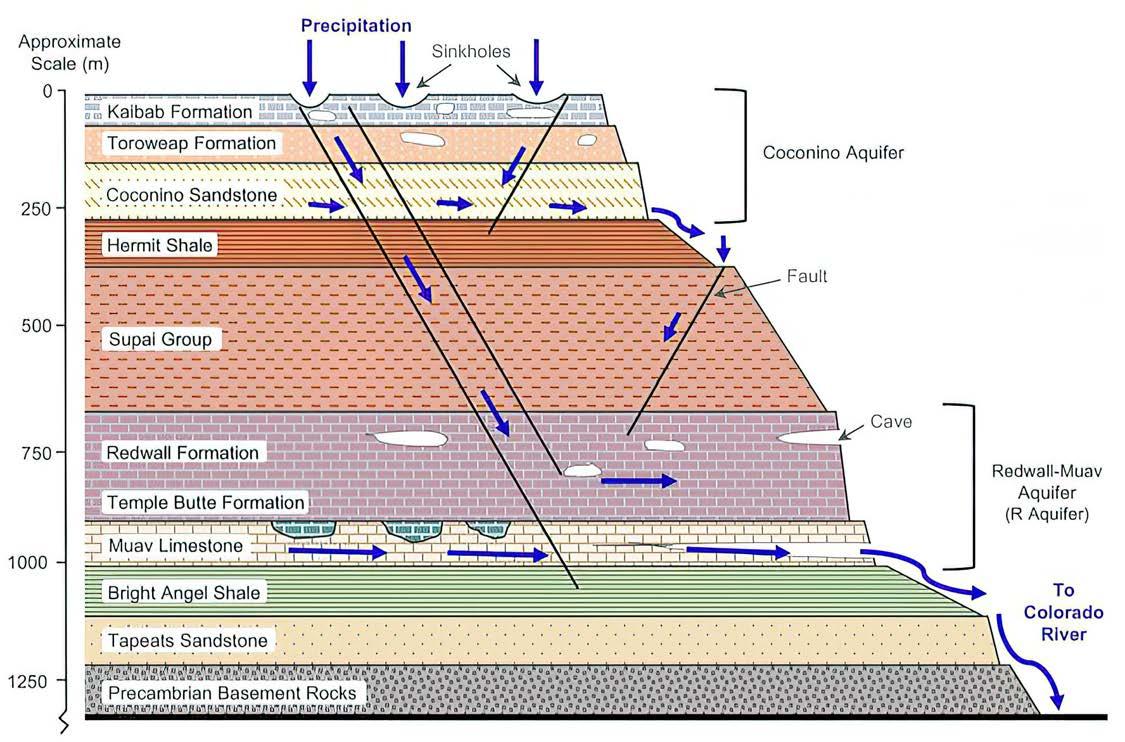
Fig. 3. Geologic cross-section of Grand Canyon rock layers and aquifer system. Modified from Jones et al., 2019.
enters the system through sinkholes on the Kaibab Plateau north of Grand Canyon (Fig. 2). Sinkholes, or depressions on the ground surface, are found all over the world and can vary from a few meters in diameter to hundreds of meters. The Kaibab Plateau contains over 7,000 sinkholes, all of which are direct connections between the surface and the aquifers below. Both snow and rain enter the subsurface through these sinkholes, though snowmelt on the Kaibab Plateau is the primary water source for this aquifer system (Tobin et al., 2018; Jones et al., 2018).
So, we know that snow on the Kaibab Plateau melts, enters the C aquifer through sinkholes, and travels up to 250 meters in depth to either flow out at springs or travel another 900 meters through faults to the R aquifer. Water in the R aquifer then flows from hundreds of springs throughout Grand Canyon. But to answer the question, “Where does the water in the aquifer come from?” more specifically, we have worked to identify which sinkholes are connected to which springs. One study from 2015 to 2017 involved injecting non-toxic dyes into sinkholes on the Kaibab Plateau and monitoring numerous R aquifer springs throughout the canyon to determine where the dyes were received. The study successfully established connections between three sinkholes and multiple springs in the canyon. We hope to fund additional dye trace projects to continue mapping sinkhole to spring connections.
Studies have also been conducted to answer the questions, “How quickly does water travel through the aquifer?” and “How is water stored in the aquifer?” The dye trace project was able to narrow down travel times on a monthly scale, but we have also used a much cheaper and faster way to start answering these questions on flow rate and storage: measuring flow at R aquifer springs. Over a decade of monitoring springs across the canyon has led to the creation of a tool called a hydrograph, or a plot that shows
the rate of water flow over time. Below is a hydrograph created for Roaring Springs (Fig. 4). Applying mathematical models to the rises and falls in water flow shown on the hydrograph can be used to determine what paths the water may take through the aquifer and how quickly springs may respond to precipitation events on the Kaibab Plateau.
The last question we are working to answer is, “How vulnerable is this aquifer to contamination and climate change?” Our hydrologists have been attempting to answer this question through a variety of projects, including sinkhole density mapping on the Kaibab Plateau (Fig. 2) and the previously mentioned dye trace study and hydrograph analyses. Sinkhole density mapping is a way for us to locate areas where sinkholes cluster, which are considered areas of high aquifer vulnerability. The more sinkholes there are, the more water that enters the aquifer! Another way to answer this question is to study changes in climate patterns on the Kaibab Plateau. Hydrologists in our program have been studying climate trends over the last century to forecast possible changes in the water supply at Grand Canyon. We have also been collecting data on possible sources of contamination on the plateau, including from car accidents, livestock, and leaks or spills from infrastructure. The bison may be adorable, but they sure leave a lot of unwanted waste in sinkholes and at springs. By comparing the locations of contamination sources and high sinkhole densities, we can identify areas of concern and protect them accordingly. From dye tracing, spring monitoring, analyzing climate data, sinkhole and contamination source mapping, and many other studies on Grand Canyon aquifers, we hope to better understand our vital water supply. To then interact with the water supply sustainably will benefit not only the millions of humans who enjoy Grand Canyon every year, but also the wildlife and plants that depend on springs for survival. We here at the park love our springs and are doing everything we can to understand and protect them. Next time you are enjoying the wonders of Grand Canyon, remember what the rocks hold just beneath your feet.
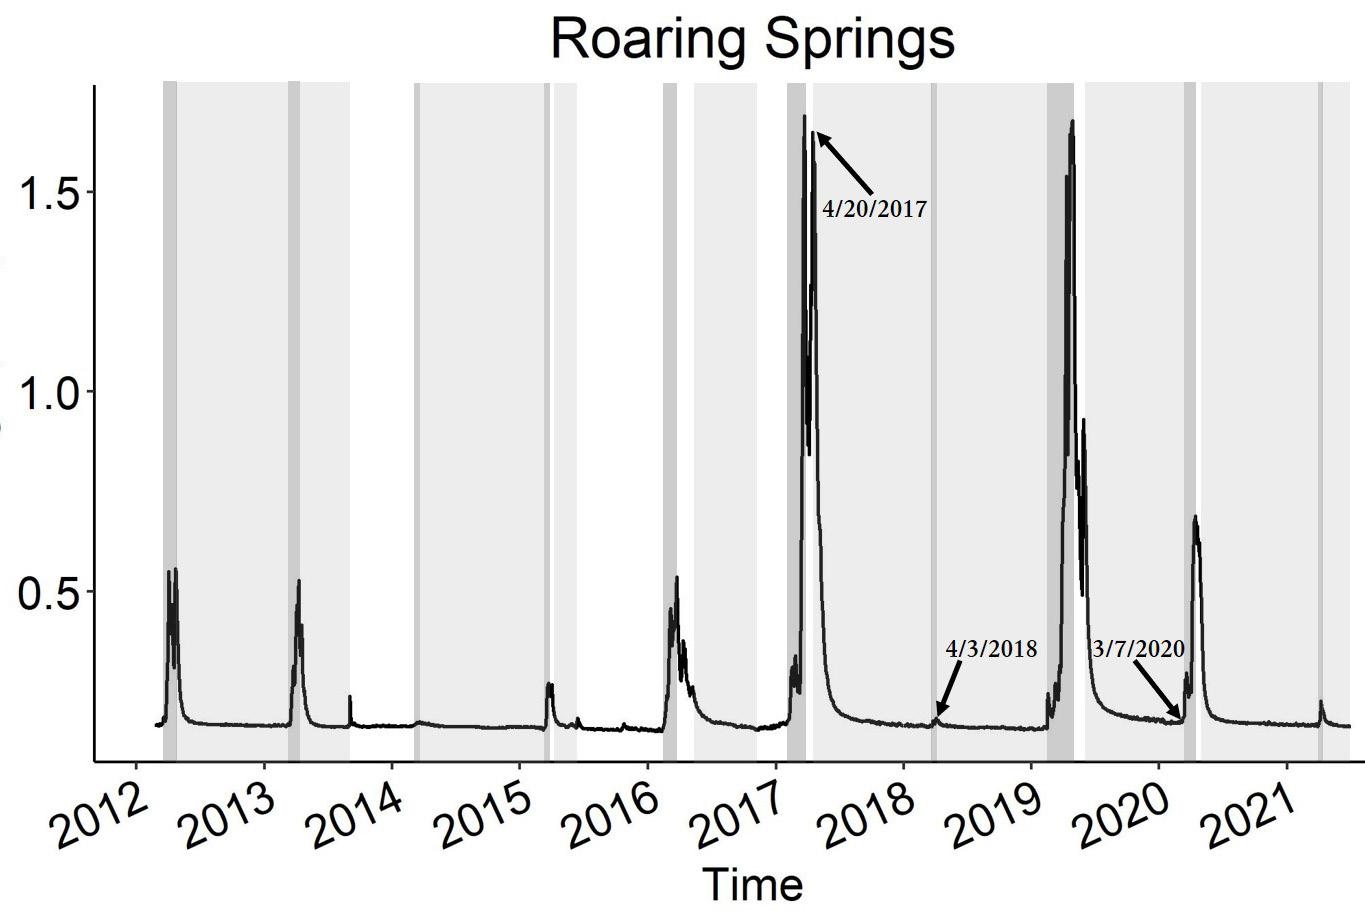
Fig. 4. Hydrograph of Roaring Springs where flow is measured in cubic meters per second. Rises in flow are highlighted in dark gray and falls in flow are highlighted in lighter gray. The first two dates are those of peak flow in 2017 and 2018, while the third is the start of the rise in flow in 2020. Hydrograph by Hannah Chambless.