
22 minute read
Mobile Mapping Trends and Insights


Data analysis by Geomares
Mobile Mapping
Trends and Insights
Mobile mapping technology is on the rise worldwide. Industry specialist Geomares – publisher of GIM International among other things – has analysed the user data and behaviour of thousands of members of the global geospatial community. This article presents the findings from that analysis, identifying the latest trends and sharing insights into the future outlook for mobile mapping.
Recent advances in mobile mapping technology are enabling new capabilities and complementing – or even replacing – traditional survey methods of topographical surveying. Futhermore, widespread investment in city planning and ‘smart city’ projects is expected to further accelerate the adoption of mobile mapping technology worldwide. 450,000 geomatics professionals visited the GIM International and/or Geo-matching websites in 2017, and a large percentage of those online visitors were interested in mobile mapping systems. This puts Geomares in a unique position to analyse website behaviour to discover trends and insights related to mobile mapping systems. To provide a balanced overview, this analysis is based on a combination of Geo-matching website data, the GIM International readers’ survey, Google search statistics and market research.
1. Application – Type of Mobile Mapper the application is a very important consideration for purchasing a mobile mapping system. if you want to map outdoor terrain (e.g. a mine or a highway) a vehicle-mounted mobile mapping system is usually most suitable. if you plan to map indoor environments (e.g. rooms, corridors, production locations) a portable and indoor mobile mapper may be more suitable. 2. Photogrammetric or Lidar Camera Photogrammetry or lidar point clouds? Both have their advantages, and the most suitable one depends on the particular application. there is one key difference that distinguishes photogrammetry from lidar, namely rgB. Photogrammetric point clouds have an rgB value for each point, resulting in a colourised point cloud. on the other hand, when it comes to accuracy lidar is hard to beat. But not all projects require the same accuracy, which is why it is always good to do some research first before you decide which method works best for you. 3. Processing Software in the article called ‘Comparing lidar and Photogrammetric Point Clouds’, which appeared in GIM International’s january/February 2018 issue, point clouds are compared for inspecting a flood control structure. in this scenario, lidar output takes far less time to process and provides a clean and sharp point cloud that is easy to work with. the photogrammetric data collection and processing took slightly longer and the point cloud required extensive cleaning. 4. GNSS/INS Positioning System operating in buildings, tunnels and mines requires advanced solutions since there is no gnss coverage. this is important to consider when choosing a gnss/ins system for your mobile mapper. 5. Compatibility the ongoing miniaturisation of sensors and electronics has led to the construction of laser scanners which are light enough to be mounted on an unmanned aerial system (uas), trolley, backpack or stick. some mobile mapping systems are compatible with a variety of applications from multiple systems (uas, backpack, car, etc.).
Behaviour of Geo-matchinG users
Data from the Geo-matching website shows strong growth in interest in mobile mappers. Geo-matching is the world’s largest product platform for surveying, positioning and machine guidance, listing more than 2,000 products from 500 manufacturers and attracting more than 250,000 users in 2017. Mobile mapping technology is one of Geo-matching’s most important sections, featuring 52 products from 25 manufacturers. In mid-2017 and 2018, Geo-matching started paying extra special attention to mobile mapping systems, with direct success. Since September 2017 the number of page views has more than doubled (see Figure 1). This shows that there is a strong interest in mobile mapping systems. In June 2018 more than 3,300 mobile mapping pages were viewed – an absolute record.
readers’ survey data
GIM International regularly surveys its readers on a number of topics, and the latest survey was conducted in December 2017 (615 respondents). 67% of the respondents indicated plans to invest in new systems in 2018 (Figure 2).
GIM International also asked its readers which type of systems they plan to invest in. 20% of the respondents plan to invest in mobile

Figure 2: Findings from giM international Readers’ Survey 2017.
mapping systems and/or portable and indoor mobile mapping systems. These results are a strong signal that geospatial professionals are considering the purchase of mobile mapping systems, and that level of demand is expected to rise further in 2018 and beyond. Another question asked which trends geospatial professionals foresee in their industry over the next fi ve years. The increasing role of mobile mapping systems is one of the most striking outcomes that can be derived from the survey results. Mobile mapping systems also go hand in hand with the need for more accurate 3D city models, as mentioned by some respondents.
GooGLe search statistics
Google Keyword Planner was used to study the search volume for mobile mappers worldwide (see Figure 3) from 2014-2018. Google statistics show that a strong increase in the search volume for mobile mappers. In 2016 there were on average 9,000 searches per month, compared with 7,000 in 2014. The average for 2018 currently stands at about 14,000 searches per month, representing an especially steep growth (of approximately 65%) in search volume from 2016 to 2018. These fi gures include searches for mobile mappers and similar terms such as mobile laser scanning, mobile mapping system, indoor mobile mapping and so on, but do not include specifi c brand or product names.
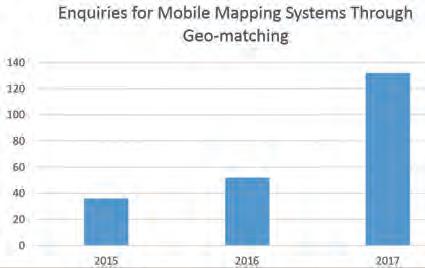
Geo-matchinG ProfiLe of tyPicaL moBiLe maPPinG users
contact manufacturers directly. This gives Geo-matching a unique insight in the user types looking for mobile mapping technology. In 2015 Geo-matching included just 16 mobile mapping systems, whereas it now features 52 – an increase of 325% in the space of three years. Geo-matching has seen enquiries ranging from major organisations like NASA and the US Army of Engineers to surveying companies of all shapes and sizes worldwide. Enquiries have also come from infrastructure companies (e.g. road survey, corridor mapping, etc.), maritime companies (monitoring of harbour walls), forensics (crime mapping and traffi c accident investigation), mining (open-pit survey, etc.) and even some surprising sources such as New York City’s Metropolitan Opera House (indoor mapping for maintenance and monitoring purposes). In 2015, 36 enquiries were made through Geo-matching, rising to 52 enquiries in 2016 and 132 in 2017 (Figure 4): a 250% increase from 2016 to 2017. The growing number of enquiries made on Geo-matching is a clear sign that mobile mapping applications are incredibly diverse and that new potential customers have entered the market in recent years. Geomares attributes this increase to greater general interest in mobile mapping systems, Geo-matching’s stronger focus on the topic of mobile mapping and the fact that there are more mobile mapping systems listed on Geo-matching.
reGionaL distriBution
types oF mobile mappinG systems
Mobile Mappers When thinking about mobile mapping, most people probably associate it with vehicle-mounted systems or ‘mobile mappers’. these devices that collect geospatial data from a mobile vehicle, typically fi tted with a range of photographic, radar, lidar or any number of remote sensing systems. such systems are composed of an integrated array of time-synchronised navigation sensors and imaging sensors mounted on a mobile platform and used for outdoor applications. the increasing demand for 3D maps of cities and road networks and the need for up-to-date 3D models form the key pillars of the expected growth of the global mobile mapping market.
Portable and Indoor Mobile Mappers Portable and indoor mobile mappers have entered the market over the past few years. the indoor counterparts of mobile mappers, portable and indoor mobile mappers fi t in a backpack or are a compact mobile device. they scan indoor environments with either cameras or laser scanners. Datasets are georeferenced and point clouds can be coloured using cameras or laser scanners. Portable and indoor mapping solutions are applied to obtain accurate representations of 3D interiors in infrastructure such as underground mines and tunnels, plants and factories, airports, shopping malls, etc.

Image 1: Teledyne Optech Lynx SG mobile mapper.
Image 2: Vexcel Imaging Panther.
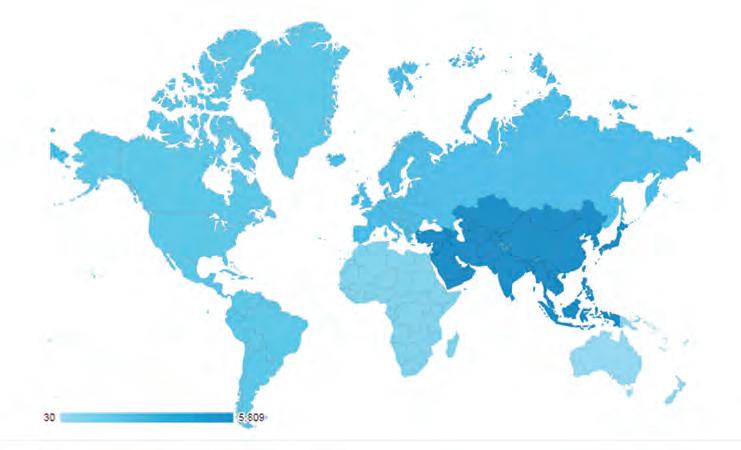
mobile mapping technology on Geo-matching are from the Asia-Pacifi c region (see Figure 5). This is an interesting fi nding that is supported by other market research stating that increased investment to develop infrastructure in Asia-Pacifi c – the need for which is created by the process of hyperurbanisation that is currently underway

Figure 3: Google search volume for ‘mobile mappers’ and related terms. NB: The peak in February 2018 is due to a national geographic article about a Lidar survey of ancient Maya structures in Guatemala.
Figure 4: Number of enquiries through Geo-matching from 2015 to 2017.
across the region – will boost demand for mobile mapping technology. As mentioned in the highly recommended article called ‘Mobile Laser Scanning Point Clouds’, published by GIM International in 2017, “the demand for 3D maps of cities and road networks is steadily increasing and mobile mapping systems are often the preferred geodata acquisition method for capturing such scenes”. This is exactly what is going on in the Asia-Pacific region right now.
ConClusion
Geo-matching website data, the GIM International readers’ survey, Google search statistics and market research all show clearly that the demand for mobile mapping technology has increased over recent years. Based on the findings from the readers’ survey and other market research reports, it is safe to say that geospatial professionals worldwide will increase their investments in mobile technology in the coming years. The value of the global mobile mapping market is expected to reach US$32 billion by 2023 at an average growth rate of 21.3% per year. Substantial growth can be anticipated in North America and Europe because of the high potential of organisations that can implement mobile mapping technology and the large number of mobile mapping service providers. Market research anticipates, however, that the Asia-Pacific region will grow the fastest, with India, Japan and China leading the way. This is attributed to increased investment for developing infrastructure, which includes city planning and smart city projects.
50% of all mobile mapping pages on Geo-matching are viewed by visitors from the Asia-Pacific region. This shows that there is a strong interest in mobile mapping technology in that region and is consistent with the above-mentioned market research. This article is based on the combination of content from various sources to provide general trends and insights related to mobile mapping. For more research data, reader survey details and/or a personalised report, please contact Sybout Wijma (sybout.wijma@geomares.nl).
further reAdIng
Mapping Market research report – Forecast to 2023 3. https://www.marketresearchfuture.com/reports/ mobile-mapping-market-5747 4. https://www.gim-international.com/content/article/ comparing-lidar-and-photogrammetric-point-clouds 5. GIM International: ‘Mobile Mapping’ by Mathias lemmens (see editorial note ‘Mobile Mapping’, page 6 of this issue)
More InforMAtIon
www.geo-matching.com
About the Author
Peter tapken is content manager for geo-matching – a leading product platform for surveying, positioning and machine guidance. He is responsible for the website content, product development and online marketing. He has a background in marketing management, having completed his Master of Business administration at the university of groningen and also gained a BBa in Mangement, economics and law from saxion university of applied sciences in enschede, both in the netherlands. peter.tapken@geomares.nl
ImprovIng raIl Infrastructure InspectIon effIcIency wIth enhanced drone platform
Aerial Data Acquisition for a Digital Railway
One of the major challenges facing railway networks is preventing failures in railway tracks. Avoiding potential track malfunctions means inspecting thousands of miles of track, while avoiding risk to inspectors and traffic interference. One innovative inspection methodology is to build a ‘digital railway’ – an accurate and dynamic visualisation tool to identify actual and potential track damage. Relying on the highest-quality data acquisition, a digital railway helps those responsible to make better informed decisions while planning and prioritising rail development, maintenance, repairs and renewal projects. This article outlines the use of such a tool in a UK railway project.
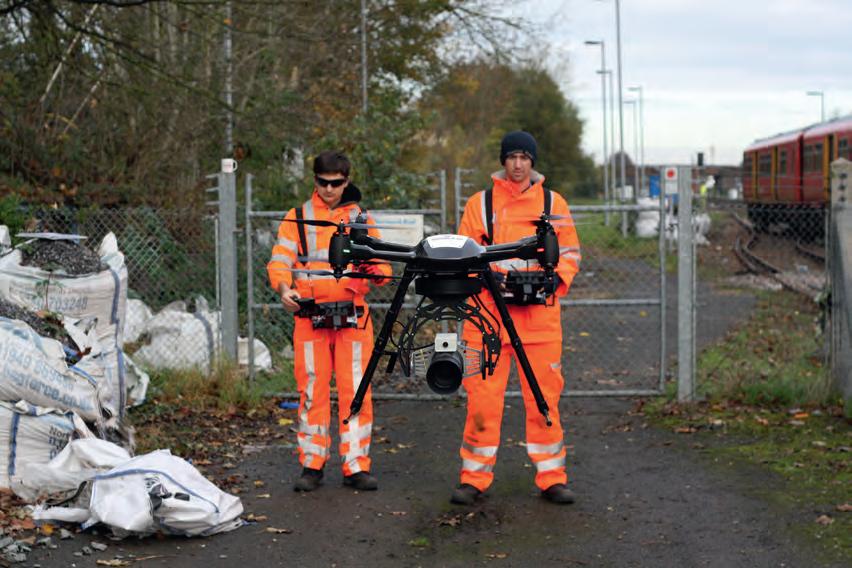
In collaboration with the UK’s Network Rail, Plowman Craven recently developed Vogel R3D. This service, based on an unmanned aerial vehicle (UAV or ‘drone’), facilitates the 3D measurement of rail infrastructure to sub-5mm accuracy. The tool was developed to conduct a comprehensive survey of rail infrastructure, offering aerial access to difficult-to-reach areas and limiting risk to ground-based personnel. High-resolution images enable the survey to capture a larger surface area in a single flight. Once captured, overlapping images are processed in photogrammetry software to produce an accurate 3D point cloud. The software’s pixel matching algorithms are used to solve the


interior orientation parameters and aerial triangulation.
New UAV plAtform
The Vogel R3D system comprises an Aerialtronics drone, known for its safety and reliability, integrated with a Phase One Industrial 100 megapixel medium-format aerial camera. The lightest weight in its category, this camera’s sensor is able to capture greater amounts of light for optimal data quality and has a high dynamic range to enable accurate measurement of both high and low-intensity objects within the same image. One of the main attributes of the system contributing to the safety case is the aircraft’s rotor setup. A total of eight rotors provide sufficient redundancy if one were to fail, whereas a motor failure on an aircraft with just four rotors would almost certainly lead to that aircraft crashing onto the tracks. It is therefore clear why redundancy and reliability are critical to safety in this kind of operating environment. The safety features, hardware redundancy and track record of the Aerialtronics platform have enabled Plowman Craven to obtain an ‘Operation Safety Case’ from the Civil Aviation Authority, permitting the flying of the UAV in congested urban areas. These enhanced flying permissions are granted only to a handful of operators. The sheer number of moving and parked
trains at some locations proves a constant challenge for the survey teams. A track can only be perfectly viewed when it is clear, meaning high levels of planning and preparation are required – particularly at busy stations where the track is unobstructed for only 60 seconds between train movements. Having the ability to manually pause surveying mid-flight until the train has passed is invaluable in this regard. In the system used, it is possible to set the photogrammetry overlap to ensure trains blocking tracks do not impact on the outputs.
UltrA-high-resolUtioN imAgery AcqUisitioN
Operating at a height of 35m, the Vogel R3D system follows a series of pre-programmed flight paths to capture thousands of overlapping high-resolution images. This ultra-high-resolution imagery is critical in the generation of high-accuracy survey-grade data and provides a complete visual record of the site as well as the measurement data. The high quality of the 100MP RAW photography captured enables the identification of even the smallest features. With ground sample distances of 1-2mm it is possible to identify markings on the sleepers and specific rail clips, as well as the location of flash butt welds. These are objects that are highly problematic for surveyors to visually locate when working on the tracks at night, equipped with just a head torch. Typically, a single UAV flight lasts around 10 minutes before a battery change is required, and approximately 300 images are captured during this time. Each individual flight is preceded by many safety checks covering both the integrity of the UAV system and any hazards within the area of operation. In its first six months working on the UK’s railways, the Vogel system completed more than 50 flying hours across a range of projects, capturing more than 8TB of RAW photography.
DigitAl rAilwAy VisUAlisAtioN
Unlike with traditional methods of conducting railway surveys, topographical survey CAD data is complemented by ultra-highresolution orthophotos and highly detailed coloured point clouds as well as the RAW photography. All this data can be provided in hard copy, as well as on Plowman Craven’s cloud-based data management platform to enable access for multiple stakeholders. The ultimate value of this visualised data is highly significant. It enables stakeholders anywhere in the world to ‘walk’ through a specific site using a tablet or computer, allowing for imagery interrogation and measurement extraction. For train operators and maintenance companies with extremely limited information on the physical characteristics of their routes, being able to access such usable, verified survey data is hugely beneficial and supports decisionmaking when monitoring, planning, predicting and preparing future railway maintenance projects.
The advantages over traditional surveys are very clear. A successful survey was completed with the Vogel R3D at Guildford in Surrey, one of the busiest stretches on the network with more than 30 trains an hour passing through. Furthermore, with three branch lines converging at Guildford Station, gaining possession of all three at the same time would not have been possible, but Vogel eliminated the need for possessions and shaved several months and significant costs off the programme. The UAV was able to survey a 1,200m stretch of track, up to eight tracks wide, in just five days and with no track access required at all. Health and safety benefits aside, the client received the full topographical survey of all permanent-way (P-Way) detail, point cloud and orthophotos in a matter of weeks. Lineside and platform gauging was also conducted.
further readIng
https://plowmancraven.s3.amazonaws.com/ panoramics/grange-slidings/index.html www.plowmancraven.co.uk/uav https://industrial.phaesone.com yuri raizman; Medium-format Cameras for Highaccuracy Mapping, https://bitly.com/medium-formatcameras
about the author
james Dunthorne is the uaV technical manager for Plowman Craven, one of the leading consultancy and surveying companies in the uK. He manages all uaV technical matters within the company and helps in the development and support of new products and services. james is also standards director for arPas and sits on the Bsi committee for uaV standards in the uK. He works with major stakeholders and government to help develop the skies of the future.
Developing a Fully Fledged CORS Map for Africa
Continuously operating reference stations (CORS) are permanent GNSS stations that log and disseminate GNSS observations continuously to meet various user needs. CORS networks have been going up all over the world in the last decade to help establish geodetic reference frames, monitor tectonic movement as well as helping surveyors to do real-time positioning. This article zooms in on Corsmap, an initiative that was founded by three geomatic professionals to be a one-stop shop for all CORS installations in Africa.
There are many online maps that provide information about CORS networks in Europe, North America and the Australasian region. For instance the US National Geodetic Survey maintains a CORS map of all the permanent GNSS stations in North America and a few other selected countries. When it comes to Africa, however, the situation is vastly different. Some information is available from the International GNSS Service (IGS), the African Geodetic Reference Frame (AFREF) and Space and Earth Geodetic Analysis Laboratory (SEGAL) maps, but these maps are mainly focused on scientific applications and, as such, do not provide a full picture of what is out there. Moreover, there is a deplorable dearth of metadata concerning CORS installations. Most of the time it is simply a point on the map. It is difficult to find a single database that offers information about all the CORS installations in Africa. It is an uphill task to begin with to have such a database given the vast number of private, public or institutional CORS providers. However, a centralised database is paramount so as to avoid a patchwork of online maps of these key installations.
cRowdsoURcing
Crowdsourcing could be a powerful tool towards this end. This is what the founders of Corsmap are trying to achieve by mapping all the CORS installations on the African continent. Corsmap is not just about providing information about all the permanent GNSS stations in Africa; it is also about enriching the experience by giving the user as much information as possible concerning a particular GNSS installation. Some of the Corsmap features include: • Numerous ways of discovering station information quickly, such as pinpointing a location with a cursor or searching by keywords • Easy and simple ways to add or edit station information for users • Ensuring a lot of metadata is displayed once a location has been pinpointed (e.g. base station provider contacts, website, information on RTK and RINEX, photo of the base station and its background, etc.) • A station detail page giving a brief introduction about a particular base station • Zoomable pinpoint locations which can be zoomed to street level • A community forum which enables users to register and add station information.
Whilst providing a lot of metadata, what the map does not provide is coordinates of the


stations and access to the data. Instead, the map points the user to the base station provider, where this information can be obtained.
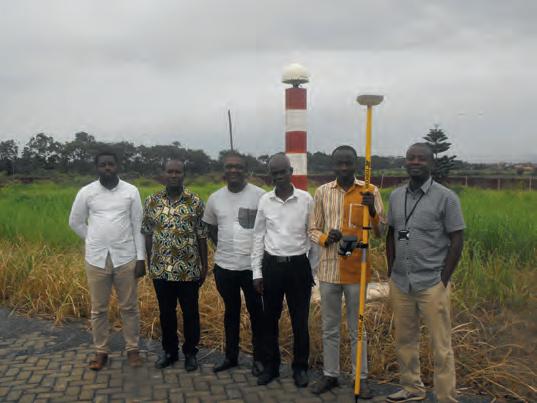
So far, Corsmap has been able to crowdsource data for 180 CORS installations in 25 countries including South Africa, Angola, Mozambique, Rwanda, Uganda, Kenya, Ghana, Nigeria, Benin, Burkina Faso and more. However, contacts have only been made with custodians in four of these countries, namely South Africa, Ghana, Mozambique and Uganda. This means that the information from the other 21 countries has been sourced by the Corsmap founders themselves from other online maps and RINEX repositories, but the information has not been verified and controlled by the people on the ground. The Corsmap team is keen to encourage all African countries to provide the missing or unverified CORS information to help them update the map for the public good. Many countries such as Botswana, Namibia, Egypt, Tunisia, Algeria, Ethiopia and Ivory Coast remain unmapped. In some cases the language barrier poses a problem, although most of the time the lack of response from contacts seems to be the biggest challenge.
ABouT The AuThors
derrick Koome holds a Bsc in geospatial engineering from the university of nairobi, Kenya. He is a private practitioner based in nairobi and has worked in the private sector for close to five years. He is the author of many geospatial articles on linkedin, some of which have been republished in leading magazines. derrick@corsmap.com
clement ogaja has a PhD in geomatics engineering from unsW, sydney, australia. He holds a Bsc (First Class) in surveying from the university of nairobi and has variously worked as a gnss specialist, professor, researcher and geodesist in the usa, australia and Kenya. He is the author of several articles and two books. clement@corsmap.com
eldar Rubinov received a PhD in gnss from the university of Melbourne, australia. He has held various positions as a hydrographic surveyor, researcher and gnss entrepreneur. He is currently working as a technical manager on the australian and new Zealand sBas testbed. eldar@corsmap.com
FaiR shaRe oF lemons
Populating Corsmap has not been an easy task. The founders have faced a lot of challenges: many e-mails have gone unanswered, many calls not taken, many LinkedIn requests ignored, but the few positive responses have been worth every effort by the Corsmap team. It has been a stark reminder that good things come with their fair share of lemons. Despite the lemons which have been used to make lemonade, there have been some amusing moments as well, such as one user who claimed to have base station information for a particular country, only for him to provide the team with a link to their own Corsmap website. This particular incident was not only comical, but also reaffirmed the dearth of CORS base station installations in Africa.
Uploading the base station data
Since the base station data as currently constituted has been obtained by the founders themselves, there is an undisputed need for maintenance and keeping the information current and relevant. Corsmap therefore depends on a network of trustworthy and reliable people to critique the information already provided. Data integrity is

key. It is better to provide limited yet accurate base station information than to have a flood of information that is not factual and truthful. Looking ahead, it is the Corsmap team’s dream to have such a network of dependable people uploading the base station data themselves. This will be a true reflection of international cooperation between geospatial professionals. Interestingly, perhaps, the Corsmap founders have created the online map without actually ever having met face to face. Clement is based in California (USA), Eldar in Australia and Derrick in Kenya. Their conversation started on LinkedIn, and the online map is the product of extensive e-mail correspondence and Skype meetings, mostly at odd hours of the day.
pRecision agRicUltURe
Permanent GNSS stations can open up a world of opportunities in many sectors. Since African economies are mainly agriculturally based, the mass adoption of precision agriculture would increase the output tremendously. Machine control is another industry waiting to be unravelled in Africa. These industries are reliant on CORS installations providing GNSS observables to their machines. Most surveyors in Africa use base and rover setups when doing their RTK surveys. This means the initial cost of equipment is high should a surveyor think of becoming an independent contractor. If more of these CORS installations were known and, in the case of a lack of CORS, could be speedily installed, the initial cost of acquiring geodetic GPS would be halved.
datUm Realisation
Last but not least, datum realisation is of paramount importance and CORS networks help to provide that. Each country in Africa needs to have at least one high order station providing data continuously to the African Geodetic Reference Frame (AFREF) in order to have a unified reference frame for the continent. This has been a continuous challenge since the beginning of the AFREF project and one where Corsmap can potentially help in identifying the gaps. As the Corsmap team continue to map permanent GNSS stations in Africa, their eyes are set on building a central database of CORS stations for the global community: a database that is people centred since crowdsourcing is a permanent cog in its wheel. It is a journey that has begun and will hopefully have a happy ending. If you would like to be part of the narrative, join the Corsmap community forum.

furTher reAdinG
www.corsmap.com

