49 minute read
Headlines
Looking Ahead to Intergeo 2022: How 3D Models Make the World Smarter
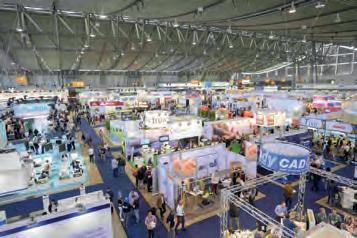
Intergeo 2022 will have a strong focus on digital twins and will zoom in on 3D city models, BIM in surveying and digital urban planning. Additionally, the world’s most prominent gathering for the geospatial community will once again integrate Interaerial Solutions, Europe’s leading trade fair for commercial drones. Intergeo 2022 will take place from 18-20 October in Essen, Germany. From urban quarters to entire construction projects and from transport to climate protection measures: digital twins visualize planning, maintenance and future scenarios interactively and realistically in a 3D model. At the same time, the 3D image is linked to real parameters such as environment, time and condition. Many of the companies registered to be present at Intergeo 2022 are already implementing reality capture – in real time with lasers, scanners, point clouds and sensors, whether by air, on the ground or by water. They are supported by technologies and devices that are intuitive, mobile, rugged and convenient. Similar to a backpack, you can simply carry them around, take them in your hand, attach them to a car, a UAV or tripod and off you go. Everything that is captured is based on geodata and geoinformation and is contextualized: Where is this and what is around it? This provides a 3D model as an integration basis that can be supplemented with further information from different systems, such as real-time data, sensor data, work orders or asset management data. Thus, the world becomes smarter.
Intergeo exhibition floor.
ComNav Technology Upgrades GNSS Receivers
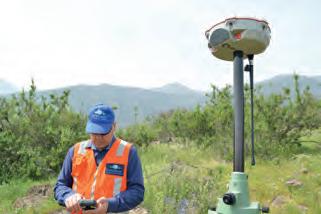
ComNav Technology has announced a global upgrade of the T300 and T300 Plus GNSS receiver, including the upgrade to the new GNSS K8 platform on both receivers and the replacement of the tilt sensor to IMU module on the T300 Plus. The upgraded T300 and T300 Plus optimize the performance in various aspects. The full-constellation tracking ability on the K8 platform makes it possible to receive all the current and future GNSS signals, including GPS, BDS, GLONASS, Galileo, QZSS, Navic and SBAS. Compared with previous ones, signal support and tracking is for QZSS L1/L2/L5, Navic L5, Galileo E6 and Altboc. GLONASS L3 is also available. After the upgrade, T300 and T300 Plus have 965 GNSS channels. This introduces robust GNSS tracking performance for users. The advanced GNSS real-time kinematic (RTK) technology on the K8 platform provides continuous centimetre-level positioning within a short period of time. Moreover, to alleviate the influence on the authentic satellite signals, the K8 platform also enhances interference detection and mitigation. The interference, for example, between buildings or in the dense jungle will no longer affect the positioning results. With the technologies mentioned above, the users can expand the reach of their GNSS rovers and obtain reliable positioning results, even in complex environments.
A land surveyor from GEOGlobalty – based in Santiago, Chile – with a ComNav T300 GNSS receiver. (Image courtesy: GEOGlobalty)
Land Info Completes 10m Countrywide Mapping Dataset of USA
Land Info Worldwide Mapping recently completed up-to-date 10m-resolution thematic raster GIS data covering all 50 US states. Optimized for low-band (broadarea coverage) 5G wireless planning, the dataset supports additional applications including utilities, insurance and government, and complements Land Info’s 1m-resolution datasets that are used for mid-band and high-band 5G in more densely populated areas. Land Info Worldwide Mapping is a leading provider of mapping solutions for 5G wireless in North America. “The dataset is unique in that, in addition to using 2020-2021 Sentinel imagery and numerous ancillary layers, we were able to create best-in-class mapping by incorporating aerial-derived digital surface model (DSM) elevation data into our processing via our long-standing partnership with Hexagon’s HxGN Content Programme,” says Land Info President Nick Hubing. The HxGN Content Programme offers highresolution, countrywide aerial imagery and elevation data of the contiguous United States and Western European countries. Hexagon continuously advances the programme with higherresolution products for digital twin initiatives.
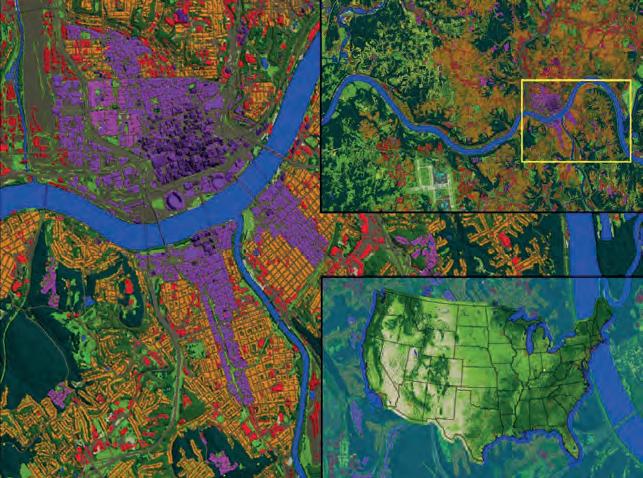
10m clutter (land-use/cover) mapping recently completed by Land Info for the entire USA; inset shows Cincinnati, Ohio.
Applanix Introduces Next-generation OEM Solution for Mobile Mapping
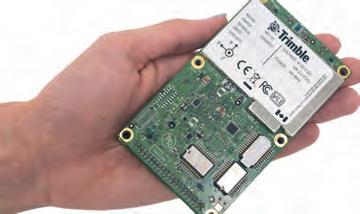
Applanix, a Trimble company, has announced the Trimble AP+ Land GNSS-inertial OEM solution for accurate and robust position and orientation for georeferencing sensors and positioning vehicles in land mobile mapping applications. The solution enables users to accurately and effi ciently track and monitor fl eets, produce high-defi nition (HD) maps and 3D models, or act as a reference solution for advanced driver-assistance systems (ADAS) testing, even in the most challenging of GNSS environments. The Trimble AP+ Land is a comprehensive tool for land vehicle applications that is small enough to easily integrate into the most compact mobile mapping systems. It is also compatible with virtually any type of mapping sensor, including single or multi-Lidar systems, video cameras, photogrammetric and panoramic cameras and other similar sensors. Confi gurable to meet the mapping, positioning and direct georeferencing (DG) accuracy demands of mapping and positioning applications in challenging GNSS signal environments, the Trimble AP+ Land solution features, amongst others: Applanix IN-Fusion+ GNSS-aided inertial fi rmware with Trimble ProPoint GNSS positioning technology, dual embedded survey-grade GNSS chipsets that can receive multi-frequency and multi-constellation signals and dual custom-designed IMUs.
Trimble AP+ Land GNSS-inertial OEM solution.
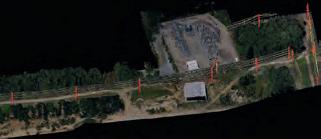
SimActive has announced the use of its Correlator3D product by Survtech Solutions for use in energy infrastructure mapping and monitoring. Using aerial imagery to colourize Lidar point clouds, a visual element is added to enhance the processing and development of mapping products. Spread across the US, SurvTech’s projects often cover long corridors where power lines either already exist or are in development. Data acquisition is performed with both manned and unmanned aircraft, depending on the total length of the project and the resolution requested by the customer. Lidar and imagery are imported into Correlator3D, which is used for orthorectifi cation and colourization.
Survtech Solutions uses Lidar imagery for energy infrastructure mapping and monitoring.
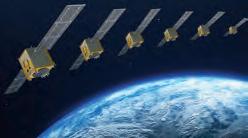
Galileo Second-generation Satellites Ready to Navigate into the Future
Airbus has successfully completed the Preliminary Design Review (PDR) for its system concept for the secondgeneration Galileo navigation satellites. During this important milestone, Airbus’ proposed preliminary design and the customer’s system requirements have been fully reviewed and agreed. This paves the way for further verifi cation, acceptance and qualifi cation at equipment and module level. Verifi cation at payload level is already in full swing, with the Critical Design Review (CDR) for the satellite structure also due shortly. In parallel, the Airbus site in Friedrichshafen, Germany, is preparing for an industrialized production line for currently six secondgeneration Galileo satellites. The satellite integration centre is being completely upgraded to meet current and future requirements for effi cient, environmentally friendly, safe and secure production for the Galileo second-generation satellites. This is a key milestone in European satellite navigation services that European citizens and billions of users around the world will benefi t from, powered by Airbus know-how brought to the project by over 200 highly skilled space engineers. The fi rst Galileo second-generation satellites are planned to be launched in 2024.
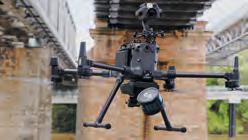
Emesent has launched the tough, lightweight, IP65-rated Hovermap ST includes Emesent’s new automated ground control feature. With this powerful combination, Emesent aims to set the standard for survey-grade autonomous Lidar mapping in challenging environments. Since 2019, Hovermap has made signifi cant impacts in mining and other verticals, earning a reputation for versatility, ease of use and mapping data quality. With thousands of hours of autonomous fl ight logged by customers around the world, it is a proven Lidar mapping and autonomy solution for challenging GPS-denied environments. Simultaneous localization and mapping (SLAM)-based systems have proved their value for rapid mapping of complex environments, but achieving survey-grade accuracy and repeatability has been a challenge in some environments. Surveyors were faced with a compromise between fast data capture and data accuracy, depending on the job requirements. This is no longer the case with Hovermap ST and the automated ground control feature, as the feature enhances the SLAM solution to remove SLAM drift and produce survey-grade, georeferenced point clouds.
Hovermap ST Lidar-equipped drone fl ying underneath a bridge.
YellowScan Expands Coverage to China with New Partnership
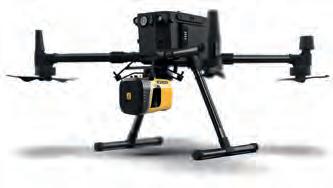
YellowScan has announced the addition of Beijingbased EcoTech to its global partner network. Specializing in spectral imaging technology, EcoTech is dedicated to the promotion, research and development of ecology- The YellowScan Mapper+ can be mounted on a wide agriculture health research range of UAV platforms due to its low weight. and monitoring technology. YellowScan is a French developer of high-end Lidar solutions. EcoTech is committed to the introduction and promotion of advanced instrument technologies and the contribution of its own R&D efforts in various sectors. The fi rst collaboration together will bundle YellowScan’s Mapper + Lidar solution with one of EcoTech’s own UAV platforms to offer the Chinese market the EcoTech Ecodrone Remote Sensing solution. “The perfect combination of YellowScan’s Lidar technology and Ecodrone UAV remote sensing technology brings us into a new 3D world and greatly helps us expand our research and applications in agriculture, forestry, ecological monitoring, geological exploration, surveying and mapping, and more,” commented Ning Wang, director of the EcoTech Spectral Imaging and UAV Remote Sensing Technology Research Center.
Nemetschek Invests in Reality Capture Solution for Construction Monitoring
The Nemetschek Group has led a fi nancing round for a platform to automate construction quality monitoring by combining advanced artifi cial intelligence (AI), reality capture and building information modelling (BIM) technologies. The next-generation platform has been developed by the Norwegian-based deep-tech company called Imerso. The Nemetschek Group is one of the leading software providers for the architecture, engineering, construction and operations (AEC/O) industry. The solution enables easy, everyday use of industry-grade 3D scanners on site. The scanners capture the as-built status throughout the construction phase with point clouds. Imerso’s cloud-based platform automatically analyses the captured 3D scan data against the plan in BIM. Combining AI and advanced computer vision, it highlights and lists in real time any relevant work deviations or issues, so these can be resolved effi ciently through re-planning or fi xes on site.
Imerso’s smart construction monitoring platform enables true-to-life digital twins.









Towards an Ecosystem of Underground Utilities Mapping in Singapore
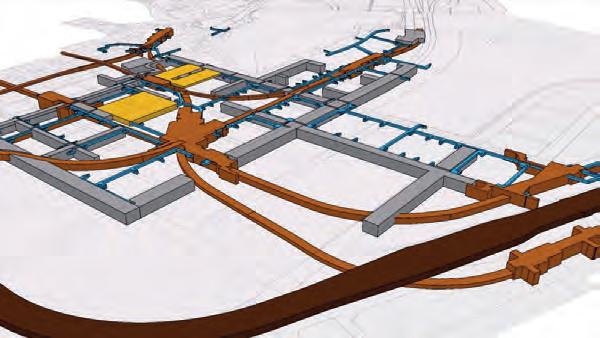
A new booklet provides details of the activities undertaken in the second phase of Singapore’s ‘Digital Underground’ project. The project is aimed at establishing an accurate, current and complete map of subsurface utilities in the sovereign island city-state. The project began in 2017 as a collaboration between the Singapore-ETH Centre (SEC) and the Singapore Land Authority (SLA). In its first phase, it planned and established what was needed for a roadmap to develop a coherent national mapping strategy for underground utilities. From 2019, it commenced its second phase, translating the roadmap into a reality, and supporting an ecosystem to produce and deliver accurate and complete digital data to stakeholders. This new booklet charts the results that emerged, and the ambitions and achievements of various stakeholders and supporters that are an integral part of this developing ecosystem. It makes the case for a national subsurface digital twin, which can integrate information and data on subsurface developments, and mirror those above ground. From proposing a new subsurface utilities data governance framework to facilitating knowledge sharing by establishing a community of practice, it details the rationale and effort in coming up with recommendations and the development of an ecosystem for mapping below the ground.
Marina Bay 3D Special and Detailed Control Plan. (Image courtesy: Urban Redevelopment Authority, Singapore)
NavVis and HERE Combine Efforts on Future of Mobility
NavVis and HERE Technologies have decided to join forces to bring high-definition indoor mapping and visual positioning to parking garage operators and transportation hubs. NavVis is known for its innovative mobile mapping and reality capture solutions, while HERE Technologies is one of the world’s leading location data and services platforms. This partnership leverages three key technologies from NavVis: NavVis mobile mapping systems, NavVis IVION and NavVis visual positioning technology. NavVis mobile mapping systems are deployed to generate high-definition point cloud data, while also capturing 360-degree panoramic images. The NavVis mobile mapping devices, such as NavVis VLX, use simultaneous localization and mapping (SLAM) and Lidar to produce this data at unprecedented speed without compromising quality. Once the data is captured, NavVis IVION is used to post-process this data and then as a visualization tool to help convert point cloud data into usable maps and 3D views. Based on this data, HERE creates HD indoor maps that include essential attributes like ramp angle, clearance height and curve radii for specific use cases such as automated valet parking. Finally, the revolutionary NavVis visual positioning technology is deployed to enable positioning and route-finding capabilities in HERE’s indoor maps. Visual positioning is the determination of a position (location and heading) using inputs such as images from a smartphone camera. It is key for deploying AR solutions at scale without any additional infrastructure such as Bluetooth beacons, Wi-Fi or QR codes. NavVis’s highdefinition point cloud data and its visual positioning technology extend HERE’s outdoor and indoor mapping portfolio and truly allows for seamless end-to-end guidance.
The point cloud data behind HERE’s indoor maps is delivered via NavVis IVION software.

Phase One has announced the iXM-GS120 aerial camera built to meet the demanding needs of national security and geointelligence-gathering projects. Designed for use on unmanned aerial vehicles (UAVs or ‘drones’), fixed-wing aircraft and helicopters, the iXM-GS120 is a wide-area, 120MP-resolution camera designed around advanced global shutter sensor technology. “Phase One designed the iXM-GS120 for reliable, maintenancefree operation in lengthy missions in remote areas, which often typify national security and intelligence gathering activities,” said Dov Kalinski, Phase One vice president of security & space. “For traditional inspection and mapping applications, geospatial users will find the new camera captures massive volumes of high-quality imagery efficiently and costeffectively.” The iXM-GS120 underscores Phase One’s commitment to pioneering development of reliable and innovative aerial imaging solutions. The single-sensor design combined with 120MP resolution guarantees fast collection of detailed information over a wide area of interest in every frame, reducing flight times and enhancing effectiveness. With regards to processing, this design also eliminates the timeconsuming stitching together of image scenes from multi-sensor camera systems.
Wide-area coverage with the Phase One iXM-GS120 aerial camera
EXAMINING THE DEVELOPMENTS IN CONSTELLATIONS, AUGMENTATION AND RECEIVERS
The Incremental Improvements in GNSS
It is almost impossible to imagine geoinformation without GNSS nowadays. Even most geodetic services have switched to GNSS to maintain the geodetic reference network rather than using traditional optical techniques. This article explores the state of the art in GNSS, from both a constellation, augmentation and receiver perspective. Spoiler alert: it is more of an evolution than a revolution!
Global satellite navigation systems (GNSS) are everywhere. If you try to imagine geoinformation without GNSS, you will probably fail. Some people might say: ‘But what about my total station?’. But perhaps they are forgetting that most geodetic services have long since stopped surveying the control points using traditional, optical techniques and have switched to GNSS to maintain the geodetic reference network instead. So what is the current state of play when it comes to GNSS?
GNSS CONSTELLATIONS
The number of GNSS constellations has not changed over the past few years. Listed in the order in which they first became fully operational in their current configuration, they are: the USA’s GPS, Russia’s Glonass, China’s Beidou and Europe’s Galileo. Actually, Galileo should not be included if this is a list of fully operational systems, since – at the time of writing – only 21 of the planned 27 plus 3 satellites were fully usable, with another two in the commissioning phase. Hopefully, Galileo will also reach its full operational status at some point in 2022.
Besides these four global navigation satellite systems, there are two regional systems. The Japanese QZSS is probably the bestknown one; with both geostationary and quasi-zenithal geosynchronous satellites, the system provides coverage of Japan. Another three satellites are planned for QZSS in 2023, bringing the constellation to seven satellites which will provide positioning over Japan (and Australia). The second regional system is NavIC (or IRNSS, as it was known until 2016), which orbits over India. Again with both geostationary and geosynchronous satellites, this system covers India and the Indian Ocean. As both QZSS and NavIC are purely regional, they cannot be used outside their particular region. This is in stark contrast to the ‘true’ GNSS, although Beidou is actually both regional and global; the system employs geostationary and geosynchronous satellites over China, as well as satellites that orbit the world in a medium Earth orbit like the other three GNSS. The advantage of this is greatly improved coverage over China (and Australia). As a result, the people with the best GNSS coverage in the world are probably the Australians, with a total of five available systems. India can also use five systems for navigation, although it is closer to the edge of Beidou’s coverage.
Figure 1: Beidou ground tracks. (Image courtesy: mdpi.com)

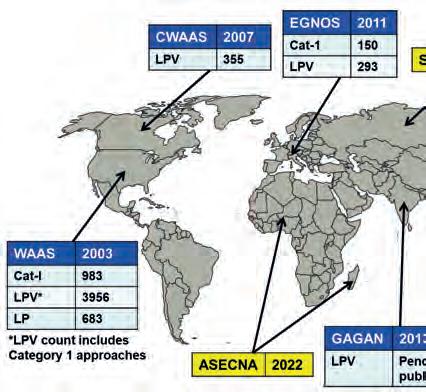
Figure 2: Various SBAS systems. (Image courtesy: africanews.space)
In terms of development within the various systems, the signal structure has remained the same for most systems and improvements have mainly been made in the control and positioning of the satellites themselves. Although relatively small improvements, they do have a sizable impact because a more accurately positioned satellite translates into better on-the-ground accuracy. The only system itself that has been improved is Glonass. Starting in 2018, a series of satellites were launched with the new L3OC signal. This CDMA signal is easier to implement than the so-called ‘standard’ FDMA signals because the CDMA signal uses similar techniques to those in the other GNSS. However, it has now been well over a year since the last launch (in 2020) and – especially considering the current confl ict situation – the current plans for Glonass are unclear.
GNSS AUGMENTATION
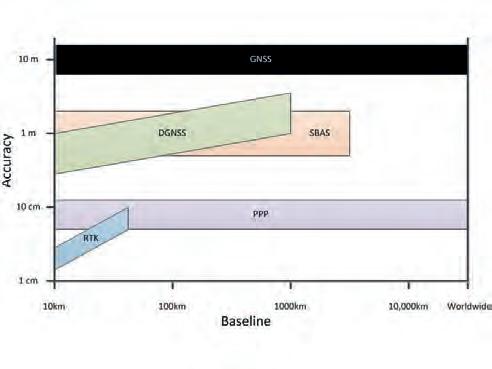
and compare the signals actually received with those expected. Based on a number of these measurements, a set of corrections for the augmentation area are developed and transmitted to a geostationary satellite, from where they are sent back to the receivers in the GNSS frequency bands. These satellites are often recognizable in the sky plot by the ‘high’ satellite numbers they display. Due to the rather large areas covered by SBAS, the resulting accuracy is reasonable but not extremely high. When a high horizontal and vertical accuracy is required in land survey, real-time kinematic or RTK augmentation systems are used. Depending on the set-up, surveyors can use their own base station with UHF corrections, for example, or make use of an existing network. If an existing network is used, they can use corrections from a single base – but often, they use a virtual reference station whereby the network ‘computes’ a set of corrections as if the base station were Whether for surveying and other professional located at or near the survey area. When using geoinformation work or on smartphones or one’s own base station and post-processing in vehicles, and whether in the USA, Europe or Asia, it is rarely the ‘raw’ GNSS signal that is used, but rather an improved, augmented signal. This is thanks to a number of ‘free’ (i.e. government-sponsored) space-based augmentation systems (SBAS): WAAS in the USA, MSAS in Japan, Egnos in Europe and Gagan in India. Other systems are at varying stages of development or certifi cation, including SDCM (Russia), KASS (Korea), BDSBAS (China), SouthPAN (Australia), SACCSA (South/Central America and the Caribbean) and A-SBAS (Equatorial Africa). Each of these systems essentially functions in the same way. Control (‘base’) stations on the ground receive the satellite positioning signals Figure 3: Trimble R12i with tilt sensor. the results (rather than using them in real time), it can even be possible to achieve sub-centimetre accuracies. The disadvantage of RTK is that the range is limited to around 15km from a (virtual) base station. Therefore, the use of RTK can be problematic, especially in remote areas with a limited geodetic or communication infrastructure. Precise point positioning (PPP) lies somewhere in between these two technologies. Although it is not as accurate as RTK, the advantage of PPP is that it works over large areas without having to install one’s own base station. In PPP, data from ground-based stations is used to model the local errors in the GNSS observations (rather than transmitting corrections). Using an iterative process of predicting the model errors and comparing them to the real results, the receiver iterates stand-alone positioning to a high accuracy. A data link is still required in order to receive the model data, but this method is not limited by a range of just a few kilometres or the need to have local reference points. The latest commercial services using all available GNSS coverage are now achieving sub-decimetre results in terms of both horizontal and vertical precision.
The Galileo High Accuracy Service is based on the same principle, but with a horizontal accuracy of around 20cm and a vertical accuracy of around 40cm. The service is expected to become initially operational somewhere in 2022, and to become fully operational from 2024 onwards. For single points, results similar to the commercial PPP systems can often be obtained (but without guarantees) by various freely available post-processing services such as Auspos CSRS-PPP and Trimble CenterPoint RTX PostProcessing. Depending on the service, it may even be possible to post-process kinematic data rather than just static data.
Figure 4: Various augmentation techniques: range and accuracy.
GNSS RECEIVERS
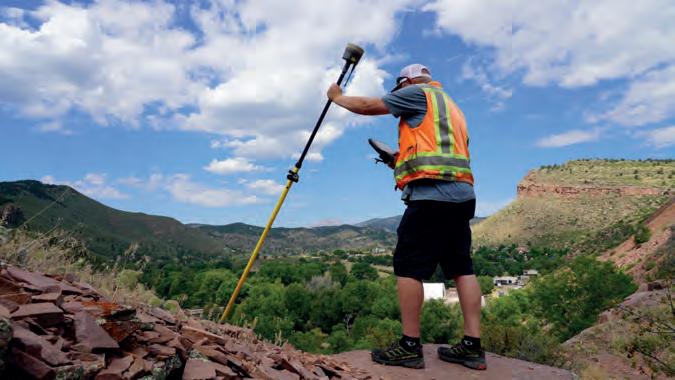
Just as with all hardware, the GNSS receiver is continuously being further developed. However, based on recent specifications, it is apparent that the development is more of an evolution than a revolution. Perhaps the greatest change to the GNSS receiver has been the addition of an IMU, allowing the user to hold the pole ‘at an angle’ while measuring. Although this introduces an additional error from the IMU, it allows the user to conduct surveys in difficult-to-reach places. Moreover, if the utmost accuracy is not required, surveys can be completed much faster too since the user no longer needs to wait for the bubble to centre before taking a measurement. Depending on the brand and model of the receiver, the achievable angles are anywhere between 15° and 60° of tilt. Needless to say, the second major development is that the units are becoming ever-smaller for use on unmanned aerial vehicles (UAVs or ‘drones’). Whereas post-processed kinematic on a drone would have been regarded as a benefit a few years ago, nowadays multi-frequency RTK systems are starting to become the standard for high-end systems. This trend is enabling surveyors to obtain much better models without requiring as many ground control points to tie the photographs into the geodetic network.
CONCLUSION
As outlined above, there have been incremental changes in GNSS positioning over the last few years. With ever-growing GNSS constellations, further developments in augmentation systems and upgrades to receivers, things seem set to continue to improve in the (near) future.
ABOUT THE AUTHOR
Huibert-Jan Lekkerkerk is a contributing editor, freelance hydrographic consultant and author of other publications on GNSS, hydrography and principal lecturer in hydrography at Skilltrade (Cat B) and the MIWB (Cat A).

USING LARGE-SCALE, HIGH-RESOLUTION LIDAR TO SUPPORT POLICYMAKERS
Building a Digital Twin for Germany
The German Federal Agency for Cartography and Geodesy (BKG) is creating a digital twin of Germany that can be used to simulate various future scenarios in order to adequately address societal challenges, such as the increasing use of land, rising energy demands and extreme weather. This digital replica of Germany will be built as an intelligent 3D world containing all the essential geospatial objects, enabling the relevant processes to be mapped holistically and in relation to each other based on a common data foundation. This is intended to support faster, more informed and more reliable decision-making.
Digital twins have long been a reliable tool in industrial production to mirror processes in their entirety. All relevant aspects, functions and properties of an object or manufacturing process are considered in the modelling to allow for the simulation or monitoring of alternatives as the basis for faster, more informed and more reliable decision-making. Transferring this concept to a wider geographical scope, such as an entire country, poses challenges ranging from technological scaling and modelling to information management and data integration. However, recent advancements in information technology – such as increased processing capabilities through cloud computing and artificial intelligence, as well as improved surveying techniques and methodologies that allow accurate, large-scale Lidar capture – now put the prospect of a nationwide digital twin within reach and offer tremendous untapped potential.
INFORMATION, INSIGHTS, IMPACT
Increased land consumption, the growing demand for energy, limited natural resources, sociodemographic changes and extreme weather events are just some of the challenges that current and future governments face. The causes and effects of these issues often are interwoven. Datadriven methods are needed to address them effectively. A holistic, cross-domain approach offers a chance to account for the correlations between them and to provide additional insight. As such, a spatially explicit and comprehensive common foundation of data is integral to an increasing number of decisions within government administrations. Often, the solutions to these problems are not binary but rather contain a spectrum of alternatives and mitigation measures. To compare the impact of different policy decisions, a common data basis and framework are paramount – and that is precisely what the Digital Twin Germany platform is intended to provide.
WHY LIDAR MATTERS
What potential does this data hold? Accurate topographic information is already being used for countless scientific projects, feasibility studies, planning assessments and more. When it comes to geodata, the sky is the limit. Current projects range from hydrologically sound models to simulate flash flooding due to heavy rainfall, to urban climate analysis which requires information about the height of buildings in order to model air flows. Largescale Lidar, like single photon or Geiger-mode Lidar, is an accurate data collection method to derive canopy height and tree density in a forest, for example. The data can then be used in biogeochemical models to estimate carbon capture. Lidar data can also elevate existing applications such as remote sensing data. The Digital Twin Germany platform entails the collection of data for the entire country consistently and in unprecedented detail, so that interconnected problems become more visible and easier to target for stakeholders within governments and other interest groups. Improved data resolution and height accuracy will also further enhance existing solutions and open up new possibilities.
MAKING SENSE OF 3D DATA
A high-precision 3D model captured using modern, airborne laser scanning technology forms the foundation of Digital Twin Germany. To capture an area as large as Germany in a timely manner, conventional Lidar methods are not sufficient. Instead, state-of-the-art capturing techniques are required such as Geiger-mode Lidar (GmL) or single photon Lidar (SPL). These systems offer a balance of large-scale area coverage while maintaining the high resolution necessary for quick and efficient surveying of topology features across the entire country. Like conventional or linear Lidar, both these methods rely on the timeof-flight measurement method: the travel time difference between the emitted laser impulse and the detection impact of the reflected echo.
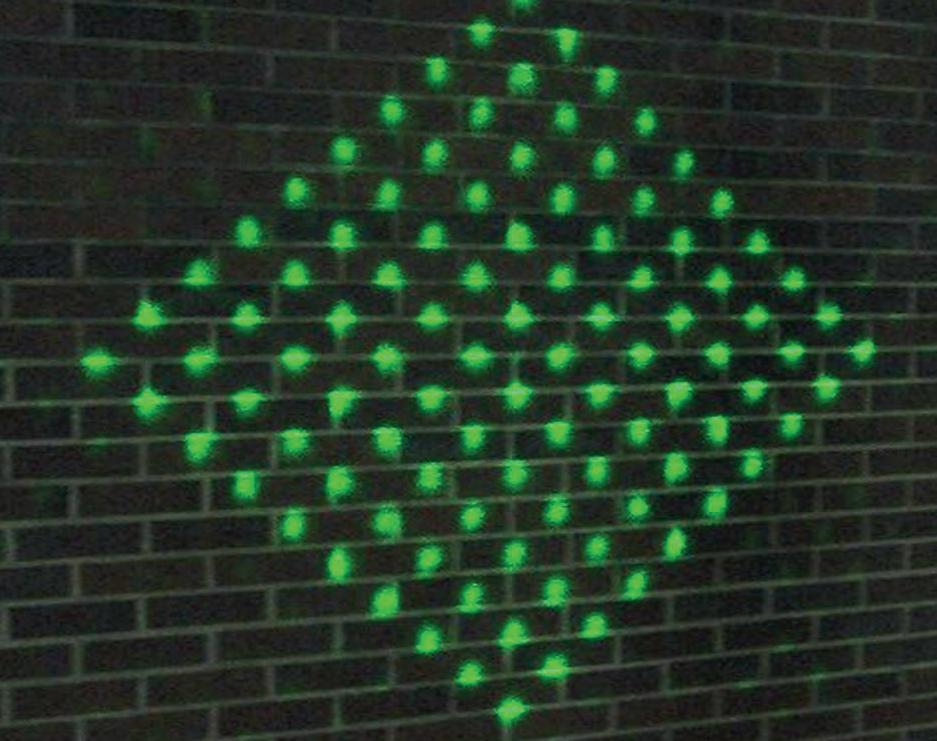
Both techniques enable the capturing of objects in their entirety and with a high point density. However, the two methods differ in wavelengths used; SPL uses wavelengths on the green spectrum. This laser is split into a 10x10 array of beamlets using a diffractive optical element (see Figure 2).
To achieve a height accuracy of better than 10cm, the point density for Digital Twin Germany is proposed at 40ppm² (see Figure 3). This resolution enables objects to be detected reliably and the creation of a realistic mirror image that can even include bushes beneath tree crowns. The entire area is going to be recaptured every three years. This supports not only accurate and consistent measurement and simulation, but also change analysis. The accuracy and scale of the digital twin are currently unmatched in Germany. The quality of the data is being further enhanced by adding satellite and real-time data, facilitated by artificial intelligence (AI). The use of AI enables objects to be detected and classified automatically from the raw data and subsequently made available for analysis.
EXPERT DATA MAKES THE DIFFERENCE
The second step is to enrich the basic dataset with a wide variety of expert information layers, including information on climate, infrastructure, agriculture, traffic and satellite images, for example. This additional information is superimposed on the virtual 3D world. Together with other cutting-edge digital technologies and methods, such as the Internet of Things (IoT), AI, cloud computing, big data analytics Figure 2: In SPL, the laser is split into a 10x10 array of beamlets.
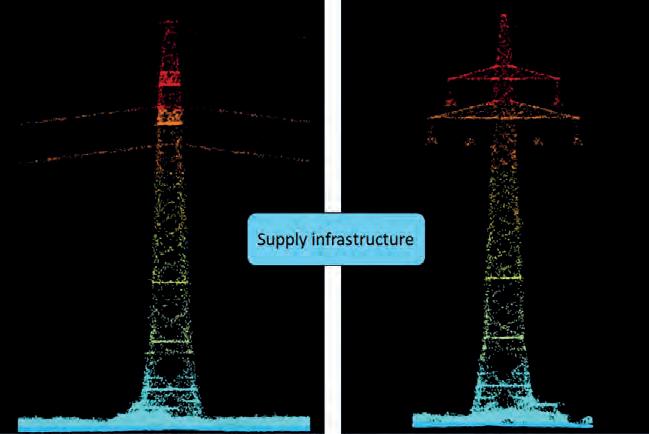
Figure 3: A point cloud of a power mast illustrating the level of detail for Digital Twin Germany. Blue points indicate low elevation, red points high elevation.
and modern visualization techniques, more and more opportunities are opening up in the geoinformation sector. The result will be a highly complex, consistent and dynamic model of Germany comprising as much data as possible from the federal administration. Since BKG is the key geodata provider for the federal government’s spatial data infrastructure, it has a large amount of national geodata at its disposal. All this data will be the starting point for building Germany’s digital twin. To ensure that all users are provided with comparable and interoperable data, data will be collected consistently across the entire federal territory and will be updated regularly.
SURVEYING THE CITY OF HAMBURG
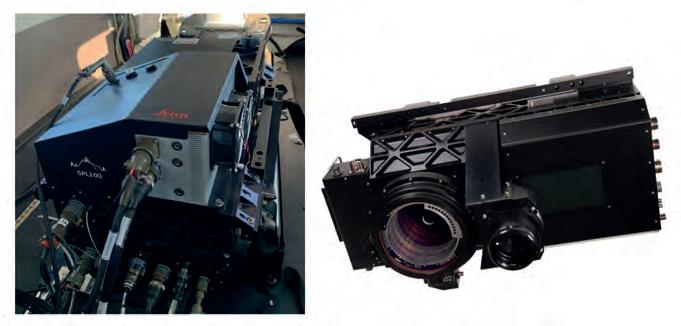
A pilot project is currently underway at BKG to test the feasibility of this vision. In a joint project with the State Office for Geoinformation and Surveying of the Free and Hanseatic City of Hamburg and the Hamburg Metropolitan area, implementations are being tested, data validated and technologies and methods explored. For this, an extensive area of the Hamburg metropolitan region has been surveyed by Hexagon using a Leica SPL100. The aim is to gain experience in the handling of the data and learn about all aspects of the digital twin process, from data capturing to data management and analysis. The pilot project is scheduled to end in spring 2022.
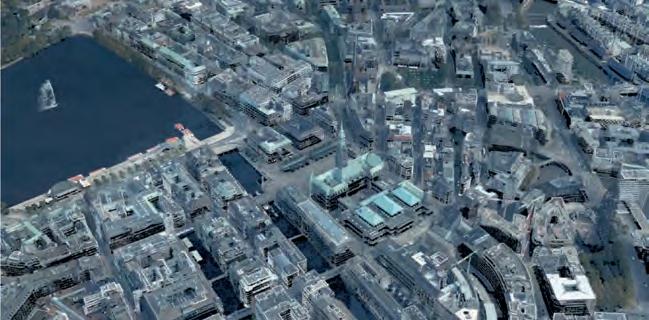
Figure 4: Oblique view of the coloured point cloud from the test area of Hamburg, showing city hall in the centre.
The lessons learned are to be adapted for the main project itself, which aims to capture federal Germany in its entirety and is due to start in 2023.
NOT JUST A TECHNICAL SOLUTION
As mentioned above, Digital Twin Germany goes far beyond the structure of a 3D model. In addition, the aim is to develop and establish communication channels and networks of stakeholders at federal and state level. In general, it should enable policymakers and decision-makers to monitor specific conditions and test scenarios. Predictions can be made about how a system will react to changes and modifications. This creates new decision-making tools with which publicsector employees can optimally manage their tasks. For example, one interesting application in the federal administration is a nationwide environmental monitoring system. Details about precision agriculture, water management, air pollution and climate change are of particular interest. There is also potential in relation to smart cities, since digital twins help city administrations to fulfil their tasks in a more environmentally, economically and socially compatible way. They can be used to visualize future plans and test solutions to the complex problems cities face. Other applications include spatial planning that takes climate change into account, monitoring and modelling of ecosystems, simulation of sea level rise in the North and Baltic Seas, forest condition monitoring, and traditional application areas of change analysis.
INTEROPERABILITY: INTERFACES TO OTHER DIGITAL TWINS
Digital Twin Germany is an essential component in Germany’s journey to become a smart country. The European Commission (EC) has realized the potential of digital twins and plans to create a digital replica of Earth within the next decade. The ‘Destination Earth’ initiative builds on the EC’s Green Deal and Digital Transformation programmes. On a more local level, several digital twin initiatives for cities and municipalities are also underway. BKG aims to position its endeavour in the gap between international and local initiatives. As such, interoperability of services and data and the sharing of knowledge, data and tools are considered crucial steps in realizing the full potential of not just one, but all of these projects.

CONCLUSION
At the forefront of applying the newest Lidar advances, BKG is playing a crucial role in supporting Germany on its path to become a smart country aimed at making better decisions faster.
ACKNOWLEDGEMENTS
BKG would like to thank Hexagon for the data acquisition in the pilot project as well as for providing photographs and figures for this publication.
ABOUT THE AUTHOR
Anja Hopfstock is head of the Geodata Department at the Federal Agency for Cartography and Geodesy (BKG). The Geodata Department manages the digital landscape models at scales 1:250,000 and 1:1,000,000 as well as several cartographic products. It further takes care of applied research and development and supports fundamental research in the field of geoinformation and remote sensing.
Michael Hovenbitzer is head of the Geoinformation and Remote Sensing Development Unit at the Federal Agency for Cartography and Geodesy (BKG). This unit develops and investigates ideas ranging from basic research to application development.
Florian Lindl joined the Federal Agency for Cartography and Geodesy (BKG) as a research associate in 2021. He holds a master’s degree in GIS and previously worked at the EU’s Joint Research Centre and the International Criminal Court. His research focuses on empowering policymakers to reach sound data-driven decisions.
Patrick Knöfel has been working as a scientist at the Geodata Department of the Federal Agency for Cartography and Geodesy (BKG) since 2017. His research interests lie in putting remote sensing techniques and data into practice for federal purposes. Before joining BKG, he did his doctorate at the University of Würzburg.
VRSCAN3D: A TERRESTRIAL LASER SCANNING SIMULATOR
Developing a Virtual Laser Scanner for Training and Research
The VRscan3D project has developed a virtual terrestrial laser scanner simulator as a training tool to support the learning of laser scanning processes. It is intended for use by universities and other groups that have limited or no access to actual terrestrial laser scanning equipment. This virtual solution also fits in well with the digitalization trend in teaching, which has been accelerated by the COVID-19 pandemic. The project has been funded by the German Academic Exchange Service (DAAD).
Digitalization is a worldwide trend that is affecting almost every industry. There are numerous signs of this in the geospatial industry, of course, but also in the teaching sector. The ongoing COVID-19 crisis has demonstrated that digitalization of teaching is not only an option, but also an indispensable necessity in the present reality. The pandemic has particularly affected those academic programmes where classroom teaching is unavoidable, such as in practical courses requiring the use of surveying equipment. The recent critical situation in education has therefore accelerated the transition to online teaching.
Besides this, academic institutions have a responsibility to educate their students in line with the current needs and demands of the professional market and industry, including how to use the latest technology and perform subsequent data processing. However, today’s laser scanners typically cost between €15,000 and €80,000 per device. This makes it difficult for some educational institutions, especially in less developed countries, to provide such devices for training purposes. In that context, virtual systems can offer a cost-effective, flexible and future-oriented solution.
VRSCAN3D CAPABILITIES
The VRscan3D project has been set up to develop a virtual laser scanner simulator and related training concepts to support universities and user groups that have limited or no access to actual terrestrial laser scanning (TLS) equipment. The main intended target groups for the VRscan3D simulator are students and teachers of in geomatics, heritage, construction and other related higher-education departments with limited access to expensive TLS equipment. The virtual tool allows the simulation of all processes in the TLS fieldwork phase and generates results comparable with the data generated by actual scanners on-site. These results can be further processed in common software packages, analogous to real surveying practices. Using the VRscan3D simulator developed so far, it is possible to create realistic environmental scenarios that largely meet the requirements of practical projects. Users can interactively move an avatar, define measuring stations and targets, select different scanner types with their respective specifications and use custom settings. During simulation, an angular grid of beams is projected from the centre of the scanner. The intersection of each beam with the closest surface gives the discrete point coordinates. These are enriched with noise and intensity values. The maximum range of surface search is limited to the scanner’s range specification. The simulation results in a structured 3D point cloud in different file formats for import into further processing software. For each scan station, a single point cloud is generated in the local scanner coordinate system. Moreover, 3D models/digital twins of real-world objects, such as buildings or sites, can be created and integrated into the simulator environment (Figure 1).

TECHNICAL DETAILS
VRscan3D has been developed within Unreal Engine, so the user’s computer must be compatible with its minimum requirements. The main simulator functions are programmed with Unreal Engine’s Blueprint Visual Scripting system. That makes the system very flexible and allows modifications of software modules without recompiling the whole code. Some modules were programmed in the C++ language due to Blueprint limitations and to improve the overall performance of the software. Virtual environment 3D models (in IFC format) are imported into Unreal Engine using a Datasmith plugin. The product functionality includes the following features: • selection of the scanner model which will be simulated • laser scanning process simulation to obtain point clouds with intensity and noise values
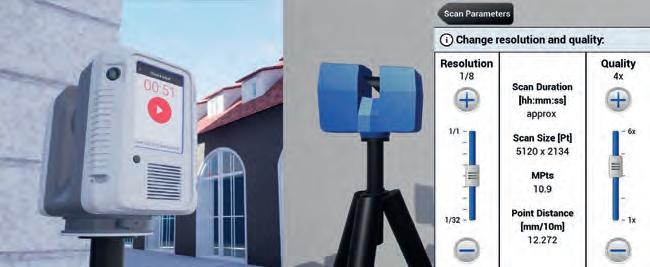
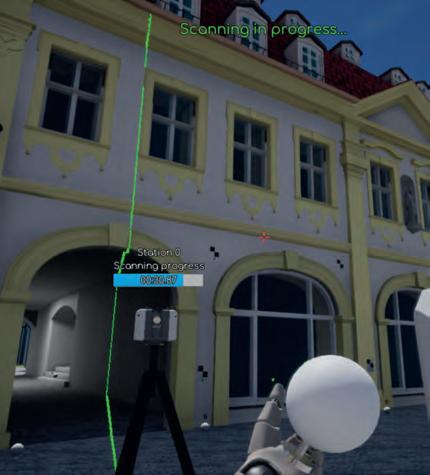
Figure 2: Examples of simulated TLS interfaces – Leica RTC360 interface (left); Faro X330 interface (right).
based on scanner specifications and object materials • scan station management, which allows users to specify settings (resolution) for each scan station and to create, move and delete stations • target management which allows placement and removal of different types of targets (checkerboard and spherical) • project management, which allows projects to be saved for continuation later • batch scanning, i.e. placing multiple scan stations at the same time and triggering scanning simulation for all stations one by one • real-time visualization of the scanning process and the generated point clouds • exporting the point cloud in standard file formats for post-processing • generation of spherical panorama images. Unlike real-life scanning, in which the speed depends mostly on physics, the speed of the simulation depends on several factors, namely: • computing power • openness of the environment • presence of surfaces that reflect or refract the laser beam • noise simulation. Computing power has a direct impact on the scanning speed; a faster CPU and GPU provide faster simulation. At the same time, the simulator does not require a large amount of memory, as simulated points are stored in the RAM for a short time and are then written directly to disk. Memory consumption is typically at 0.5-3GB, depending on the scan settings and environment. The simulation is also faster for open environments, as the number of calculations is significantly reduced when the laser beam does not hit a surface. The presence of reflective surfaces slows down the simulation speed, as this entails additional calculations of the reflected laser beam and intensity. Since the simulation of range and angular noise requires very simple calculations, its effect on scanning speed is less than 1%.
THE VIRTUAL SCANNING PROCESS
A basic generic scanner and three commercial scanner models have been implemented so far, and the list of implemented scanners will be continuously extended. The access to scanner settings is implemented through realistic interfaces of the selected scanner models (see Figure 2). The user can select
Figure 3: Example of an ongoing simulation, with the green line simulating the laser beam. The indicator above the scanner shows the remaining simulation/scan time.
scanning parameters and alter the instrument height (which is set to 1.60m by default). It is also possible to change the scanning position or remove a station.
The simulator offers two work scenarios: 1) The user is navigating within the virtual environment and selects and places target positions as in real life. Then the scanner position and scan settings are specified and the scanning process of the virtual device is started (Figure 3). The progress of point-cloud collection is visualized in real time by a projected scanner beam. When the scanning is finished, the user avatar ‘goes’ to the next station. 2) The user navigates within the virtual environment and selects positions for all targets
Figure 4: Example of a point cloud generated by the simulator, showing clearly distinguishable spherical and checkboard targets and also different intensity values. Since laser beam propagation through glass is also simulated, some points are visible inside the building, behind the window.
Figure 5: Simulation of noisy data from highly reflective material (chrome litter bin).
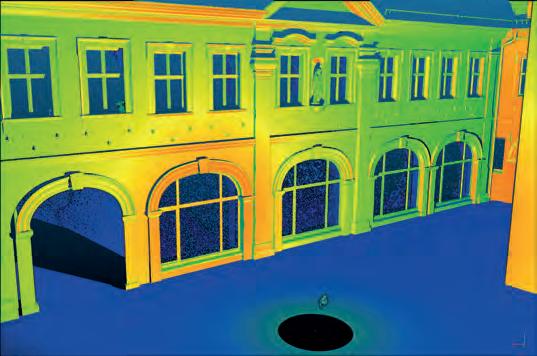
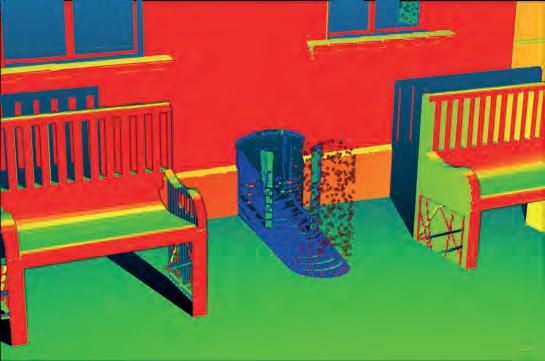
and all scan stations. Subsequently, scan settings are specified either for all stations or for each station separately. Lastly, the scanning simulation is started for all stations in batch mode. In the most recent version of the software, noise and intensity simulation has been implemented based on mathematical and physical models. Since simulated material properties are available (specified during modelling) for each part of the 3D scene model, noise and intensity are simulated as a function of material characteristics, scanner specifications and reflection properties. The most recent version of the software also simulates laser beam propagation and reflections from glass and other highly reflective surfaces (Figures 4 and 5).
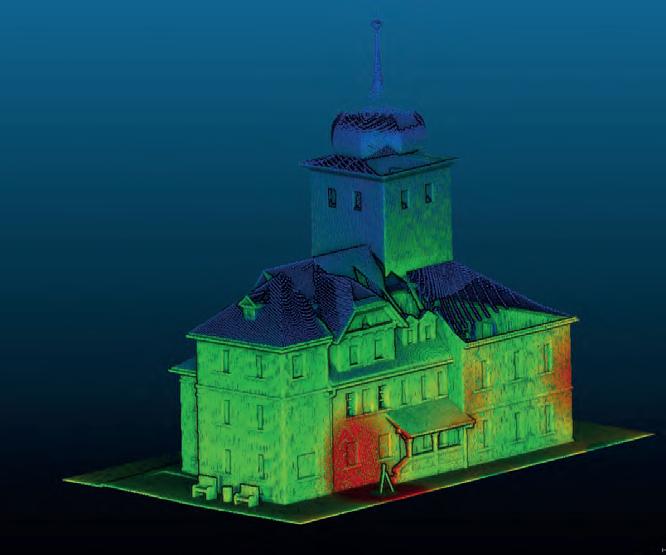
After occupying/simulating as many stations as needed to cover the virtual object, data is stored as a text file (txt or ptx) on a hard drive. E57 format will be available in the near future. The whole sequence of scanning can be simulated in a digital environment, thus generating realistic scanning data which can later be processed, registered and used in the entire data processing chain (Figure 6).
FURTHER READING
http://vrscan3d.com Chizhova, M., Popovas, D., Gorkovchuk, D., Gorkovchuk, J., Hess, M., Luhmann, T., 2020: Virtual terrestrial laser scanner simulator for digitalization of teaching environment: Concept and first results. Int. Arch. Photogramm. Remote Sens. Spatial Inf. Sci., XLIII-B52020. https://doi.org/10.5194/isprs-archives-XLIII-B5-2020-91-2020 Chizhova, M., Gorkovchuk, D., Kachkovskaya, T., Popovas, D., Gorkovchuk, J., Luhmann, T., Hess, M., 2021: Qualitative testing of an advanced terrestrial laser scanner simulator: users experience and feedback. Int. Arch. Photogramm. Remote Sens. Spatial Inf. Sci., 43, 29-35. https://doi.org/10.5194/isprs-archives-XLIII-B5-2021-29-2021 Popovas, D., Chizhova, M., Gorkovchuk, D., Gorkovchuk, J., Hess, M., Luhmann, T., 2021: Virtual terrestrial laser scanner simulator in digital twin environment. Proceedings of the joint international event 9th ARQUEOLÓGICA 2.0 & 3rd GEORES, Valencia (Spain). https://doi.org/10.4995/Arqueologica9.2021.12091
CONCLUSION
It can be concluded that VRscan3D: • offers a useful 3D laser scanning visualization that can be used in a hands-on explanation of how to use a TLS device • is easy to operate and offers all the performance of modern game environments • helps the user to learn basic terrestrial laser scanning parameters and interface usage, and is useful for planning individual workflows • allows the generation of simulated scan data comparable with real data, including noise, intensity, panoramic images and reflections • can replace real-life instruments for practical training if there is no access to actual equipment (e.g. due to costs) • is a useful tool for distance learning courses, e-learning and online teaching • can be used for research and development by creating ground truth scan data • offers new options for marketing scanner products. VRscan3D is available as a free demo version providing a generic scanner model and a limited number of scanning stations. A full version with different scanner models and unlimited functionality will be available in due time.
ABOUT THE AUTHORS
Prof Dr Thomas Luhmann has held a professorship in photogrammetry at the Jade University in Oldenburg (Germany) since 1993. He obtained his doctorate from Hanover University and a habilitation from TU Dresden. As principal author of the textbook Close-Range Photogrammetry and 3D Imaging and other globally recognized publications, he covers the whole field of photogrammetry, laser scanning and optical 3D metrology.
Dr Maria Chizhova is an assistant professor at the Centre for Heritage Conservation Studies and Technologies at Bamberg University. She obtained her doctorate from the Technical University of Munich in cooperation with the University of Applied Sciences Würzburg-Schweinfurt on the topic of model-based geometric 3D reconstruction of buildings from point clouds using statistical neighbourhoods. Her research and teaching are dedicated to the topics of laser scanning, (H)BIM and intelligent data interpretation.
Dr Denys Gorkovchuk is specialized in terrestrial laser scanning and photogrammetry. He is technical director of the company SPM3D and assistant professor at Kyiv National University of Construction and Architecture, where he obtained his doctorate in 2018.
TRANS-MEDIA STORYTELLING MADE POSSIBLE BY GEOMATICS
A Cross-border 4D Project Reinforcing a Shared History
The Terra Mosana project is reinforcing the shared history in the territory where Germany, Belgium and the Netherlands meet. Official country borders have changed over time, and geomatics can be used to show not only geographic relationships, but also cultural ones. Bringing the region’s countless stories to life in interactive 4D experiences helps people to understand how previous inhabitants moved around for work, marriage, faith and fun. Professor Roland Billen, a geomatics expert from the University of Liège, is coordinating the project.
The Terra Mosana project is a collaboration between 20 partners – municipalities, heritage sites, museums and universities – spanning three neighbouring countries: Germany, the Netherlands and Belgium. The goal is to increase tourism by providing on-site multi-media 3D models of the cultural heritage past and present, including the use of virtual reality (VR) and augmented reality (AR). Once they have experienced one site, visitors are expected to want to see all the digital narratives related to the shared history in the other five participating cities, within an hour’s drive of each other. This fourdimensional digital project, combining time with positioning, could even boost the sense of a common cultural background among the region’s four million inhabitants. Phase 1 has
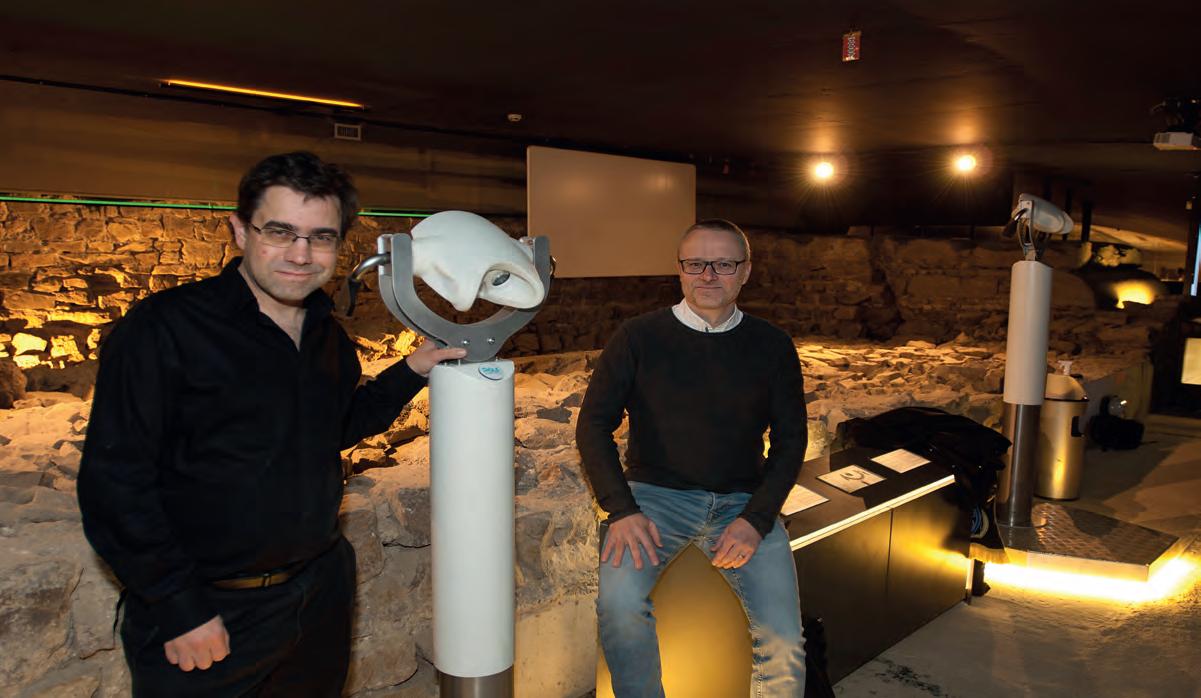
In Maastricht, a laser scan of the 18th-century 11km underground defence gallery has been transformed into a 3D experience. (Image courtesy: Municipality of Maastricht)
The River Meuse has always played an important role in the Terra Mosana region where Germany, Belgium and the Netherlands now meet. (Image editing: VBB)

just been completed at a cost of €4.2 million, 75% of which was funded by the EU under an Interreg arrangement. The funding discussion is currently underway regarding a possible follow-up later this year.
Coordinating 20 different institutes was a sizable challenge, according to Roland Billen, especially since many of them had limited IT knowledge, let alone an understanding of spatial IT. “Many partners now have new knowledge – about how to acquire data, how to best visualize it, how to store it and share it, intellectual property rights – that they can use in the upcoming digital evolution in the heritage sector. And we geomaticians learned a lot about history, the world of museums and archaeology. History offers context for the here and now,” comments Billen. He represents the Geomatics Faculty of the University of Liège (Belgium) and was techniques, so nothing new. The technical partners from the universities of Liège and Aachen had a clear view of the type of 3D data quality that could be produced. We helped historians and archaeologists to select the right techniques and write their specifications to get a good quality project. One important way we added value as geomatics professionals was by assisting the other partners, not only in visualizing but also in merging spatial data and models into the AR and VR applications.”
The images have been combined into videos and can be played on screens, tablets, smartphones and/or VR headsets at the sites. Visitors can see towns, cathedrals, landscapes and interiors change over time in the cities including Tongeren, Liège, Jülich and Aachen, plus a World War II conflict zone in Leopoldsburg and an 18th-century 11km
underground defence network in Maastricht. Sometimes a short movie featuring actors has been added, such as at the underground Archéoforum in Liège: the site of the remains of the enormous cathedral in the city centre. The cathedral was built on top of a house where the bishop who ruled over a large part of Terra Mosana territory was killed around 1,300 years ago. As visitors look at the actual ruins of his bedroom, they simultaneously see interactive VR images of the murder, and they can move around to explore the room ‘virtually’. “‘It wasn’t easy to get the geometrics right within the constraints – not only of the virtual room, the roof and the moving objects such as the deadly spear, but also to make sure that the actors behaved as if they were in that exact room. It all had to fit in the same 3D model. And especially because 3D modeling itself was new for most partners; they just saw it as a ‘video’!”
Some partners wanted to create an interactive app for smartphones that combined attractive visuals with a geometrically correct environment, but that presented several other challenges. For example, scanning of the inside of the cathedral in Aachen, where many emperors ruling the territory were crowned through the ages, resulted in a massive amount of points. The level of geometric detail had to be reduced without negatively impacting on the image quality for the users. Points were substituted by approximating polygons and then the images were projected into the polygons. The resulting mesh does not have extremely accurate positioning, but the images look realistic. On Apple devices, augmented reality is automatically added as visitors walk through the cathedral, following their position.
SPATIAL IT AND 3D MODELLING WAS COMPLETELY NEW FOR MOST PARTNERS
appointed lead partner of Terra Mosana: “13 cross-border storylines, mainly written by the historians, were selected and cropped with the help of civilians in participatory design workshops. Then the digitalization could start.”
INTEGRATING DIGITAL PRODUCTS
Besides the governance aspects, another challenge during Terra Mosana lay in integrating the digital elements into 3D models. The geodata acquisition itself was no problem, recalls Billen: “Laser scanning and photogrammetry were the most used
GOVERNANCE
When 20 cross-border partners are involved, good governance makes or breaks the project. Therefore Roland Billen asked specialist Joep Crompvoets from the University of Leuven for help with monitoring the rules and processes. Professor Crompvoets comments: “It was a successful journey for the partners, during which they built up an interesting personal network. According to our latest survey, most partners intend to continue working together even if the Interreg funding is reduced. They recognize that continuing with Terra Mosana will provide
added value to them.” Among the projects that the partners would like to continue are the storylines, the 3D experiences and the implementation of co-creation with the public. Although the project was hindered by COVID-19 restrictions which affected workshops, exhibitions and public engagement, he explains that some valuable lessons were learned: “The complexity of the Interreg project management has been a serious burden. For a possible follow-up, it is essential that the administrative workload drops significantly in order that more time can be invested in effective project outcomes. We non-exclusive intellectual property licence agreements for some or all of the output generated. Given the potential complexity, it is highly recommended to seek legal advice when negotiating licensing agreements. The specific terms depend on the work at issue, such as images, 3D models, maps and database rights. In a multi-regional context such as this project, multi-territorial licences will be likely. It should also be made clear who owns the intellectual property: all Terra Mosana partners jointly, or individual partners? The rights granted can be limited so the licensee can use the right only in
the defined field (e.g. cultural or touristic services), while Terra Mosana partners themselves retain the exclusive right to exploit it in a different field (e.g. gaming, apps). Crompvoets and Billen agree: “We have to constantly create awareness that Terra Mosana partners should ask for ownership of all the data collected by third parties, not only of the resulting video or app. They must be able to re-use the point clouds or photogrammetry data in other digital projects without having to pay for their own data.”
also concluded that it is important to engage people from marketing and tourism in the follow-up. A stronger communication plan and stronger engagement with the public are recommended too.”
Whenever cultural heritage sites are digitized, legal questions arise relating to copyright protection of the original work, ownership of the generated digital products and access regimes to such content. “This aspect of dissemination of the output was an interesting topic for us, since cross-border jurisprudence is sparsely available,” adds Crompvoets.
LICENSING
EU member states are required to make publicly funded research data available for commercial and non-commercial purposes free of charge. Since the research carried out as part of the Terra Mosana project has been publicly funded, such open access policies will partly apply which may lead to Creative Commons licences. However, data products for which third parties hold intellectual property rights are excluded in the EU directive. This is certainly the case in the Terra Mosana project, where commercial parties are involved in the realization of the experiences. A Creative Commons tool has enabled the Terra Mosana partners to determine which licence is best suited to them, and the conditions under which they want to share their creative content. In projects such as Terra Mosana, it can make sense for partners to consider signing
NEXT PHASE
This intellectual property rights issue will resurface in the next phase, when the currently rather locally oriented experiences will be extended using parts of each other’s projects to create new ones together. The existing presentations will be upgraded to cross-border storylines. Roland Billen: “We have a platform at Liège University that stores all the data. This year, we can capitalize on what we have and connect.” There’s one small problem: not all partners used the same 3D model. “It wasn’t appropriate to keep pushing for that, although it would have made life much easier. Working with three different countries introduces an element of an identity struggle. No one wants to be forced to work with some standard that they are not used to, and every discipline has a different vision on standardization. So we will have to make the formats and models technically interoperable.” In the first phase, the attitude was pragmatic; the partners needed to achieve local success in exchange for additional funding. In Joep Crompvoets’ view, this was “almost inevitable, but we also see that today they know better what to expect and how it promotes the territory they are part of, and proud of. Now it is time for them to reap what they have sown. They’ve seen that topology can be used to show not only geographic relations, but also cultural ones.”
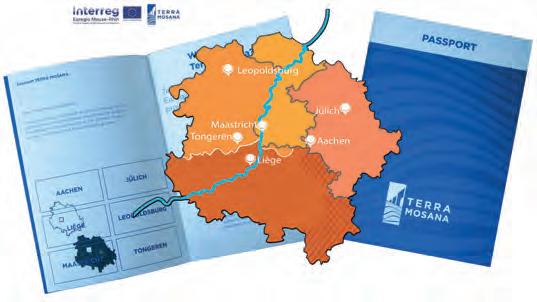
His colleague from Liège confirms: “Terra Mosana is a spatio-temporal concept: this is where the things happened. Geomatics or territory is the ‘glue’. Modern cartography has even more added value in territory without official borders. Additionally, the EU Commission is becoming interested in the effect on sustainable development and social cohesion. For academia, the impact of location-based digital experiences on the public’s interaction with cultural heritage is a theme worth researching. Trans-media storytelling and gamification will be the norm. But don’t forget about paper,” he adds with a broad smile. “There’s already a Terra Mosana ‘passport’. It’s a gimmick, but even adult visitors are keen to get them stamped.”
MONITORING THE PROJECT
Roland Billen is a professor of geomatics in the Department of Geography at the University of Liège (Belgium) and active in data acquisition techniques, GIS, 3D spatial database design, and qualitative spatial reasoning.
Joep Crompvoets is a professor of information management in the public sector at KU Leuven Public Governance Institute (Belgium) and specialist in spatial data infrastructures, GIS, public-sector innovation and e-governance.
FURTHER READING
www.terramosana.org www.youtube.com/watch?v=LUIJZMRUjQw www.interregeurope.eu
ABOUT THE AUTHOR
Frédérique Coumans is contributing editor for GIM International. For more than 25 years, she has been covering all aspects of spatial data infrastructures as editor-in-chief of various magazines on GIS, data mining and the use of GIS in business. She lives near Brussels, Belgium.


