84 minute read
Headlines
Sha re Your E xper iences of Challengi ng Sur vey P rojec ts !
Have you been involved in a challenging surveying project, and would you be willing to share details of your experience with other GIM International readers? The diverse nature of surveying – and its relevance for so many aspects of the future advancement of society – means that industry professionals work in all kinds of environments, often under very difficult circumstances or with spectacular results. If you have an impressive or informative story to tell about how you and your surveying team overcame challenging conditions, Wim van Wegen is keen to hear from you!
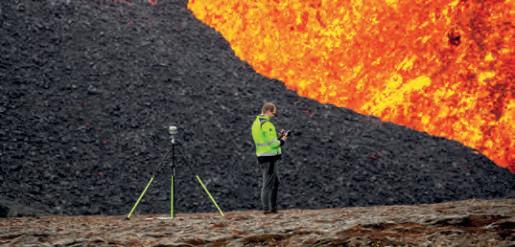
Iceland’s dynamic geodetic situation can be challenging for surveyors, but it also presents opportunities for interesting and exciting projects.
Mosa ic Integrates Mobile Mappi ng Ca mera w it h E x ter nal GNSS for RTK

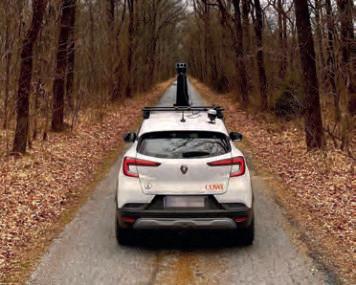
The Mosaic 51, a 360-degree mobile mapping camera, is now fully integrated with external GNSS to easily achieve real-time kinematic (RTK). Thanks to these extended capabilities, Mosaic’s solution offers centimetrelevel accuracy for customers with a high demand for precise position data. It also helps with gathering position with absolute accuracy in challenging conditions like urban canyons, which can pose a huge challenge for standard GNSS positioning systems. In its three years in production, the Mosaic 51 has already gained recognition as the go-to mobile mapping solution for street-level truth with its best-in-class ground level imagery, thanks to its 72MP resolution with 6x12MP image sensors, granting full 360-degree image capture. It is among the highest resolution mobile mapping cameras available.
Mosaic 51, a robust 360-degree mobile mapping camera, now is fully integrated with external GNSS to easily achieve RTK.
Woolper t to P rov ide Topograph ic Map of Pa r t of Niger ia
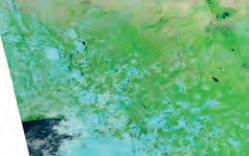
Woolpert has been selected to collect, process and deliver topographic mapping across more than one quarter of Nigeria, or roughly 258,000km2 , under a US$4.4 million contract with the Ministry of Mines and Parts of Nigeria seen from Space by Steel Development (MMSD). The NASA’s Aqua satellite. project is part of the Mineral Sector Support for Economic Diversification Project, also known as MinDiver, and is funded by the World Bank. Woolpert will supply the labour, materials and equipment needed to develop 340 complete topographic mapping sheets and corresponding Multinational Geospatial Co-production Program (MGCP) data. The firm will provide 1.5m processed satellite imagery, digital elevation models, ground truthing, feature extraction and topographic map data. The company also will implement a streamlined MGCP mapping and cartographic finishing workflow through Esri ArcGIS Pro with Defense Mapping and Production Manager. Additionally, Woolpert has deployed a fully-fledged, cloud-based enterprise geospatial data hosting platform coupled with multi-user virtual desktops through Microsoft Azure and Woolpert’s raster service, STREAM:RASTER, to allow for easily managed, cross-continental geospatial production.
Qata r Completes Aer ial Photography Sur vey to Update Digital Maps
Dhows against the backdrop of the Doha skyline.
The aerial survey system for upgrading digital maps of Qatar has become operational. Under the aerial surveys project for Qatar, the mission of aerial photography covering all parts of the country and Halul Island to take 20cm-accurate evaluative aerial photographs has been completed as the basis for updating the digital linear maps of the country. The photography work took place from 30 March to 20 April 2022. The project is being implemented by the Geographical Survey System (GIS) Center of the Ministry of Municipality. It is planned to provide all state institutions with aerial photographs and updated digital maps during July 2022, to be used within the activities and projects of the FIFA World Cup Qatar 2022 events. They could be used later in all other projects of the state in various fields such as planning, education, health, Ministry of Interior services, supporting decision-making and infrastructure development of the country, among others.
FA RO L aunches 3D Digital Real it y Capture a nd Collaborat ion Platfor m
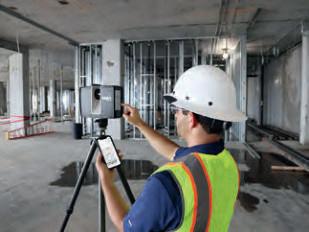
FARO Technologies has launched a new data capture and collaboration platform providing an efficient cloudbased workflow combining three innovative new solutions: the FARO Sphere digital ecosystem for the most effective exchange of data possible, the FARO The combination of the new Focus Scanner, Focus Premium Laser Stream and Sphere is set to significantly reduce Scanner for fast, accurate scanning and processing time. and complete field capture, and the FARO Stream mobile app for real-time data verification. “With FARO Sphere as its backbone, our new end-to-end 3D capture platform provides customers with industryleading ease of use, accuracy and speed,” said Michael Burger, FARO president and CEO. “Real-time data capture validation and remote collaboration will transform how customers generate, access and utilize 3D data models. For our shareholders, Sphere is expected to generate meaningful high-margin Software as a Service (SaaS) recurring revenue over time as customers increasingly realize the benefits of our cloud-based solution.”
Fi nn i sh Geospat ial Resea rch Inst itute Moves i nto New Fac il it ies
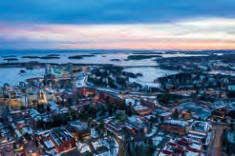
The Finnish Geospatial Research Institute (FGI) of the National Land Survey of Finland (NLS) has moved into new facilities in Otaniemi in Espoo. Roughly 130 FGI employees started working in Many innovative research and the new facilities on 1 May 2022. business facilities are located at FGI is a renowned international Otaniemi, Espoo. (Image courtesy: research organization and Espoo.fi) specialist in the field of geospatial data. In addition to geospatial data research and technologies, its research fields include satellite positioning, space geodesy, laser scanning, and geodata science and computing. For example, the Geodesy and Geodynamics Department is responsible for ensuring that Finland’s coordinate, elevation and gravity systems are up to date. The building is also home to the Geological Survey of Finland (GTK). A new section has also been built in conjunction with the building, housing FGI’s research equipment and other special functions. The facilities were selected by partly applying multifunctional spaces to make them ideal for the research organization’s needs.
NA SA Develops L ida r Backpack Technology for Moon E xplorers
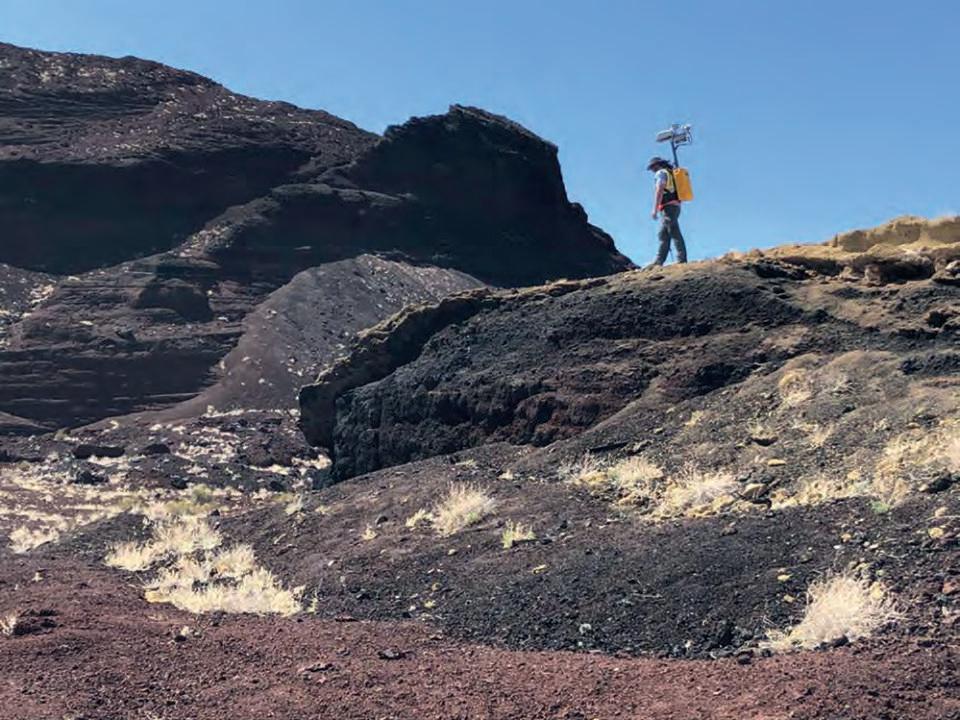
NASA researchers and their industry partners have developed a remote sensing mapping system to aid explorers in the most isolated wilderness imaginable: the airless wastes at the South Pole of the Moon. Now the astronauts, who are like ‘hikers on a mountaineering expedition’ in a wholly uncharted environment, will be able to generate a real-time 3D map of the terrain. The Kinematic Navigation and Cartography Knapsack (KNaCK) is a mobile Lidar scanner that is worn like a hiker’s backpack. It makes use of an innovative type of Lidar called frequency modulated continuous wave (FMCW) Lidar in order to provide Doppler velocity and range for millions of measurement points per second. These measurement points instantly create a real-time navigation system, delivering to the explorer a 3D point cloud or high-resolution map of the surrounding terrain. Using KNaCK during rover excursions and when travelling on foot, explorers could precisely map the topography of the landscape, including deep ravines, mountains and caves. Lidar even works in pitch blackness, relieving astronauts of the need to haul cumbersome lighting rigs everywhere they go.
Michael Zanetti, a NASA planetary scientist, testing the backpack-sized prototype.
Pha seOne Unveil s Aer ial Solut ions w it h Nea r-i nf ra red Capabil it ies
Phase One, a leading developer of digital imaging technologies, has announced its nextgeneration aerial mapping solutions. The Phase One PAS 880 oblique and PAS 280 nadir systems have been enhanced with 150MP near-infrared (NIR) sensors and the most productive workfl ow with the launch of the latest iX Suite SW solution. The new PAS 880i offers the same image quality and image capture rate (2 frames/second) that gained its forerunner a reputation for reliability and productivity. The PAS 880i covers a wide swath across-track: more than 20,000 pixels in nadir and 14,000 pixels in each of the obliques, operated at a variety of airspeeds, altitudes and lighting conditions. It is one of the few solutions in the market that can capture the highest-resolution, blur-free images under the same fl ying altitude and speed conditions for nadir and oblique simultaneously.
Adva nced Nav igat ion Acqu i res Va i Photon ics
Advanced Navigation, one of the world’s most ambitious innovators in artifi cial intelligence (AI) robotics and navigation technology, has acquired Vai Photonics, a spin-out from the Australian Chris Shaw and Xavier Orr, the CEOs and National University co-founders of Advanced Navigation. (ANU) developing patented photonic sensors for precision navigation. Vai Photonics and Advanced Navigation share a similar vision to provide technology to drive the autonomy revolution. Together, they will commercialize their research into exciting autonomous and robotic applications across land, air, sea and space. “The technology Vai Photonics is developing will be of huge importance to the emerging autonomy revolution. The synergies, shared vision and collaborative potential we see between Vai Photonics and Advanced Navigation will enable us to be at the absolute forefront of robotic and autonomy-driven technologies,” said Xavier Orr, CEO and co-founder of Advanced Navigation. “Photonic technology will be critical to the overall success, safety and reliability of these new systems. We look forward to sharing the next generation of autonomous navigation and robotic solutions with the global community.”

L eica Geosystems L aunches New Mobile Mappi ng System
Leica Geosystems has launched a reality capture mobile mapping system called Leica Pegasus TRK, introducing artifi cial intelligence, autonomous workfl ows and intuitive interfaces. The Leica Pegasus TRK solution utilizes artifi cial intelligence capabilities to transform mobile mapping. The advanced dynamic laser scanning and expandible imagery system for recording, measuring and visualizing environments increases productivity with automated, intelligent workfl ows. Due to its low weight, the Pegasus TRK can easily be operated by one person, making mapping projects more effi cient and cost-effective. Because of the system’s user-friendliness, it is suitable for professionals who are new to the technology. At the same time, its reliable, high-quality deliverables serve the needs of technical experts in various industries, including surveying, transportation and utilities. The Pegasus TRK solution features an AI-enhanced camera and automatic camera calibration. To comply with privacy regulations, its artifi cial intelligence (AI) can identify and blur identifi ers, such as people and vehicles, in real time.
CHC Nav igat ion Introduces A i rbor ne L ida r Ser ies
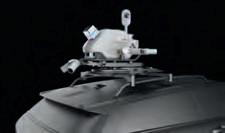
A BB4 UAV equipped with the AA2400 scanner for a city mapping task.
CHC Navigation (CHCNAV) has released the AlphaAir 1400 (AA1400) and AlphaAir 2400 (AA2400) Lidar systems. Both solutions are compact airborne laser scanners that are easily installed on various UAV platforms or small survey aircraft and helicopters. They are ideally adapted to high-density point corridor mapping applications, day or night, under leaf-on and leaf-off conditions or with dense vegetation to provide reliable results. “Nowadays, it is critical to obtain the highest data quality for the majority of aerial survey projects. In addition to state-of-art GNSS and IMU sensors, the AA1400 and AA2400 also integrate RIEGL’s VUX Lidars with their unique Waveform-Lidar technology, allowing echo digitization and online waveform processing. Multi-target resolution is the basis for penetrating even dense foliage,” said Andrei Gorb, product manager of CHC Navigation’s Mapping and Geospatial Division. “The continuously rotating polygonal mirror wheel enables scanning speed of up to 400 lines per second, allowing for effective coverage of large areas when used from fast drones or aircraft.”


Jun iper Systems L aunches Nex t-generat ion GNSS Receiver

Juniper Systems has introduced the all-new Geode GNS3 GNSS receiver. It enables users to easily collect real-time GNSS data with sub-metre, sub-foot and decimetre accuracy options – without the huge price tag or complexity of other precision receivers. This scalable platform allows users to purchase the level of accuracy they need now while having the option to increase accuracy in the future. The Geode GNS3 GNSS receiver is now available worldwide in both single-frequency and upgradable multi-frequency antenna configurations so that users have the level of accuracy needed to get the job done. The Geode GNS3S offers superb sub-metre accuracy with a single-frequency antenna. The GNS3M allows for scalable accuracy, with its multi-frequency antenna including support for all constellations on L1, L2 and L5 frequencies. Multi-frequency signal tracking, together with Atlas L-Band correction subscriptions, allow for up to decimetre accuracy. As with previous Geode devices, SBAS corrections are available for sub-metre accuracy in certain regions. Both models also support local differential GNSS RTK/CORS network corrections through the Geode Connect NTRIP Client.

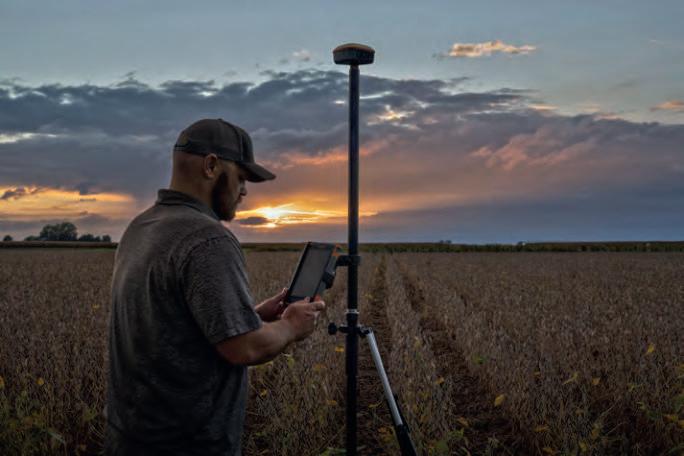
A surveyor using the Geode GNS3 GNSS receiver in the field.

R I E G L V Z-i S e r i e s
TERRESTRIAL 3D L A SER SC ANNERS
WATCH OUR VIDEO
Speed up data acquisition: Speed up data acquisition: VZ-400i in Stop-&-Go Mode VZ-400i in Stop-&-Go Mode on Mattro All-Terrain Vehicle on Mattro All-Terrain Vehicle
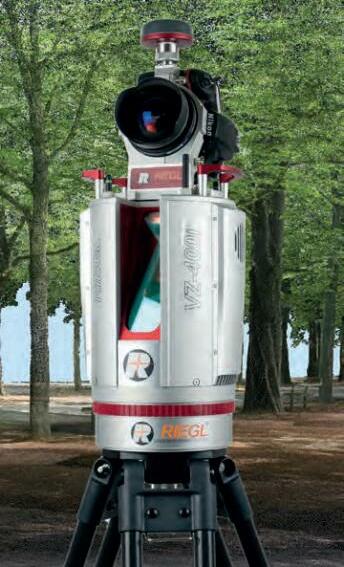
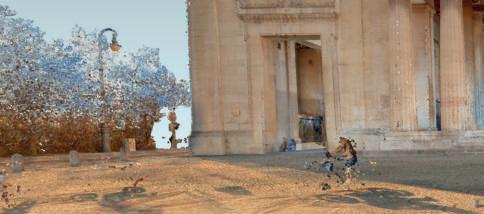
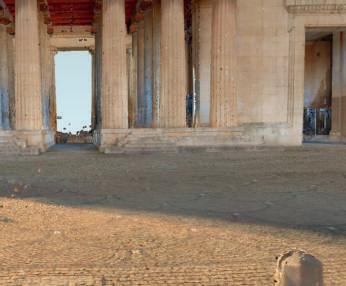
Vienna Prater Main Alley: point cloud, true colored
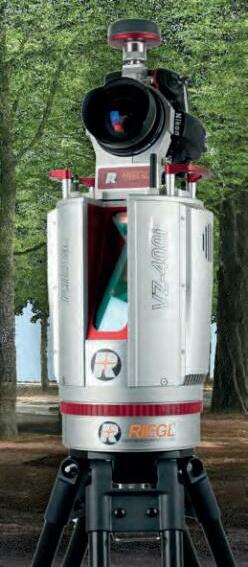
RIEGL WAVEFORM-LIDAR TECHNOLOGY FOR EXTREMELY FAST ACQUISITION OF HIGHLY ACCURATE SCAN DATA
» up to 50 high resolution scan positions per hour – extremely fast data acquisition
» suitable for highly complex and extensive environments (e.g. buildings, narrow tunnel systems, forested areas) – practicable versatility
» 1 TByte SSD memory for more than 1000 scan positions – on-board storage for comprehensive projects
» automatic, reflectorless, extremely robust, and highly precise registration of scan positions – highest accuracy of scan data
» “RIEGL VZ-i Series” and “Project Map” Apps on mobile devices – remote scanner control and real-time visualization of the scan project for smooth scanning
Explore the full RIEGL Explore the full RIEGL product portfolio at product portfolio at www.riegl.com www.riegl.com
A FEATURE-BASED SEMANTIC SEGMENTATION ALGORITHM FOR POINT CLOUD CLASSIFICATION
Deep Learning for Ground and Non-ground Surface Separation
Precise ground surface topography is crucial for 3D city analysis, digital terrain modelling, natural disaster monitoring, high-density map generation and autonomous navigation, to name but a few. Deep learning (DL), a division of machine learning (ML), has been achieving unparalleled success in image processing, and recently demonstrated huge potential for point cloud analysis. This article presents a feature-based DL algorithm that classifies ground and non-ground points in aerial laser scanning point clouds.
Recent advancements of remote sensing technologies make it possible to digitize the real world in a near-automated fashion. Lidarbased point clouds are a type of remotely sensed georeferenced data, providing detailed 3D information on objects and the environment, and have been recognized as one of the most powerful means of digitization. Unlike imagery, point clouds are unstructured, sparse and of irregular data format. This creates many challenges, but also provides huge opportunities for capturing geometric details of scanned surfaces with millimetre accuracy. Classifying and separating non-ground points from ground points greatly reduces data volumes for consecutive analysis of either ground or non-ground surfaces, which consequently saves costs and labour, and simplifies further analysis.

MACHINE LEARNING AND DEEP LEARNING
Machine learning methods with a long history of automatic classification include well-known methods such as Support Vector Machines and Random Forest. However, they are often criticized for their limited generalization capability due to the use of shallow architectures. On the contrary, artificial neural networks with several hidden (internal) layers use a so-called deep architecture which has been applied in recent years with unprecedented success. The main challenge of implementing a supervised DL method is that it requires a sufficient amount of labelled training and validation data to tune a successful classification model. Many researchers believe that the end-to-end DL approach can extract useful features automatically from raw data, and therefore no feature engineering is required, but this is not always true. This article argues that the use of appropriate features can solve classification problems more efficiently while using fewer resources, i.e. a small number of layers and less training data. However, implementing a feature-based DL method needs a clear understanding of both problem and data structure to extract powerful features. The architecture presented in this article, which was originally proposed in the paper by Nurunnabi et al. (2021), is a featurebased DL classification approach that labels ground and non-ground points in airborne laser scanning (ALS) point clouds.
FEATURE EXTRACTION
The proposed algorithm consists of two steps. The first step performs feature design and
extraction, while the second step develops the DL architecture (Figure 1). Based on an extensive review of state-of-the-art literature, the authors selected the most promising and successful features used for defi ning the characteristics of points based on their local neighbours. Features are derived using spherical and cylindrical neighbourhoods of each point of the data. A spherical neighbourhood with a user-defi ned radius is used to obtain 3D geometric features (GFs) based on the covariance matrix generated by the coordinates of the neighbour points (x, y, z). Principal component (PC) analysis is performed to estimate eigenvalues and eigenvectors from the covariance matrix that are used to derive the necessary features. The most common 3D GFs, also known as covariance features (CovFs), are: point normal, curvature, fi rst PC, three eigenvalues, linearity, planarity, scattering, omnivariance, eigentropy, plan offset and verticality. Vertical infi nite cylindrical neighbourhood (with the same radius as the spherical neighbourhood) is used to obtain cylindrical features that relate to the heights of the points (z values). These are the minimum, range, mean, and variance values of z, and the relative position of the point of interest pi within its neighbourhood. Additionally, point density, return number, intensity, positive openness and echo ratio are used.
DEEP LEARNING ARCHITECTURE
The proposed architecture develops a binary classifi er and follows a straightforward artifi cial neural network (NN) workfl ow. The inputs for the network are the feature vectors, and the outputs are the labels of ground (1) or non-ground (0). Fully connected network layers are used with a rectifi ed linear unit (ReLU) activation function for the hidden layers, and a Sigmoid function is used for the output layer. Binary cross entropy is used as loss function, while the use of an Adam optimizer speeds up the model training process. A so-called He initialization strategy and Batch normalization are used to reduce the infl uence of vanishing and exploding gradients. Evaluation of the model is needed to fi ne-tune the necessary hyper-parameters. The network consists of fi ve hidden layers with 50 neurons per layer. Inputs are processed with a mini-batch size of 128. The network is trained with 50 epochs and the one that achieves the highest accuracy is selected as the fi nal model. L2 regularization with a learning rate of y = 0.01 is used to avoid over fi tting. The relevance of the features is studied in several groups (Models) to identify the optimum ones producing the best results.
OPEN-ACCESS AIRBORNE LIDAR DATASET
The newly developed algorithm can be demonstrated based on an open-access airborne Lidar dataset provided by the Administration du Cadastre et de la Topographie (ACT) of Luxembourg. Average point density, horizontal and vertical precision of the data are 15/m2, ±3cm and ± 6cm, respectively. The data is organized into 500m×500m tiles, each of which contains on average 5-7 million points. The points are labelled into classes, e.g. soil, vegetation, buildings, water, bridges, power lines and unclassifi ed. Additional manual editing was performed to obtain more accurately classifi ed data as ground and non-ground points (Figure 3). Two tiles from a semi-urban area (Dudelange, Luxembourg) were selected for use with the algorithm. The test dataset has a height difference of around 20m between the highest and the lowest points.
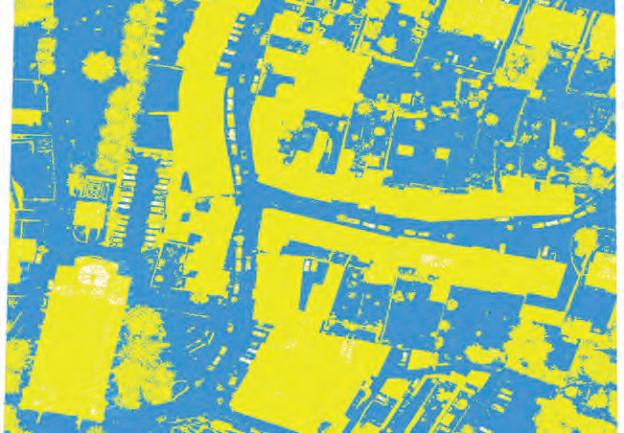
Figure 3: 2D plot of ground truth for the test dataset, showing ground (sky-blue) and non-ground (yellow) points.
Figure 2: 3D aerial laser scanning point cloud of Dudelange, Luxembourg, used as test dataset. The dataset is coloured with RGB values.

DEMONSTRATING THE ALGORITHM
From the selected tiles, one tile was used for training and validation, while part of the other tile was selected as test data (Figure 2). The training-validation tile was sliced into fi ve segments, and one of them was randomly selected as the validation set. The training, validation and test sets consist of 3,481,758 points, 650,764 points and 970,387 points, respectively. The required input vectors were generated with a neighbourhood size of 100cm radius and the proposed algorithm was applied using different combinations of features. Model 3 was identifi ed as the best group of features as it achieves the highest accuracy among the three considered models. It consists of a set of 17 feature vectors: point normal, curvature, linearity, planarity, scattering, omnivariance, eigentropy, plane offset, verticality, point height z, range-z, mean-z, variance-z, point density, positive openness, echo ratio and intensity. Model 3 achieved the highest precision of 99.77% for ground surface extraction, an F1 score of 97.5% and 97.8% for labelling ground and non-ground points respectively, and an overall model accuracy of 97.7% (Figure 4).
SEPARATING GROUND FROM NON-GROUND
The algorithm for pointwise classifi cation (also known as semantic segmentation) of point
clouds used three models which are three different combinations of extracted pointwise local features. The inputs for the networks are point features, rather than the raw point coordinates (x, y, z). It can be concluded that accurate estimation of the height values of the points has signifi cant impact on results. The discussed approach could be successful as a so-called work-horse method to effi ciently separate ground from non-ground points. It combines a high accuracy with relatively low computational load. This distinguishes this method from recent end-to-end deep learning point cloud methods, which typically require heavy and extensive training and are therefore more diffi cult to perform on a standard desktop computer. The non-end-to-end approach described here accepts more information-rich input (i.e. the feature vectors) and therefore requires fewer internal layers. As a consequence, fewer parameters (i.e. the weights of the neuron connections) have to be determined, which makes the method much lighter and more effi cient. CONCLUDING REMARKS
The proposed feature-based DL algorithm classifi es ground and non-ground points in ALS point clouds with a high rate of accuracy. It presents a fully connected deep neural network approach to develop a binary classifi er. The authors showed in the original paper that, unlike most featurebased algorithms, the new algorithm does not require multi-scale neighbourhoods. Hence, it can reduce a signifi cant amount of the computational complexity and saves time when compared to many existing featurebased algorithms. The new classifi cation algorithm is simple but effi cient to perform. This is because the architecture is shallow but powerful, which reduces the computational burden, and extracts both ground and non-ground points effi ciently in the presence of steep slopes, non-smooth terrain and with signifi cant height variability. However, the proposed feature-based DL algorithm requires a thorough understanding of both the saliency features used as input vectors, and the data
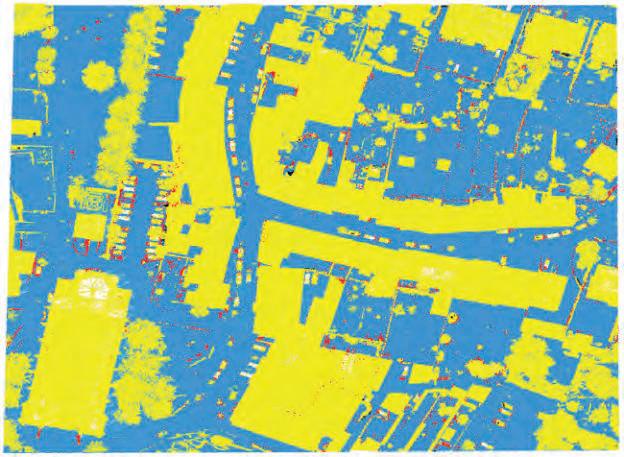
Figure 4: 2D plot of the classifi cation results for the test dataset, showing correct ground points (sky-blue), correct non-ground points (yellow) and misclassifi ed points (red and black).
FURTHER READING
LeCun, Y., Bengio, Y., Hinton, G., 2015. Deep learning. Nature, 521(7553): 436-444.
Nurunnabi, A., Teferle, F. N., Li, J., Lindenbergh, R. C., Hunegnaw, A., 2021. An effi cient deep learning approach for ground point fi ltering in aerial laser scanning point clouds. The Int. Arch. of the Photogramm. Remote Sens. Spat. Inf. Sci., XLIII-B1-2021, 31-38.
properties for tuning the hyper-parameters in the model-building process in order to achieve the highest classifi cation accuracy.
ACKNOWLEDGEMENTS
This work is supported by the Project 2019-05-030-24, SOLSTICE – Programme Fonds Européen de Developpment Régional (FEDER)/Ministère de l’Economie of the GD of Luxembourg.
ABOUT THE AUTHORS
Abdul Nurunnabi is a researcher at the Department of Geodesy and Geospatial Engineering, University of Luxembourg, Luxembourg. He gained his PhD in Spatial Sciences from Curtin University, Australia, with a government scholarship. He did postdoctoral research at the University of Tokyo, Japan, with a scholarship from the Japan Society for the Promotion of Science. He has authored over 60 peer-reviewed research papers. His research interests include statistics, pattern recognition, machine learning (ML), deep learning, data science and feature extraction. abdul.nurunnabi@uni.lu
Roderik Lindenbergh is an associate professor at the Department of Geoscience and Remote Sensing, Delft University of Technology, the Netherlands. He obtained his PhD in Mathematics from Utrecht University, the Netherlands. His main research interests are the properties, processing and applications of laser scanning point clouds and digital terrain analysis using satellite remote sensing data. Lindenbergh has (co-) authored more than 170 peer-reviewed research publications. He has served as chair, PC member, associate editor/board member and organizer for various conferences, workshops and journals. r.c.lindenbergh@tudelft.nl
Norman Teferle is a professor of Geodesy and Geospatial Engineering in the Faculty of Science, Technology and Medicine at the University of Luxembourg. He is well known for his contributions to GNSS, in particular PPP ambiguity resolution, high-precision monitoring and the sensing of the troposphere. More recently he worked on aspects of photogrammetry and point cloud analysis using ML methods as well as BIM for sustainable construction. norman.teferle@uni.lu
PERMANENT 3D DATA ACQUISITION OF GEOTECHNICAL STRUCTURES USING WEB-BASED APPLICATIONS
Scanners for Permanent Monitoring and Their Integration Capabilities
Climate change and the expansion of urban habitats, for example in the alpine region, make it increasingly important to obtain spatially and temporally detailed high-quality datasets that can be integrated into a comprehensive risk management system as an early warning system. A recently published white paper examines this issue and proposes an appropriate solution.
OVERVIEW
Based on the latest developments at RIEGL and DMT, the comprehensive possibilities of integrating a laser scanner into a monitoring system are demonstrated on the basis of an example project in Vals Valley in Tyrol, Austria. The focus is on the proper integration (ensuring reliability, accuracy and integrity) of a long-range laser scanner into a continuous web-based monitoring system, from an engineering geodetic perspective.
Permanently installed in the surroundings of a monitored object, the system permits high temporal and spatial resolution in the acquisition of measured values. The installation of a monitoring system based on laser scanning does not require any prior knowledge of the expected motion characteristics, so different processes can be recorded at a single observation object. In addition to the technical requirements for the sensor system itself, the conditions for data integration, data storage and visualization must also be met as part of a comprehensive risk management system.
ULTIMATE LIDAR TECHNOLOGY
In 2016, the RIEGL VZ-i series of 3D terrestrial laser scanners was introduced. The hardware includes a data processing board, which
enables multiple processing tasks to be performed on board. In addition, an open LINUX operating system allows the scanner to be customized for special purposes by running apps in C++ and Python scripts on the scanner. Thus, specialized apps can be programmed that provide just-in-time results on the scanner for specific applications. Figure 1: System installation in Vals.

These features make it practical to use the hardware within a monitoring system. Reliability is supported by the compact and robust design in a dust-proof and splash-proof housing (IP64).
SITE DESCRIPTION OF VALS VALLEY
The study area is the Vals Valley in Tyrol, Austria [1]. A rockfall occurred in this area on 24 December 2017. Although this caused no human casualties or significant damage to buildings, a road located directly below the rockfall slope was covered with 8m of debris and a total volume of 116,000m3 of rock was relocated [2].
Point cloud data was recorded during three campaigns in 2020 and 2021 using the RIEGL VZ-2000i laser scanner permanently installed on a survey pillar in a shelter (to protect the scanner from the influences of rain, sun, wind, etc.) on the opposite slope, about 800m from the area affected by the rockfall (see Figure 1).
The rockfall area itself was scanned every three hours with an angular resolution of 0.015°, resulting in a point spacing of approx. 14cm in a 500m range. In the time between, consecutive fine-scans of 21 corner cube prisms were performed every 20 minutes. In addition to the laser scanner, inclination sensors on the surveying pillars (PC-IN 1-1° from POSITION CONTROL) and various meteorological sensors were installed in the shelter and in the area of the rockfall. The additional measurements serve to verify daily and seasonal systematic effects on the results (see Figure 2).
THE MONITORING APP
An essential component of the integration of this permanently installed laser scanner is the monitoring app from RIEGL. Each scan has a storage requirement of about 250MB of raw data, which is detrimental to near-real-time data transmission. For each measurement, the monitoring app processes the point cloud in the polar coordinate system of the scanner and converts the data into a compressed 2D representation. All 3D Lidar points are rasterized on a regular grid in azimuth angle and polar angle. All data points within a raster cell are then statistically analysed to generate a 2D image with range and surface orientation information. As a result, the memory requirement is only about 25MB, which is 10% of the memory required for the raw data.
Figure 2: 3D overview of the test site in the Vals Valley including applied sensor technology and overview of the geographical situation of the Vals Valley. (Data Source: Land Tirol - data.tirol.gv.at and http://ows.mundialis.de/)
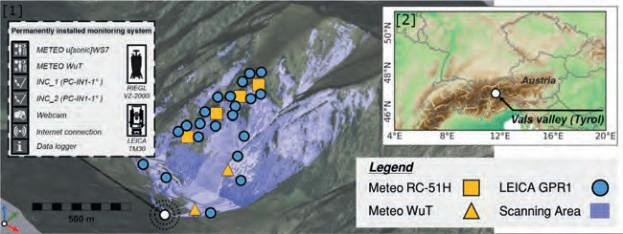
Figure 3: Monitoring App - Scanner Orientation Adjustment disabled (left) and enabled (right).
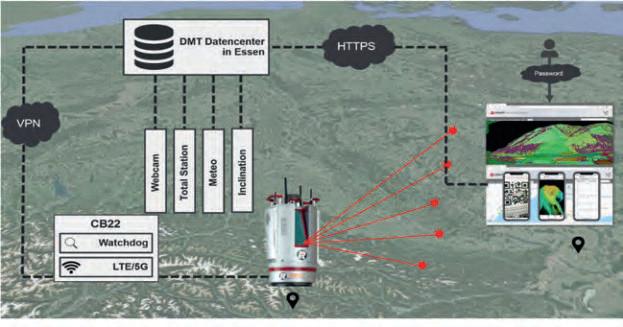
Figure 4: The installation of DMT SAFEGUARD Lidar in schematic view.
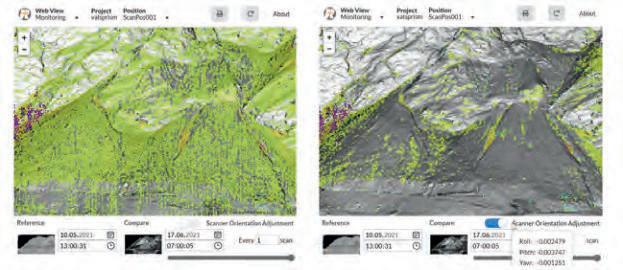
The local surface normal vector information is stored in the alpha channel of the image. The scalar product (a value between 0 and 1) between the local normal vector and the laser beam direction is calculated. The more the surface normal is tilted against the beam direction, the lower the alpha value. The comparison of two scenes can be done ‘on-the-fly’, so that any scenes can be compared within seconds. This development enables use in any monitoring platform (see Figure 3).
Optionally, a roll /pitch /yaw correction of the actual scan with respect to the reference scan is executed. This important feature allows the handling of slight movements of a few millidegrees of the scanner mounting caused by physical or atmospheric inputs. Such a small impact can result in massive errors over a longer range.
INTEGRATION OF THE SCANNER INTO A WEB-BASED MONITORING SYSTEM
The integration of area-based sensor technology intends to provide all stakeholders with a comprehensive set of advanced tools for monitoring, measurement and analysis to determine the effects of a rockfall in terms of ground and slope movement and to deliver important information on the condition of the ground surface. In Vals, a communication box
is connected to the scanner via LAN. The box provides a corresponding power supply and internet connection; in Vals Valley, it is based on an LTE connection. The data connection to the DMT servers is realized via a secure VPN connection (IPSec), so that the scanner itself is initially only available to selected users via the DMT network. The scanner can be used worldwide and is available to many different users within a project.
After initialization, the scanner is able to operate and monitor automatically, although scans can also be started manually via the web application. Initialization of the measuring programme includes the preparation of the monitoring workfl ow, and the parameterization of the monitoring app and of the scheduler app on the scanner. As a fi rst result, data from the monitoring app and the time series of the prism detection are available on the scanner as CSV. In the next step, data is synchronized to the servers in Essen using RSYNC via the secure data connection. The Monitoring App is integrated into the DMT SAFEGUARD interface and is available to users from anywhere in the world via a password protected login (see Figure 4). Dashboard functionality in DMT SAFEGUARD enables intuitive and interactive visualization of the time series from the prism detection (see Figure 5). In addition, all sensors can be displayed in a spatial context on a map. The platform allows decision makers to quickly obtain relevant information, while multiple users can work simultaneously with the platform, enabling collaborative teamwork at any time and in real time. In Vals, Lidar data is complemented by integrating various inclinometers and weather stations and a webcam.
CONCLUSION
The open architecture of the VZ-i series scanners makes it possible to customize the scanner for complex data acquisition and processing tasks using Python scripts and Python-based apps. The online-waveform processing technology used ensured highquality data, even under harsh environmental conditions, and 24/7 and fully remote system operation were proved. Laser scan data was processed by integrated apps in real time on the scanner and the fi nal results were visualized via a web-viewer tool running on all standard web browsers. For more information on this project, scan this QR Code and have a look at the “Permanent Monitoring” white paper by RIEGL and DMT.


REFERENCES
[1] Schröder, D., Anders, K., Winiwarter, L. & Wujanz, D. (2022). Permanent terrestrial Lidar monitoring in mining, natural hazard prevention and infrastructure protection – Chances, risks, and challenges: A case study of a rockfall in Tyrol, Austria. In Proceedings of the 5th Joint International Symposium on Deformation Monitoring (JISDM), Valencia, Spain. [2] Hartl, S. (2019). Analyse der Felslawinen Frank Slide und Vals mit Hilfe des Computercodes r. avafl ow (Doctoral dissertation, Vienna).
ABOUT THE AUTHORS
Thomas Gaisecker holds a Master’s in Geography with a focus on Geoinformatics from the University of Salzburg. He was CEO of ICRA between 1995 and 2003 and also a partner at NextGIS between 2000 and 2003. He joined RIEGL in 2003, where he is now Mining Business Division Manager for RIEGL International. He is an expert in terrestrial laser scanning/UAS-based laser scanning and applications in mining and monitoring.
Daniel Schröder received his Master’s in Geoinformatics and Engineering Surveying from the University of Applied Sciences in Mainz in 2016. Since then, he has been working as a Senior Project Manager at DMT GmbH & Co. KG. The main fi eld of his work is automated geodetic monitoring in mining, natural hazard prevention and infrastructure. He focuses on the use of long-range laser scanners from RIEGL and the integration of GNSS technology from various manufacturers.
THE FUTURE OF CITY MODELLING FROM GEOSPATIAL DATA
Reconstructing 3D Buildings Using Deep Learning
Automated classifi cation and object detection in Lidar and imagery data is essential for minimizing production costs. While the optimization of traditional methods using rule-based algorithms has enhanced geospatial applications, signifi cant manual intervention is still required to obtain a high-quality dataset. This article outlines how artifi cial intelligence (AI) can lead to a robust process for 3D city modelling and discusses some of its challenges.
ARTIFICIAL INTELLIGENCE FOR REMOTELY SENSED DATA
With recent advances in the fi eld of remote sensing, the use of AI has increased signifi cantly among the geospatial community. Extracting meaningful information from an enormous amount of data, now being collected every day, is crucial and requires a workfl ow that is both effi cient and accurate. There are several articles and case studies in which deep learning (DL) methods are used for aerial Lidar classifi cation and object detection; however, utilizing a DL method for industry-level and large-scale applications is a demanding task and incorporating it into the production workfl ow is a challenge. Extracting information through the integration of Lidar and ortho is usually done using automatic methods that involve either colourizing Lidar points using images or concatenating RGB-NIR channels with extracted feature layers from Lidar, such as the digital terrain model (DTM) or the digital surface model (DSM). As a result of these fusions, either the 3D geometrical information of point clouds degrades when transformed into a 2D raster fi le, or the quality of point cloud colourization deteriorates due to reasons such as shadows, obstacles, edges, and so on.
Nevertheless, integrating Lidar and imageries provides an opportunity to improve the AI results for many applications.
AUTOMATIC 3D CITY MODELLING VS DEEP LEARNING MODELS
In automatic methods of 3D modelling that use a programmatic approach to extract the features and digitize the outlines manually, large-scale Lidar datasets must go through a multi-step routine to be classifi ed.
An automatic classifi cation routine would usually include classifying ground points, separating points above ground into classes, and grouping and classifying buildings based on their planar features and other attributes, such as echo. However, various components of the buildings may not be properly classifi ed, such as edges, hips, chimney

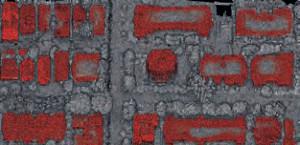
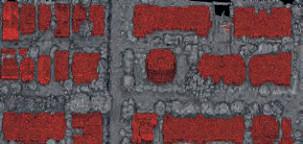
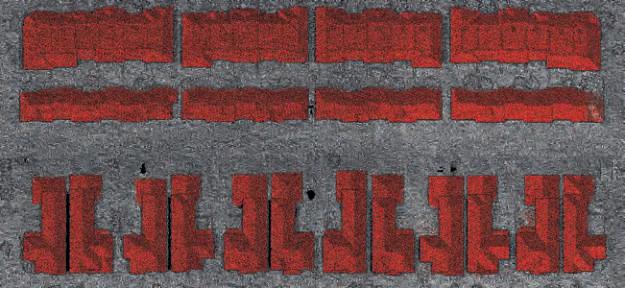
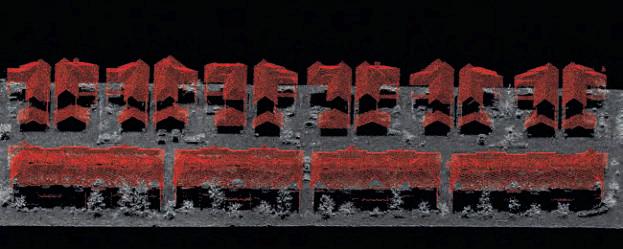
Figure 2: (a) Vancouver Lidar dataset, (b) the predictions of the deep learning model before fine-tuning and (c) after fine-tuning.
Figure 3: Calgary dataset, classified with the deep learning model trained on Nanaimo, and fine-tuned by the Vancouver datasets.
flashing and walls, depending on the texture complexity and Lidar point density. Adjacent objects to buildings such as trees might also be misclassified. This is why manually editing Lidar points is usually required to achieve high-quality data. As a result, the process of automatic Lidar data classification becomes ‘semi-automatic’ and labour-intensive.
Deep learning methods, on the other hand, can perform classification and object detection tasks much faster once trained. One of the main requirements of DL methods and their use in real-world scenarios is the necessity of high-quality training data and the ability to easily differentiate the existing classes in the data from each other. For example, traditional methods tend to eliminate the noisiness of the data by limiting ground points in small triangles. This would leave points with similar characteristics in two different classes, which would cause the DL model to not converge.
TRAINING MODEL AND DATA PREPARATION
To train and test a DL method, we used 186km2 of aerial Lidar from Nanaimo, BC, Canada, with approximately 30,000 roof segments that were automatically classified using TerraSolid and manually digitized by human editors (Figure 1).
The dataset has an average point density of approximately 19pts /m2 and was originally classified into the classes: Never Classified (0), Unclassified (1), Ground (2), Low Vegetation (3), Medium Vegetation (4), High Vegetation (5), Building (6), Noise (7), Water (9) and Bridge Deck (17). Since the objective of this work was mainly 3D city modelling and because the buildings were the objects of interest, we reclassified the data into Never Classified (0) and Building (6), so that the DL model could better differentiate buildings from other points. We used 80% of the Nanaimo data as the training set and 13% for validation. The remaining 7% was used to test the model.
We used the PointCNN model for this purpose and the Lidar data was prepared and fed to the network in block sizes of 50 x 50m with 8,192 sample points per block. Intensity and return numbers were considered in the process as extra features. The coordinates of Lidar points were normalized in the range of the defined block size, and intensity values and return numbers were normalized between 0 and 1. Table 1 shows the precision, recall and F1 scores obtained for the Never Classified and Building classes for our training dataset. It indicates that, despite having imbalanced data (with buildings being just under 5% of the total dataset), the model was able to properly differentiate buildings from other points.
Evaluation Metric Never Classified code (0) Building code (6)
Precision 99.33% 97.13%
Recall 99.53% 95.95%
F1 score 99.43% 96.53% Table 1: Precision, recall and F1 score values obtained for Nanaimo test dataset. CHALLENGES IN AUTOMATION
One of the major limitations of deep learning models is that performance is considerably affected when they are tested on a new dataset or on a dataset with different characteristics, which frequently occurs because of different project specifications (e.g. density level) and varying geographic sites (e.g. urban, forested, mountainous). Therefore, to automate the classification procedure while obtaining acceptable results in various scenarios, it is necessary to make sure that the DL model is generalized and can predict datasets with different characteristics. The new dataset must however have similar feature attributes to the dataset with which the model was trained.
After training the model with the above Nanaimo dataset and achieving highly accurate results, we tested the model on a Vancouver dataset. The Vancouver dataset had an average point density of nearly 45pts / m2, which is noticeably higher than the Nanaimo dataset. As expected, the primary
prediction results did not have the same accuracy as the Nanaimo dataset and the model failed to correctly classify a signifi cant portion of the building points (as represented by a recall value of 67.43% for buildings in Table 2).
To improve the performance of the model on the Vancouver dataset, a small amount of the Vancouver dataset (ten 1km x 1km tiles in total) was used to fi ne-tune the pre-trained model. As can be seen in Table 2, the performance of the model signifi cantly increased and building points were classifi ed with an F1 score value of 96.50% (Figure 2).
After fi ne-tuning the model with the Vancouver dataset, it was tested on a new dataset from the City of Calgary. The Lidar data for Calgary had an average point density of approximately 38pts /m2. As can be seen in Figure 3, the buildings in the Calgary dataset were classifi ed with a high accuracy and the model was able to distinguish buildings from adjacent objects such as bushes, trees and cars. REFINING BUILDING CLASSIFICATION WITH IMAGES
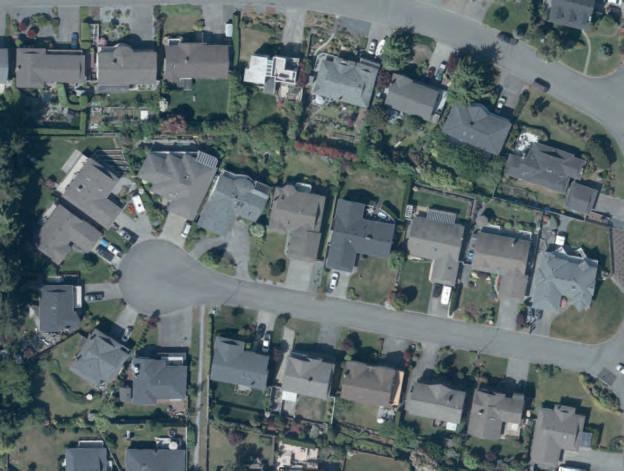
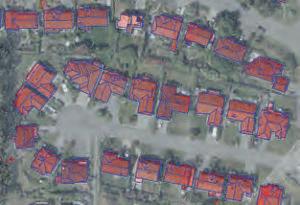
One of the major requirements of Level of Detail (LoD) 2.2 building model generation is building footprint layers. Primarily, the building footprints were extracted from Lidar data in a multi-step process including rasterization, polygonization and regularization. To refi ne the building footprints layer, as well as benefi t from another data source to perform a quality check on both the extracted building footprints and the Lidar classifi cation, we used a pre-trained Mask-RCNN model to detect buildings from aerial images. Building footprints extracted from the imagery were overlaid on Lidar data, and both the misclassifi ed Lidar points and the building footprints were modifi ed accordingly (Figures 4 en 5).
CONCLUSION AND RECOMMENDATION
Employing AI-based methods in industry-level projects requires a well-constructed workfl ow with robust datasets. In this article, we fi rst trained a deep learning model to classify building points in aerial Lidar data using a very
Before fi ne-tuning After fi ne-tuning
Evaluation Metric Never Classifi ed code (0) Building code (6) Never Classifi ed code (0)
Building code (6) Precision 85.69% 98.94% 98.35% 96.26% Recall 99.63% 67.43% 98.09% 96.74% F1 score 92.14% 79.99% 98.22% 96.50%
Table 2: Precision, recall and F1 score values for the Vancouver dataset before and after fi ne-tuning the model.
Figure 5: Extracted building vectors from Lidar data overlaid on the same ortho.
high-quality dataset from Nanaimo. Although the trained model obtained acceptable results on a dataset from the same area that the model was trained with, it failed to achieve a high accuracy prediction due to different characteristics of the new dataset. This poor performance of the deep learning model on the Vancouver dataset meant that the model was not suffi ciently generalized. It is therefore recommended to improve the generalization and transferability of the trained model to enhance the Lidar prediction quality on various structure types by providing more training data.
ACKNOWLEDGEMENT
The authors would like to thank the cities of Nanaimo and Vancouver, and McElhanney Ltd, for providing Lidar data.
AUTHORS
Morteza Esfandiari, MSc, is a geospatial technician with McElhanney Ltd. Morteza received his MSc in Geodesy and Geomatics Engineering from the University of New Brunswick in 2021. His research interests cover applications of machine and deep learning in geospatial datasets, with emphasis on methods for the segmentation and classifi cation of point cloud and raster data. mesfandiari@mcelhanney.com
Dr Azadeh Koohzare, PEng, CMS, is a division manager with McElhanney Ltd. Dr Koohzare obtained her PhD in Geomatics Engineering from the University of New Brunswick. She is an industry advisor for several national, government and academic committees. Having managed more than 150 geospatial projects over her 20+ year career, Dr Koohzare’s expertise in geospatial projects and Lidar / airphoto surveys is hard to match. Dr Koohzare is recognized for her work in North and South America, Africa, the Middle East and Southeast Asia. akoohzare@mcelhanney.com
NavVis Reality Capture Solution


The new standard in reality capture

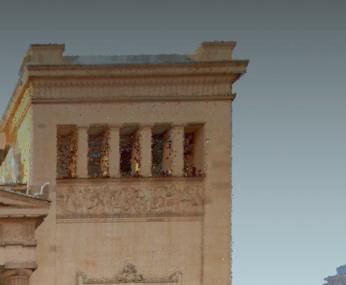
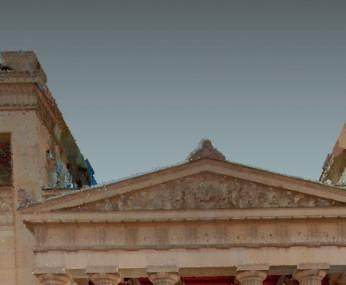
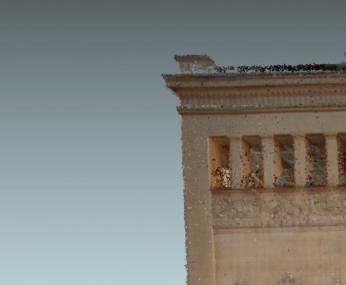
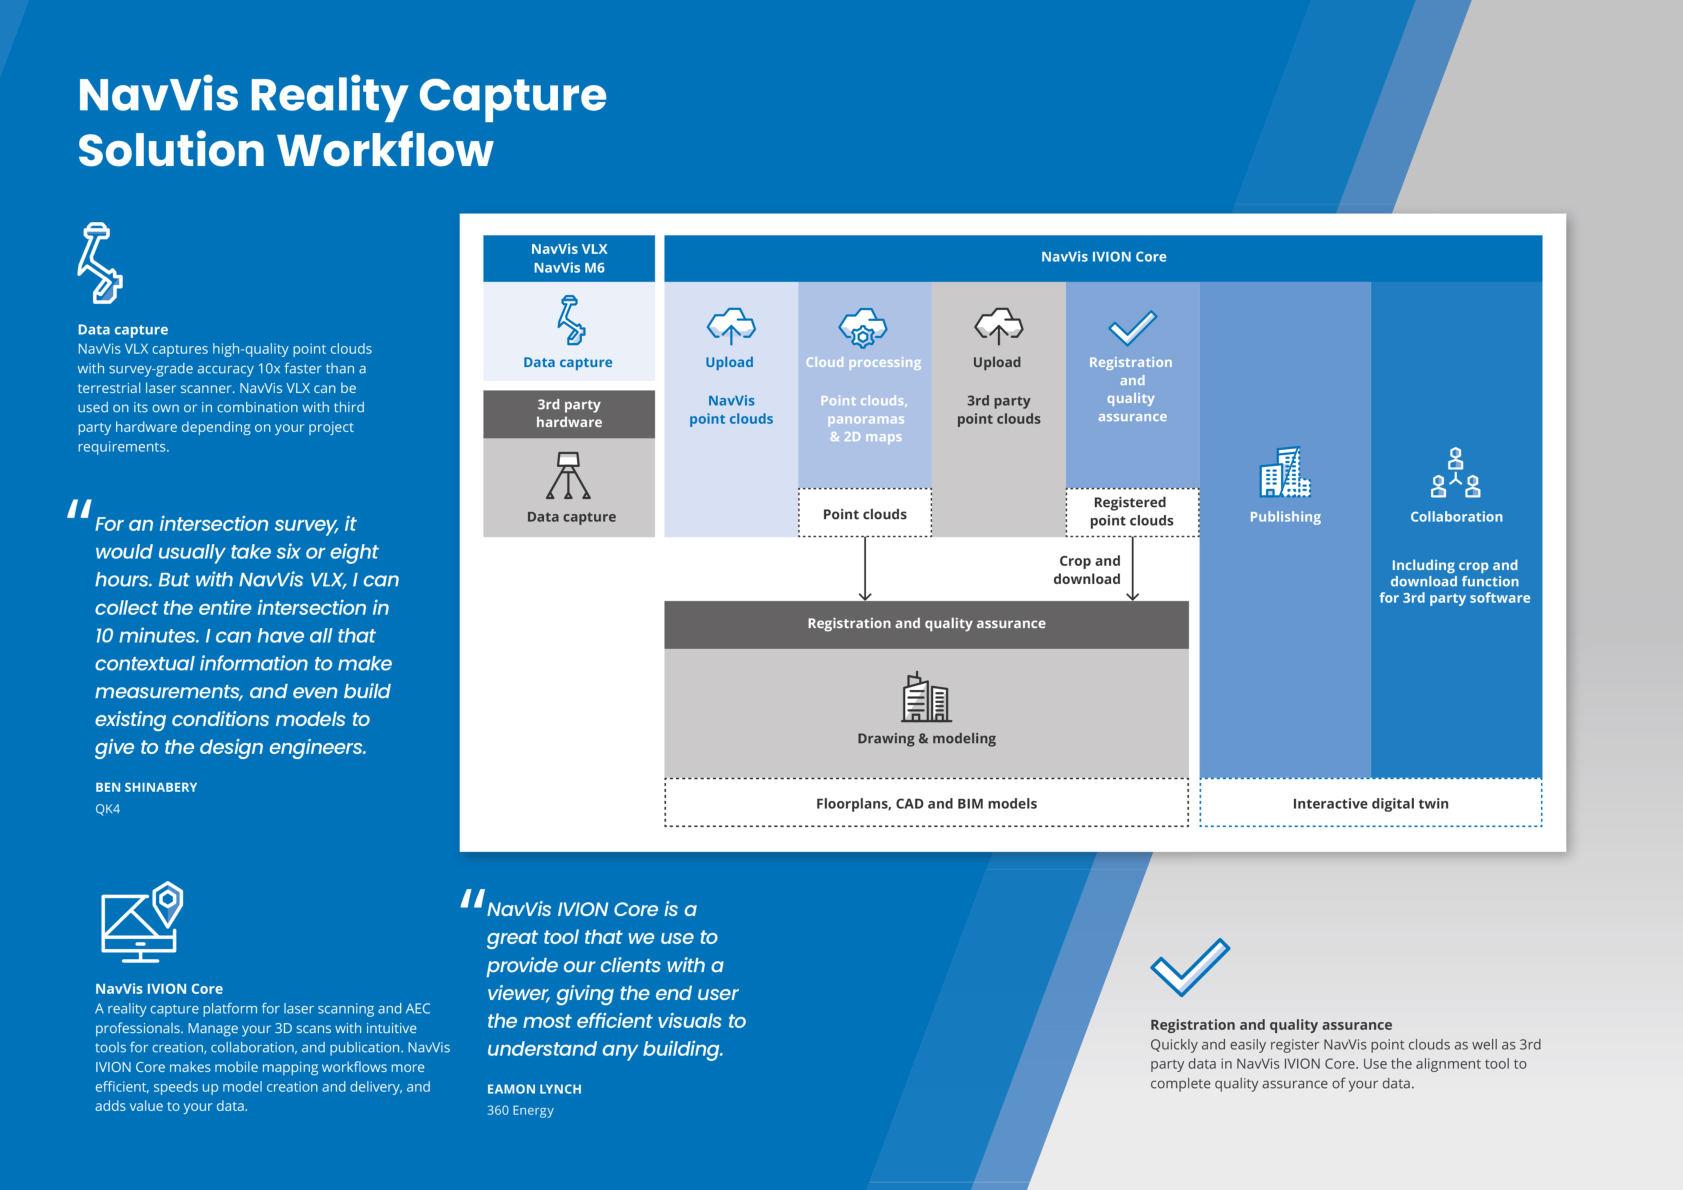
NavVis has the most accurate mobile mapping systems on the market. Used together with NavVis IVION, professionals in the laser scanning, surveying and AEC industries have an end-to-end reality capture solution.


Scan me and discover more

Get it done
NavVis VLX
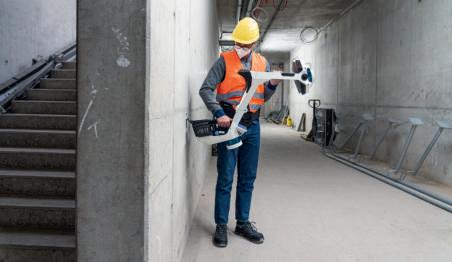
With regular software updates to the SLAM algorithm, NavVis VLX 2nd generation is optimized for outdoor environments and will continue to evolve long into the future. It also boasts IP42 for protection against solid objects larger than 1 mm and vertically dripping water, and a carbon-fi ber frame that ’s super strong and reduces overall weight.


Dynamic scanning. Capture everything from complex indoor spaces to outdoor environments. Superb accuracy. NavVis VLX is powered by precision SLAM technology entirely in a class of its own.
All-in-one reality capture. Take high-res scans and images in every direction for complete 360º coverage.
Grip pads
Shoulder pads
Stabilizing belt Built-in screen
Forwardfacing design
Precision meets ergonomics. A wearable device where operators can scan at the speed of walking. Live mapping feedback. Monitor your scanning progress in real time with a built-in touchscreen interface.
Geo-registration. NavVis VLX can capture control points for precise geo-registration and alignment of datasets.

Survey-grade point clouds
NavVis system software contains a unique SLAM algorithm that ’s been specially developed to overcome the challenges of capturing high-quality point clouds with a mobile system.
Preserve original details Point cloud surface reconstruction preserves details while removing noise for more effi cient use in 2D drawings and 3D models.

Highly realistic texturing Highly detailed point clouds include color and realistic texturing.
Detect and remove dynamic objects Objects that move through the scan are automatically detected and removed from point clouds during postprocessing, resulting in less manual work.
Robust SLAM Robust SLAM algorithms can accurately capture the entire building including the facade and surroundings.
Scan me and discover more




Visit our website and book a free demo today!

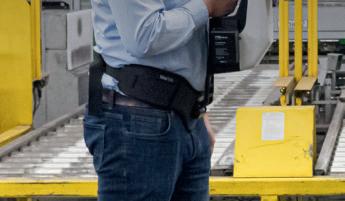

Bridging the gap between the physical and digital world, NavVis enables service providers and enterprises to capture and share the built environment as photorealistic digital twins.
Scan me and discover more
WHO WILL SET THE SCENE FOR FIG OVER THE NEXT FOUR YEARS? WHO WILL REPRESENT THE SURVEYING PROFESSION AND COMMUNITY? WHAT WILL BE ON TOP OF THE AGENDA?
Three candidates for FIG President – Five questions on the future of sur veying and sur veyors
The International Federation of Surveyors, FIG, has since 1878 represented surveyors and the surveying profession globally. Today, it does so in the broadest sense, by including geospatial experts, valuers, construction economists, hydrographic surveyors, land surveyors and so on.
2022 is a special year for FIG, as the FIG General Assembly will elect a new President to take over from President Rudolf Staiger. Two new Vice Presidents will also be elected. This will all take place at the FIG Congress 2022, which will be held in Warsaw, Poland, from 11–15 September. The President and Vice Presidents will be elected for four years, starting from January 2023 and running to December 2026.
So, who are the candidates? This is the first time that the names of the candidates have been announced so early, which gives us the possibility to get to know the candidates a little better. In this article, GIM International and FIG ask the three President candidates – Abbas Rajabifard (Australia), Diane Dumashie (UK) and Orhan Ercan (Turkey) – five questions about their views of the surveying and geospatial profession, the future and their visions if they were the next President of FIG.
Candidates for President for the term 2023–2026: • Abbas Rajabifard, Surveying & Spatial Sciences Institute SSSI, Australia • Diane Dumashie, Royal Institution of Chartered Surveyors RICS, UK • Orhan Ercan, Turkish Chamber of Survey and Cadastre Engineers HKMO, Turkey
Candidates for two Vice Presidents 2023–2026: • Brian Davies, Canadian Institute of Geomatics CIG, Canada • Daniel Steudler, GEOSUISSE, Switzerland • Qin Yan, Chinese Society for Geodesy Photogrammetry and Cartography CSGPC, China • Winnie Shiu, National Society of Professional Surveyors NSPS, USA
Abba s R ajabifa rd
We are living in an increasingly complex and interconnected world and a very fast-growing digital market, and the use of location information in everyday life is growing dramatically. In this context, digital transformation, and our response to global challenges (e.g. population growth, urbanization, climate change, sustainability, resilience and pandemics such as COVID19), are increasingly altering all aspects of our societies and our economic stability. Technological advancements are offering new ways to design, produce, consume and manage by providing a ‘live’ system to model, measure and monitor changes. In this environment, the dependency of projects on land and geospatial information are becoming more crucial compared to the past. Therefore, I see surveying professions playing a more important role, but at the same time the changing directions and new requirements I see for surveying profession are more obvious, and risks are real in this context, in terms of quality of skills, market concentration and external geopolitical factors. How will FIG continue to represent the interests of surveyors in the future?
The role I see for professional associations such as FIG to represent the interests of its members is becoming more strategic in this very fast-changing world. For FIG to maintain its international leading role and to improve its standing, it needs to re-examine its values and vision and develop a smart plan and strategic activities. It also needs to develop a roadmap that ensures that FIG remains relevant and connected and continues to serve the needs of the market
and the interests of surveyors for the world we have today and into the future.
In response to the fast-growing market and global challenges, we see several strategic initiatives from different authorities and global entities (e.g. United Nations, World Bank). These agencies mostly have initiated major work around new frameworks or roadmaps (SDGs, IGIF, NUA) to assist global communities, as well as to improve the efficiency and effectiveness of our actions in response to the global challenges. In these initiatives, land and geospatial information are crucial components for decision-making processes to enable us to effectively respond to the challenges and improve sustainability. This is due to an inter-relationship between the market trends and the global challenges. We need to understand these relationships; therefore, FIG has a major role to play, and we as surveyors, spatial and land practitioners can play a strategic role in this transformation process.
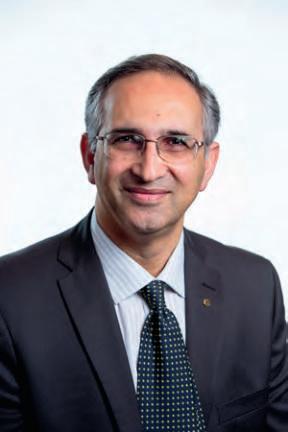
FIG has a major role to play in today’s emerging markets and in empowering Member States to implement SDGs, and we as surveyors, spatial and land practitioners can play a strategic role in this transformation process. Urbanization, natural and human-induced disasters, migration and technological advancements are among some of the most potent forces that are increasing the connectivity and complexity of the challenges highlighted in the SDGs. The SDGs’ dependency on geospatial information and enabling technologies are mainly due to the primary roles that data and tools play in relating people to their location, place and environment, and in measuring ‘where’ progress is, or is not, being made, particularly at the sub-national and local levels. However, in the pursuit of sustainable development, many countries continue to face a series of impediments that limit their ability and opportunity to participate fully in the implementation of the United Nations 2030 Agenda and to support national development and economic prosperity, and through that, a global and thriving information economy. In response to this, and as part of our strategy, we will focus on improving our closer collaboration with the UN, the World Bank and international agencies and play a very active role in all FIG Commissions to facilitate SDG implementation. This is an area in which FIG can take a strategic role to empower the global community and sustain future skills and human resources.
Professional associations are not only important to the professions they represent, but they are becoming an increasingly important source of science and knowledge-based advice to governments and institutions with global responsibilities. My leadership of FIG would ensure that FIG is on a very positive trajectory for future relevance, sustainability and growth.
Should I have the support to serve FIG as president, I will bring a very strong strategic vision that will increase the relevance of FIG in the future. My focus will be on FIG today and in the future – opportunities and challenges, and strategic pathways to nurture strong collaborative partnerships with government, industry and academia, to ensure the next generation of professionals is equipped to meet the needs of the emerging markets and industry. I will bring a vision for FIG that aligns its aim, objectives and mission with all the changes taking place in the market. My motto is: Connect Local Challenges to Global Action / Connect the Global Market to Local Opportunities
For FIG to continue to be relevant, it must be more actively engaged with the key international institutions to ensure that surveying and geospatial knowledge and technologies are fully utilized when dealing with the major global challenges. I will focus on: - Global Agenda: SDGs, IGIF, COVID-19, digital transformation, power of location, climate change, digital economy, digital
Professor Abbas Rajabifard is a surveyor and internationally recognized scholar and engineer, and an active leader in land administration modernization, sustainability and resilience and the development of digital twins. He is a strategic thinker who is passionate about driving innovation and change within the surveying and geospatial profession. He understands the complex environment that we work in and the need to build collaborative partnerships to maximize opportunities for growth. Abbas has proven experience in leading and chairing professional organizations and executive science panels, such as the Global Spatial Data Infrastructure (GSDI) Association and the UN-GGIM Academic Network. He is currently Director of Smart and Sustainable Development and Geomatics Discipline Leader at the University of Melbourne. He has more than 30 years of experience working at various state, national and international levels in industry, government and academia, in a career path that has always been in surveying, land administration and spatial. He has been nominated by the Australian Surveying & Spatial Sciences Institute (SSSI).
twins, opportunities for surveyors / practitioners; - FIG Commissions and interrelationships (cross-cutting collaboration); - FIG diversity and inclusion; - Regional focus (needs, challenges and opportunities); - Young surveyors and women in surveying
(supporting digital surveyors /engineers); - Capacity-building (human capacity and organizational capacity) and providing new digital skills.
Dia ne Duma sh ie
As the biggest international society representing the geospatial and surveying profession, FIG offers a global platform of exchange and influence for our stakeholders. Over recent years, I’ve had the pleasure of holding the Council remit on some of the strategic stakeholder engagements and I can see that above all our profession needs to remain relevant, serve the public interest and leave no one behind in a world of rapid and dramatic change.
To continue to provide leadership in society we must be ready to innovate, to adapt and to lead the response to change. To remain impactful over the coming decades, our work will be shaped by the major global forces affecting societies. These include climate action, rapid urbanization, environmental and resource stewardship, technology revolution and demographic influences. By way of example on the how, I’ll draw on two of these forces.
First, the ongoing digital transformation. Our profession has been in transition for some time, but we can’t stand still; we must be prepared for the future by adapting now. Our societies are more connected than ever and geospatial is underpinning a lot of what we do as realtime services become society’s expectation and demand is growing across all our FIG professional disciplines. We do not have a monopoly over this abundant data that is richer and more complex than ever before, and we have to better appreciate that the increasing convergence between our sector and tech sectors is happening now and we must claim our relevance.
Second, adaptive organization and adaptive skills. Crucially, our profession crosses four generations. Those of us already in the workforce are now employed in ways we could have hardly imagined. Inevitably for our younger people, their work view has already changed. This was demonstrated in the round table of young professionals that I chaired at the FIG WW 2021 entitled ‘Reimagining the future of the surveying profession post 2020’. We are stepping-up to meet the challenge, but we need to do much more and we have to attract and develop talent with the key people skills to take up the ambassadorial, collaborative and engaging leadership roles of the future.

FIG brings together the broad and diverse field of survey disciplines. Drawing on my history of senior roles in FIG, the best means to represent the diverse interest of surveyors is to ensure that FIG leads, listens and collaborates. It is an imperative to bring positive changes to the built and natural environments in the face of global forces; we must be trusted by our stakeholders and society and as a sustainable 21st-century professional body. This raises the question whether our profession is prepared and resilient to engage in developing a better world for society and the planet. Foremost, having chaired the FIG Governance Task Force ‘Our profession: Fit for the future in how we work and organize’ (FIG WW 2021), I have listened and learnt first-hand from FIG members about the increasing need and desire for resilience and sustainability within our profession. I can see that the ongoing geopolitical changes mean that our profession needs to maintain an influential voice at all levels to continue our beneficial society impact. It is imperative that FIG leads and advocates to raise awareness for our members to step up and respond to this impetus for change.
The 2030 Agenda (SDGs) united global policy to transform the social, economic and environmental dimensions of humanity and our planet. Importantly, the UN mantra – to leave no one behind – highlights our own professional expertise in land and geospatial data seen in many of the SDGs.
2030 will soon be upon us, and meeting the goals requires ambition and leadership and a clear pragmatic plan. Taking action using the SDGs along with climate change action is underpinning everything we need to do now; to walk the path to climate equity we need action in cities and to secure and manage our planet’s natural resources.
Sustainability and resilience are not business as usual; there are readily accessible options with emerging innovative technology. Having been involved in the 2030 Agenda for over a decade, my presidency would advocate for an Environmental, Social and Governance (ESG) agenda. I’d seek to build on the very good work of the FIG Task Force on the SDGs2 to encourage speed and scaling up into our professional activities and to adopt a fresh view of the SDG project. Understanding the big agendas and proactively advocating issues allied to professional excellence is important, as explained in my webinar in the RICS Value the Planet series3 which concludes with actions that individual members can take in their own professional work.
Land administration is at the heart of all FIG activities. As former Commission Chair and Chair of ACCO, I’ve seen clearly how this is addressed in various ways in all the FIG Commissions. Land Administration is the operational engine within Land Governance and is rooted in the cadastral area. The recent developments in land administration are significant for managing the built and natural environment. The fit-for-purpose concept has been developed in recent years by some prominent members of the FIG community and provides an approach to closing the cadastral gap, especially in developing countries, by building frameworks that meet today’s societal needs. FIG promotes this, thereby supporting poverty alleviation, empowering the poor, and meeting the SDGs. The surveying profession will be the key custodians of maintaining and constantly improving such nationwide systems. In the same way, FIG supports the work of UN-GGIM. The IGIF provides an operational framework for building such interactive data management systems, along with supporting the efforts of the UN-GGIM and the World Bank to develop the practical guidelines for implementation and economic impact assessments. FELA is a more general framework building on the same structure as the IGIF. FELA is a great framework for referencing and FIG encourages the building of comprehensive land administration systems.
My agenda for action is underpinned by sustainability and resilience in the professional sphere and society space, to enable our professionals to take action on the most important issues of our time. To navigate the decade of transformation, one thing is certain; we must act together. Given FIG’s unique structure with a GA of member associations, my overriding goal is to respond to the global challenges at both the council and national level. I’d also emphasise professional development, to be filtered back to the individual member associations for local implementation. What is clear to me is the certainty about context and connectivity. I foresee this is a time of opportunity if we embrace the adaptability mindset. My headline goals include: Climate action and the SDGs: Sustainable development is at the heart of developing resilience to climate change and achieving net zero emissions; Build on the importance of SDGs, poverty alleviation and social equality Digital transformation: Claim our relevance in data and technology; Advance the role of the Geospatial Knowledge Infrastructure (GKI) in society and economy; Provide user-friendly, low-cost land administration and property systems Community diversity and inclusion: Resilience of our profession for attracting new recruits, encouraging succession plans and upskilling all generations Governance in the FIG organization: Member communication, collaboration and value added
As a global professional body, we need to respond to these challenges if we are going to ensure that our members deliver confidence in the years ahead. My tenure will work for. My tenure will work for clarity and collaboration, purpose and reliability, and action and courage.
Dr Diane A Dumashie. FRICS, CEDR, Director of Dumashie Ltd; FIG Vice President; Trustee of LionHeart Benevolent Fund, RICS Standards and Regulation Board
A fellow of the RICS, Diane delivers strategic projects that have a clear social, economic livelihood agenda linked to land. Works in the UK and internationally helps the public sector and donor multilateral and bilateral agencies to generate benefits to society. Adept at enabling, facilitating and bringing people and resources together to achieve organizational objectives. Diane leads and innovates to manage change, energizes and resolves complex issues in the areas of land management, land administration, gender rights, land and coastal property regeneration. A passionate ambassador of professional development, Diane has throughout her career held voluntary roles to serve the profession worldwide.
Orha n Erca n
The FIG definition of surveyor, from 2003, identifies the broad scope of surveyors and importantly advises that surveyors must consider the relevant legal, economic,
The SDGs are intended to be a blueprint for a better and more sustainable future for all and surveying professionals have a key role to play in this. It is therefore of crucial importance that FIG member organizations and surveyors are aware of how their work contributes to the achievement of the SDGs and vice versa.
The SDGs, which run from 2015 to 2030, are already near the mid-point of the cycle. FIG should develop advanced hybrid tools for community engagement and building sustainable partnerships. Good spatial monitoring of the SDGs will enable the better planning and development of what will follow post-2030. However, such engagement should be professional and objective and add value rather than just providing fora for promotional engagement.
The SDGs document, which is being prepared by the Task Force, will be considered as a practical guide in my term.
environmental and social aspects. Surveying is a long-established profession, but it is also at the forefront of change, which also must include technological change. We live in an increasingly complex and interconnected world and the expertise of the surveying and geospatial professions has never been more important. Although the traditional roles of surveyors continue, albeit with delivery and outputs revolutionized, the roles are also now far wider given the increasing challenges of climate change, disasters, conflict and pandemics. The profession remains more relevant to society than ever before and it must continue to do so.
Global factors, new technology, societal demands, external factors, surveyors’ expectations and young surveyors are triggering the need for change, both in geospatial and land management. Artificial intelligence, the internet of things and big data technologies are changing industries, societies and our way of life.
From a small survey I conducted in the scope of the campaign, I have induced that the needs of countries and continents differ substantially. A typical example is that NSDI sets the agenda for Central Asian countries, while Asia Pacific countries focus on digital twins, smart cities, international cooperation and knowledge transfer within the scope of digital transformation. Interestingly, African countries keep land policy frameworks, land registry, initial cadastre, geospatial data production, technical standards, institutional strengthening, capacity building and modern technology usage on the agenda, while Balkan countries are more interested in cadastre, land consolidation and automation issues. In addition, some European countries are also working on SDI needs, quality improvement of land registry system and records, cadastral renewal, more automation, smart cities, sustainable business models, citizen-oriented land projects, innovation, international networks, cooperation and knowledge transfer.
As a global society, FIG provides an international forum for continuous discussion and development aiming to promote better scientific, technical and professional knowledge, standard and practices. FIG publications, which have become a tradition, are very important sources that guide our member associations and practitioners as a synthesis of science and practice.
FIG will take care to develop and share new knowledge and practical experience among surveyors from various regions. FIG will work more closely with regional and local associations and coordinate with them in addressing major professional challenges. FIG will continue to contribute and collaborate through knowledge transfer with member associations using both face-to-face and virtual tools. Finally, FIG will develop linkages with grassroots surveyors and young surveyors in as many countries as possible and encourage diversity. What do you think of the current developments in land administration, fit-for-purpose, IGIF, FELA and so on? How can FIG play a role in this?
Regarding land administration, Cadastre 2014 has been FIG’s most influential publication in the history of FIG. It has influenced fit-for-purpose and has been especially significant in that it has called out the over-engineering of spatial /
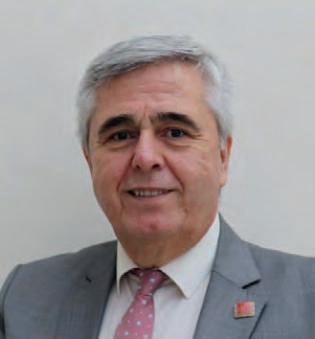
Orhan Ercan was FIG Vice President for the 2017-2021 period and previously worked in the General Directorate of Land Registry and Cadastre in Turkey.
Since retiring, he has worked in the private sector and is currently a member of the Faculty of Applied Sciences in the Department of Real Estate Development and Management at Ankara University. During his private-sector studies, he carried out various national and international surveying projects, thus gaining private-sector experience as well as widening his professional spectrum. He has participated in all three corners of the academic/public-sector/private-sector cooperation framework or ‘industry triangle’. He crowned this experience with the association experience he gained from his HKMO and FIG activities.


D E A L E R S H I P O P P O R T U N I T I E S AVA I L A B L E
surveying accuracy of the cadastre for land registration. Much of the overengineering is attributable to vested interests in the surveying profession. It was through FIG collaborating initially with WB that led to FIG Publication # 60. Further FIG collaboration with UN-Habitat GLTN enabled the preparation of detailed guidelines. FIG will continue to engage and provide fora to share, discuss and evaluate best practices. After that, the role of FIG should be to promote these achievements and build upon experience sharing in the various regions.
FIG will continue to promote the important principles of VGGT to encourage accessible, transparent and sustainable land administration around the globe and to support the attainment of the 17 SDGs that are directly or indirectly related to land management.
Developing smart solutions for building strong partnerships within the global geospatial society and improving engagement among developed and developing member associations, academic and corporate members to overcome new emerging challenges and turn those challenges into opportunities. Based on my answer to the second question, it is among my goals to work more closely with member associations to better understand their needs and to produce solutions together. Another important issue is to develop more effective cooperation opportunities with regional bodies such as the Council of European Geodetic Surveyors (CLGE), the Africa Regional Network (ARN), the Federation of French Speaking Surveyors (FGF), Arab Land Initiatives, the Mediterranean Union of Surveyors (UMG), Asia Pacific CBN, RICS, NSPS, CAGIS and Latin American Surveyors. We will take the necessary initiatives to activate academic members and make them more productive within the FIG. We will also work with the Young Surveyors Network (YSN) to promote wider participation and encourage and mentor the next generation of FIG leaders. Furthermore, we will continue to give special importance to the issue of women in surveying.
As the Vice President of FIG, I succeeded in making the countries with a population of about one quarter of the world a member of the FIG in various categories during the 2017–2021 period. However, the world map on the FIG web page shows that some countries are not yet members of the FIG. I and my colleagues will do our best to embrace the whole world by making FIG the ‘World Federation of Surveyors’. We will also make the necessary attempts to publish the peer-reviewed papers presented at FIG events as a ‘FIG Special Issue’ in one of the journals within the scope of the WoS/SCOPUS indexes. Strengthened engagement with international development agencies will be ensured, including the World Bank Group (including IFC and the Annual Conference on Land and Poverty), UN-FAO, UN-Habitat including GLTN, UN-Stats including UN-GGIM (global and regional), IFAD, key development agencies and NGOs /CSOs and the Global Donor Platform for Rural Development.


CHC Navigation
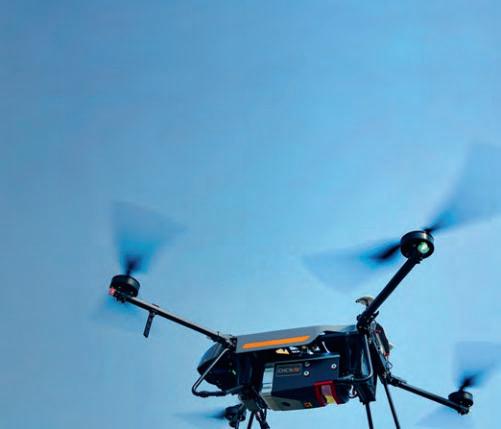
One of the geospatial industry’s fastest growing companies is expanding the reach of its navigation and positioning solutions in Europe and the world
CHC Navigation is expanding its reach throughout Europe and the world, with more dealers and customer support and advanced training and service points. The Shanghai-based company has been a player in the mobile mapping industry for almost two decades. Founded in 2003, initially as a provider of GNSS technologies for the domestic market in China, the company’s evolution has since tracked the stellar expansion of the GNSS navigation and positioning industry.
CHCNAV now offers end-to-end precision positioning solutions encompassing both hardware and software for applications in land and airborne surveying, conventional GNSS surveying, 3D mass data acquisition, unmanned navigation and robotics, precision agriculture and more.
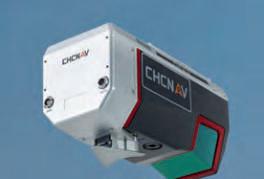
CUSTOMER-CENTRIC, TECHNOLOGYDRIVEN AND THE HIGHEST QUALITY STANDARDS Having a large domestic market as a testing ground for new products and platforms has been a huge advantage for the company, which employs more than 700 engineers at its four R& D centres. Moreover, CHCNAV reinvests 15% of its revenues in R& D, including fundamental research. This has yielded a fusion of technologies able to provide positioning accuracy in the millimetre or centimetre range, as well as precision ultra-high-speed long-range scanners. Its hybrid positioning systems merge the strengths of GNSS, MEMS, IMU, Lidar and optical data. CHCNAV’s steady output of ruggedized, reliable technologies and workfl ow solutions has earned the company a growing following of users in Germany, France, Hungary, Romania, the U.S. and elsewhere. Recognizing the importance of reliable logistics, the highest quality standards and service and training within customers’ reach, CHCNAV has made management systems another hinge of the business. It has proven systems in place – adapted from leading international high-tech companies – spanning product development, manufacturing and human resource planning. These are designed to get customers the solutions they need to solve the geospatial positioning challenges they face in their applications. CHCNAV develops leading-edge technologies, but always with the goal that the technologies remain affordable. The APACHE 4 autonomous hydrographic survey marine drone and the AlphaAir 450 Lidar system are just two of the products recently released to the international market that are solidifying CHCNAV’s position as a leader in the geospatial industry.
APACHE 4 MARINE DRONE The APACHE 4 marine drone, released to the international market in May 2021, is a compact unmanned surface vessel (USV) featuring a combination of an ADCP (Acoustic Doppler Current Profi ler) for cross-sectional fl ow measurements and a single-beam echosounder. It eliminates the high construction and maintenance costs of the traditional ropeway towing systems used to carry ADCP for cross-section water fl ow velocity and discharge measurements. The APACHE 4 offers an unattended operation solution with a shallow draft, high navigational accuracy and stable hovering. It is compact, easy to launch and handle on-site, and can be conveniently transported by car.
KEY FEATURES OF THE APACHE 4 Integrated adaptive water fl ow straightline and hovering technology. As water fl ow and turbulence change, the APACHE 4 autonomously follows the defi ned profi le, navigating in a straight course along the cross section. The hovering technology improves fl ow estimation accuracy and ensures that the APACHE 4 hovers stably in turbulent fl ow at the start and endpoint of the ADCP observation. GNSS+ IMU. The on-board GNSS+ IMU module provides uninterrupted positioning and heading data even during transient GNSS signal loss. The obstacle avoidance radar system and live video feed guarantee safe operations in case of loss of visibility or diffi cult environmental conditions. AlphaAir 450 mounted on CHCNAV BB4 drone.

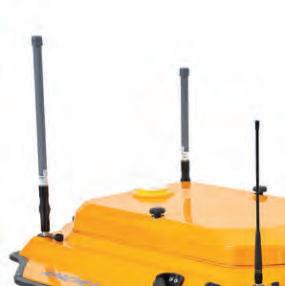
APACHE4_Autonomous Hydrographic Survey USV.

Built-in single-beam echosounder. This allows the user to verify and compensate for the ADCP bottom tracking data accuracy, while providing water depth profi le data associated with the fl ow velocity profi le measurement. Compatible with most ADCPs. The APACHE 4 can embed different types of ADCP sensors, such as the M9, RTDP 1200, RiverPro or RiverRay while providing them with positioning, orientation, power, waterproofi ng, local network and 4G transmission.
ALPHAAIR 450, A BREAKTHROUGH IN AIRBORNE LIDAR AFFORDABILITY The AlphaAir 450 (AA450) Lidar system is another product that is generating huge interest in CHCNAV innovations. Lidar scanning is an ideal technology for capturing 3D data, but it has long been overly costly and complex to operate. Andrei Gorb of CHCNAV’s Mobile Mapping Division characterizes the AA450 as “a breakthrough Lidar scanner that delivers user-friendly and high-accuracy capabilities at a reasonable price”. The AA450 is the lightest, most accurate and cost-effective Lidar UAV system in its class. Released to the international market in March 2021, the AA450 integrates a high-performance laser scanner with an industrial-grade professional 26MP camera and a high-precision inertial navigation system. It is widely used for power line inspection, topographic mapping, emergency response, agricultural and forestry surveys and more.
KEY FEATURES OF THE AA450 Lightest in its class. The AA450 weighs 1kg, making it perfectly suited to drone payload requirements. Advanced accuracy. The combination of industrial-grade GNSS with a high-precision IMU means the AA450 easily achieves an absolute accuracy of 5cm (vertical) and 10cm (horizontal) for small survey areas. For even more precision and accuracy, users can apply adjustment algorithms in the CHCNAV CoPre software. Industrial reliability. High-level IP64 protection means the AA450 can withstand the challenges of fi eld environments, with operating capability in temperatures from -20˚C to +50˚C. This provides more fi eld survey days in a year, increasing users’ return on investment.
BUILDING A SMART WORLD WITH PRECISE SPATIO-TEMPORAL INFORMATION CHCNAV offers products, services and end-to-end solutions across seven major industries: • Surveying & Engineering • Mobile Mapping & Geospatial • Marine Surveying • Navigation & Infrastructure • Precision Agriculture • Machine Control • GNSS OEM In precision farming, for example, CHCNAV automated steering retrofi t kits for tractors are experiencing a phenomenal uptake. Their affordability and ease of use put the effi ciencies of precision positioning in the reach of all farms, whatever their size. Powered by local, network or satellite RTK corrections, the GNSS+ INS terrain compensation technology provides a handsfree accuracy of ±2.5cm over any terrain. Digital 3D twins is another area where CHCNAV technologies are pushing frontiers. The purchase of a 3D mobile mapping system is too often constrained to a specifi c purpose, such as airborne or ground survey. CHCNAV customers expressed a need for a professional Lidar solution that can be used in different scenarios, offering optimal adaptability to their current and future needs. The AlphaUni series is an innovative multi-platform Lidar system that can be used with an aerial or marine drone, on a vehicle or carried as a backpack to provide sophisticated and comprehensive 3D models.
DIGITAL CONSTRUCTION BREAKTHROUGHS ON THE WAY Moving from GNSS Lidar to digital construction is a major next step for CHCNAV. It has a range of technologies for contractors, including machine control for equipment such as excavators and graders, as well as its surveying and site monitoring solutions. At INTERGEO 2022, it will present a full line of solutions that stand out in affordability, while providing dramatic improvements in productivity across work processes and delivering exceptional return on investments. To fi nd out how CHCNAV’s integrated positioning and navigation solutions can make your work more effi cient, contact us at: marketing @ chcnav.com.

MODELLING FOR RECONSTRUCTION NEEDS AND BIM DEVELOPMENT
3D Modelling of Buildings Using TLS Technology
The developments taking place in software and technology in many spheres of everyday life and business mean that higher and higher standards are being set in terms of quality and time. In the fi eld of the 3D modelling of buildings too, there is an increasing emphasis on obtaining a highly detailed, high-quality 3D model in near real-time. As a result, the TLS (Terrestrial Laser Scanning) method is becoming increasingly important.
TECHNOLOGY
TLS technology involves the use of a laser scanner mounted on a static tripod. A beam is emitted from the laser sensor, refl ected from the object and returned to the laser sensor. During this process, the laser travel time is measured. Therefore, the distance travelled by the laser beam can be calculated. By combining this distance with the known position of the laser scanner, a large number of points can be obtained, leading to a point cloud that represents the surrounding space in three dimensions. When surveying buildings and similar spatial entities, a laser scanner can be placed at multiple stations to cover the entire object. It is important to ensure an appropriate overlap between the scans obtained at successive stations, based on which individual scans are imported and processed into a complete 3D representation of the building.
ADVANTAGES
TLS has many advantages compared to traditional surveying methods. For example, it increases productivity, as a large amount of high-density data can be collected in less time and with fewer resources. Much more information is also obtained: apart from 3D positional information, the obtained data includes refl ected intensity values and colours if the TLS has an integrated RGB camera. This makes it easy to create an accurate geometric model and to extract the required data such as dimensions, spatial positioning and structural characterization.
TLS is also an easy-to-use technology; it is a fairly automated surveying procedure and learning how to use the instrument does Figure 1: TLS surveying and creation of 3D model of building.

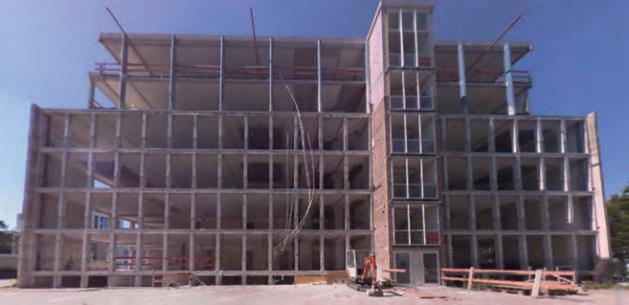
Figure 2: Surveyed building.
Table 1. Number of scans per fl oor
not take much time. Furthermore, it is a non-contact technology, enabling surveying in hard-to-reach areas and improving safety in hazardous environments. Finally, it has a relatively high accuracy. Although the single point accuracy of TLS is usually lower than traditional techniques, it can be improved through adjustment techniques and the accuracy achieved using this method is satisfactory for most applications.
TLS SURVEYING AND CREATION OF 3D MODEL
The process of TLS surveying and the creation of a 3D model of a building as implemented in this article is shown in Figure 1. Survey planning includes defi ning the area to be surveyed; defi ning the expected resolution and accuracy of the point cloud; selecting the scanner to be used; choosing optimal locations for the scanning stations; and choosing types of targets for registration and georeferencing, places for their location and their geometric confi guration.
In the fi eld, the operator must fi rst set up the instrument at the defi ned location, defi ne the 3D section of the scene to be captured and select the necessary options in the software (e.g. sampling resolution, accuracy mode, number of scans, fi rst or last pulse
measurements). Once scanning has started, the operator can follow the process on the screen of the TLS or remotely on a laptop, mobile phone or tablet. When the scanning is complete, the data is saved in a specified project file. As mentioned earlier, large objects need to be surveyed from several locations. The scans obtained at each station are referenced to the instrument-fixed, in other words internal coordinate system of the scanner. This is unnecessary. This procedure is called registration, following which the registered scans are combined into a single dataset. After this, the point cloud can be georeferenced and further 3D models and views can be created.
SURVEYED BUILDING
The surveyed building presented in the article is located in the vicinity of Frankfurt, Germany. The building consists of a basement, ground floor and five floors (Figure 2).
Scanning using TLS was performed to obtain a 3D model of the building for the needs of reconstruction (to design a new interior and exterior) and as a basis for the development of a BIM (Building Information Model).
LASER SCANNER
The laser scanner used for surveying was the Trimble X7. DATA PROCESSING
A total of 111 scans were performed, with the number of scans per floor given in Table 1.
After collecting data in the field, the scans were imported into the Trimble Business Center software and registered (Figure 3).
Based on the obtained point cloud, the 3D modelling of the facade and all the surveyed floors of the building was performed using Revit software. The result of 3D building modelling is a .ifc (industry foundation classes) file. Figure 4 shows the whole 3D model of the building, while Figure 5 shows the part of the 3D model that represents the interior of the building. also increasing in importance in many areas of life and work, and it is only a matter of time before we see the further expansion and development of geodetic methods that incorporate these modern concepts.
FURTHER READING
CONCLUSION
• M. Rashidi, M. Mohammadi, S.S. Kivi, M.M. Abdolvand, L. Truong-Hong and B. Samali, A decade of modern bridge monitoring using terrestrial laser scanning: Review and future directions, Remote Sens., vol. 12, no. 22, pp. 1–34, 2020. • C. Wu, Y. Yuan, Y. Tang and B. Tian, Application of The impact of the development of technology Terrestrial Laser Scanning (TLS) in the Architecture, and software in recent decades is evident and Engineering and Construction (AEC) Industry, Sensors, has consequences for geodetic engineering vol. 22, no. 265, 2022. and the 3D modelling of buildings. TLS is a • T. Kuzmi ´c, M. Markovi ´c, M. Batilovi ´c and V. Bulatovi ´c, modern method that is increasingly being Application of Terrestrial Laser Scanning Technology used to create 3D building models. This for the Purpose of Creating 3D Models of Objects, FIG technology enables the collection of large e-Working Week 2021 – Smart Surveyors for Land and amounts of high-density and detailed data in a Water Management – Challenges in a New Reality, much shorter time and with fewer resources. 21–25 June 2021. The data collection and processing are largely automated and allow for additional analyses, updates and changes to spatial data. Finally, artificial intelligence and virtual reality are ABOUT THE AUTHORS Marko Markovi ´c is assistant professor at the Faculty of Technical Sciences (FTS), University of Novi Sad (UNS), Serbia. He received a PhD in geodesy from the FTS in 2018. His current research interests include engineering geodesy, geographic information systems, digital photogrammetry and laser scanning.
Mehmed Batilovi ´c is assistant professor at the FTS, UNS, Serbia. He received a PhD in geodesy from the FTS in 2021. His areas of interest are deformation measurements and deformation analysis of building structures, optimization of geodetic networks, engineering geodesy and laser scanning.
Tatjana Budimirov is a teaching assistant at the FTS, UNS, Serbia. She received an MSc in geodesy from FTS in 2016. Her research interests are GNSS surveying, the Internet of Things and laser scanning. Her latest research focuses on the GNSS PPP method and its positioning errors.
Figure 3: Registered point cloud of scanned building.
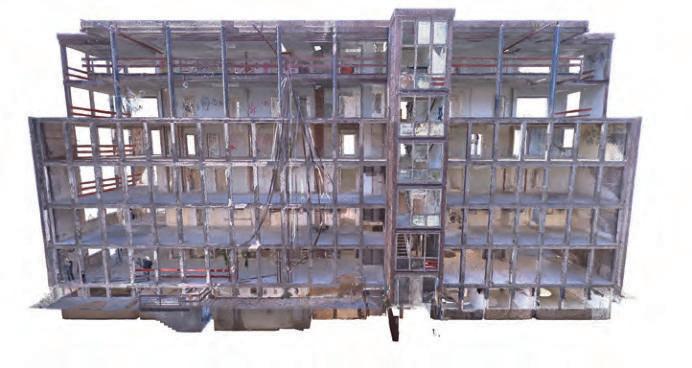
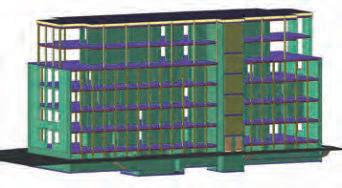
A VISUAL GUIDE
Representing 3D Point Cloud Data
The 3D data jungle in today’s computerized ecosystem – primarily populated by reality capture devices – presents forms that vary in both structure and properties. As a kind of visual guide, this article provides an overview of the main 3D data representation methods – 3D point clouds, meshes, parametric models, depth maps, RGB-D, multi-view images, voxels and more – to help users understand the main differences and choose the best method for their specific applications.
3D POINT CLOUDS
A point cloud is a set of data points in a three-dimensional coordinate system defined by X, Y, Z coordinates. Reality capture devices and techniques such as photogrammetry and Lidar usually enable the external surface to be described in its three dimensions by a generated point cloud. Point clouds are simple yet efficient 3D data representations. While fast rendering and transformations make a direct inspection of a point cloud handy, they are often not perfectly integrated into commonly used 3D applications with sophisticated functions. However, recent developments show a trend towards better support, even within pure mesh-based rendering platforms such as the Unreal 5 game engine. Still, a standard process is to derive a mesh using a suitable surface reconstruction technique.
3D MODELS
Almost all 3D models can be divided into two categories: 1) Solid: These models define the volume of the object they represent. Solid models are mainly used for engineering and medical simulations and are usually built with constructive solid geometry or voxels assemblies. 2) Shell or boundary representations (B-Reps):
These models represent the surface, i.e. the boundary of the object, not its volume.
Almost all visual models used in reality capture workflows, games and film are boundary representations. Solid and shell modelling can create functionally identical objects. Differences between them are primarily variations in how they are created and edited, conventions of use in various fields, and differences in types of approximations between the model and reality. 3D models can describe a point cloud based on three main strategies: constructive solid geometry, implicit surfaces (+parametric modelling), and B-Reps. The most common 3D models are B-Reps such as 3D meshes.
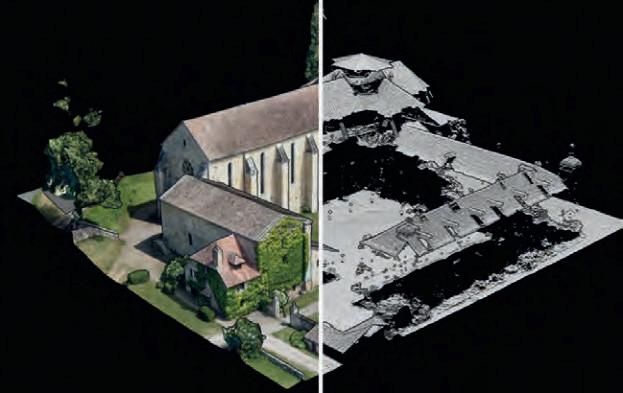
3D MESH
A mesh is a geometric data structure that allows the representation of surface subdivisions by a set of polygons. Meshes are mainly used in computer graphics to represent surfaces, or in modelling to discretize a continuous or implicit surface. A mesh is made up of vertices (or a vertex), connected by edges making faces (or facets) of a polygonal shape. When all faces are triangles, this is called triangular meshing. Triangular meshing is most common in reality capture workflows.
Quadrilateral meshes are often obtained through mesh optimization techniques to achieve more compact representations. These meshes are based on the boundary representation, which depends on the wireframe model (3D lines simplify the object; a line represents each object’s edge in the model). The boundary representation of 3D models is mainly composed of two parts: the topology (organization of elements) and the geometry (surfaces, curves and points). The main topological items are faces, edges and
vertices. See Figure 3 for schematization of a simple B-Rep for a cube.
Meshes are a great way to make the geometry of a point cloud explicit, and often enable a significant reduction in the number of points needed as vertices. Besides that, they give a sense of the relationship between objects through the connectivity between the faces. However, meshing is an interpolation of the base point cloud geometry and can only represent the data to a certain degree, linked to the complexity of the mesh. There are many strategies for meshing a point cloud, but they often require users to have some theoretical background and to know which parameters to adjust for an optimal result.
VOXEL-BASED MODELS
A voxel can be seen as a 3D base cubical unit that can represent 3D models. Its 2D analogy is the pixel: the smallest raster unit. A voxelbased model is a discretized assembly of ‘3D pixels’ and is most often associated with solid modelling. In the case of point cloud data, one can represent each point as a voxel of size X to obtain a ‘filled’ view of empty spaces between points. Voxels are mainly associated with data structures such as octrees and make it possible to average a certain amount of points per voxel unit, depending on the level of refinement needed (see Figure 4).
While this is practical for rendering and smooth visualization, it approximates the initial geometry coupled with aliasing artifacts and can give false information if the volume information is used incorrectly. However, the very structured grid layout of voxel models can be convenient for processing tasks such as classification through 3D convolutional neural networks.
PARAMETRIC MODEL (CAD)
‘Parametric’ is used to describe a shape’s ability to change by setting a parameter to a targeted value that modifies the underlying geometry. This is very useful if you want to model ‘walls’ merely by setting up their orientation, length, width and height, for example. So parametric modelling is suited to using computing capabilities that can model component attributes with realworld behaviour. Parametric models use a composition of feature-based, solid and surface modelling to manipulate the model’s attributes. One of the essential features of parametric modelling is that interlinked attributes can automatically change values. In other words, parametric modelling allows
Figure 2: From top to bottom – the vertices of the mesh, the edges linking the vertices together, the faces formed by vertices and edges (primarily triangular).
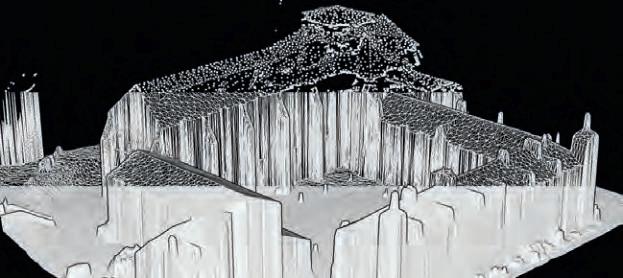

the definition of entire ‘classes of shapes’, rather than just specific instances. However, this often demands the underlying point cloud geometry to be structured very smartly to break down the model entity into sub-entities (e.g. segments) aggregated in classes.
Parametric models are time-consuming to create but can add a lot of value to the 3D point cloud data, through massive semantic enrichment and additional triggers on the relations between objects constituting the scene.
DEPTH MAP
The depth map is one type of raster-based point cloud representation. A depth map is an image or an ‘image channel’ containing information relating to the distance of the points constituting the scene from a single viewpoint. A depth image visualizes the distance of objects from the camera based on the colour of the pixels. Although most geospatial professionals are used to working with RGB images, the simplest form of expressing the depth is to colour-code intensity values on one channel, with bright pixels having the highest values and dark pixels having the lowest values.
This form of point cloud representation is sufficient if superficial information is needed linked to a known point of view. This is the case for autonomous driving scenarios, for example, in order to quickly map the environment at each position through a 360-degree projected depth map. However, the major downside is that it is only possible to work with 2.5D data rather than 3D data, since a depth map cannot represent two different values for one line of sight.
RGB-D
RGB-D data provides 2.5D information about the captured 3D object by attaching 2D colour information (RGB) to the depth map. Besides being inexpensive, RGB-D enables effective representations of 3D objects for various tasks such as identity recognition, pose regression and correspondence. The number of available RGB-D datasets is vast compared to other 3D datasets such as point clouds or 3D meshes, and RGB-D is the preferred way of training deep learning models through extensive training datasets.
PROJECTIONS
Projecting 3D data into another 2D space is another representation of raw 3D data where the projected data encapsulates some of the key properties of the original 3D shape. Multiple projections exist where each converts the 3D object into a 2D grid with specific information. Projecting 3D data into the spherical and cylindrical domains has been typical for representing the 3D data in such a format. Such projections help the projected data be invariant to rotations around the principal axis of the projection and ease the processing of 3D data due to the Euclidean grid structure of the resulting projections. However, such representations are not optimal


