17 minute read
High-resolution Topography of a World Heritage Cave

TLS and SfM Survey of The ochTiná aragoniTe KarST PhenoMenon in SLovaKia
The Ochtiná Aragonite Cave in Slovakia is a world-famous karst landscape of significant geological, geomorphological and mineralogical value. It represents a combined labyrinth consisting of parallel tectonically controlled halls and passages. The dissected and irregular morphologies of the cave were surveyed using terrestrial laser scanning (TLS) and structure-from-motion (SfM) digital photogrammetry. The new detailed map, sections and 3D model create an innovative platform for a more detailed study of the morphology and genesis of this unusual cave, including for its environmental protection and use in tourism.
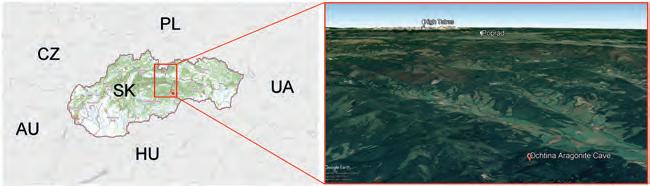
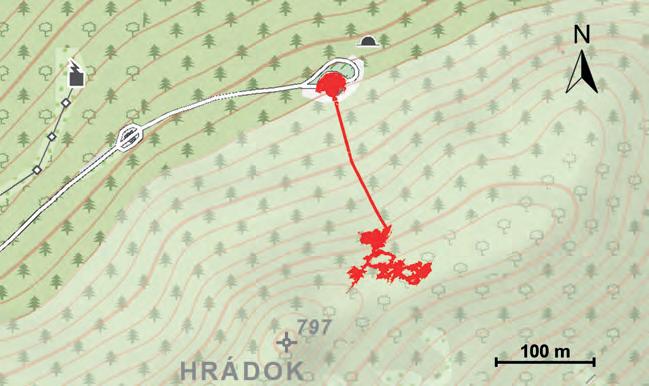
The Ochtiná Aragonite Cave is located on the north-western slope of Hrádok hill (809m) in the Revúcka vrchovina mountains in southern Slovakia (Figure 1). It was discovered accidentally during an excavation of the exploratory adit in 1954. Since 1995, it has been part of the Caves of Aggtelek Karst and Slovak Karst UNESCO World Heritage site. It is famous and significant not only for its rich and rare aragonite decoration, but also because of its specific morphologies. However, the complex morphology of this cave, especially of its medium-scale and small-scale morphologies, is not sufficiently visualized on the existing speleological maps. Classic surveying and mapping of bedrock surfaces with such irregular and rugged morphologies is much more time-consuming and mostly less precise. For this reason, TLS and SfM photogrammetry were used for the new geodetic surveying and 3D mapping of the cave.
Figure 1: Location of the Ochtiná Aragonite Cave in Slovakia. (Image courtesy: GKÚ Bratislava, Google Earth)
HigH-resolution survey
Terrestrial laser scanning and SfM digital photogrammetry can be considered as a suitable technology for non-contact measurement of spatial coordinates, 3D modelling and visualization of complex underground structures. The high speed of surveying, accuracy, higher productivity versus common geodetic methods, significant shortening of fieldwork and automatic data processing into digital models make this technology almost irreplaceable in rapid speleological mapping. Another important advantage is the use of an own-source laser beam, which ensures hassle-free surveying in poorly illuminated or non-illuminated underground spaces.
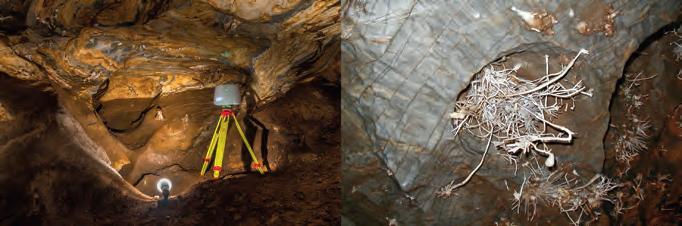
During the TLS survey, a Leica ScanStation C10 scanner (Figure 2) was used to scan cavities, ponds, tourist paths as well as aragonite decoration with high resolution and
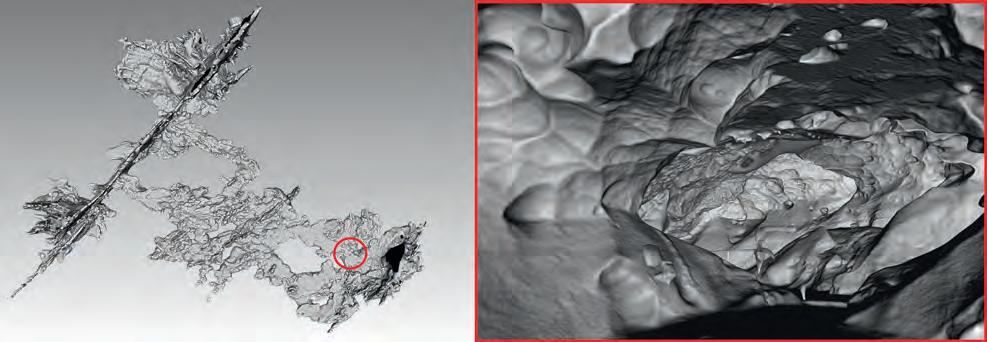
Figure 3: 3D model of the cave based on TLS.
Figure 4: The cave position within the base map from the ZBGIS Map client. (Image courtesy: GKÚ Bratislava)
detail. Overall, more than 121 million points were measured using 54 survey stations. The horizontal and vertical resolution on the scanned surface was 20 × 20mm.
Additionally, the SfM method of digital close-range photogrammetry (one of the most advanced methods of processing photogrammetric images) was implemented to achieve high-resolution mapping of selected morphologic structures. As conventional photogrammetric methods require a set of identical points present on photographic images with their known spatial position, camera positions and scene geometry in the SfM method are reconstructed simultaneously based on the automatic identification of characteristic matching features.
All images were captured by a DSLR Pentax K-5 digital camera with a Pentax SMC DA 15mm lens. The appropriate illumination of the image surfaces was ensured by spotlights along the tourist path, so no additional lights were needed. However, due to the spotlights, individual camera stations had to be carefully chosen to avoid blocking the source of the light and creating shadows on the surface. In total, 62 images were captured, from which the final point cloud containing 23 million points was generated in Agisoft PhotoScan software.
results
Based on the findings from the new TLS survey of the cave, its total surface area is 1,335m2. The cave volume is 4,424m3 and the circumferential surface of the cave body is 7,064m2. The largely irregular and uneven circumferential surface of the cave body relates to numerous medium-scale and smallscale phreatic and epiphreatic morphologies.
In terms of gross morphology and ground plan pattern, the cave is composed of parallel tectonically controlled passages and halls that are interconnected by smaller transverse conduits of phreatic and epiphreatic morphology. There are numerous ceiling cupolas and smaller spherical cavities, a flat ceiling, inwardly inclined smooth facets and spongework-like hollows. The whole cave represents a labyrinth with a high degree of connectivity.
3D moDel of tHe cave
Computer graphics and IT advancements are increasingly creating new and better conditions for digital data processing. In this case, the triangulated irregular network (TIN) method was applied. It was not always possible to use all the scanned points with the original point density for the final surface modelling. Therefore, the density of points was reduced to a defined distance of 100mm between points to generate a homogeneously composed and reduced point cloud. This was used to create the final TIN model of the cave (Figure 3).
The spatial localization of the survey into the appropriate coordinate system and vertical datum enables the connection of the final 3D model with the surrounding digital terrain model (DTM) and accurate determination of its positional and vertical span (Figures 4 and 5). In addition, such a digital model can then be used to derive spatial relationships with the corresponding DTM (or another nearby underground structure) for further geo-exploration (geophysical surveys, civil engineering works, etc.). The 3D model illustrates that the Ochtiná Aragonite Cave consists of a striking linear passage formed along a steep fault, and a longer irregular spongework labyrinth of passages and halls.
Additionally, some of the specific morphologies of the Ochtiná Aragonite Cave were imaged and photogrammetrically processed. A high-resolution 3D model of these different morphologies is necessary for a more detailed study of their origin (Figure 6).
The comparison of both technologies confirms that the significantly denser point cloud from photogrammetry provides a more detailed and smoother course of the model surface of the selected cave wall than the laser scan data. Additionally, laser scan data reveals more significant deviations at sharper edges and transitions, which is also the result of the lower density of the scanned data.
conclusions
Surveying the Ochtiná Aragonite Cave using terrestrial laser scanning provided the most actual and precise map of this very remarkable cave. This map, in several sectors refined by surveying with digital photogrammetry, is an important tool for a more detailed study of cave morphology – including its structural and tectonic control, as well as medium-scale and small-scale solution forms. Moreover, terrestrial laser scanning made it possible to determine the basic surface and volumetric values of the cave. Both technologies have specific requirements, advantages and disadvantages (in terms of accuracy, financial demands and practical issues when working – especially in narrow cave spaces and when illumination of the surface is necessary). Therefore, the combination of these methods has been shown as the most suitable for detailed mapping of complex cave spaces. It enables all of their specific features to be captured so that comprehensive data on the overall morphology can be created in the most accurate and detailed way.
Since the Ochtiná Aragonite Cave has opened to the public, the results of this new survey can now also be used to address some other issues related to human impact on the cave environment, such as microclimatic changes due to the movements of visitors in different parts of the cave and their negative influences on the fragile aragonite formations.
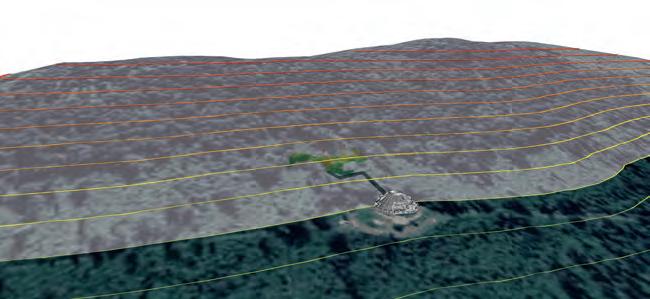
Figure 5: 3D model over the local DTM.

furTher reading
Pukanská, K.; Bartoš, K.; Bella, P.; Gašinec, J.; Blistan, P.; Kovanicˇ, l’. surveying and High-resolution topography of the ochtiná aragonite Cave Based on tls and Digital Photogrammetry. Appl. Sci. 2020, 10, 4633. https://doi.org/10.3390/app10134633
MuLTiMedia
the point cloud from the tls survey: http://ugkagis. fberg.tuke.sk/potree/ochtinska_aragonitova.html
acKnowLedgeMenTS
this work was supported by the grants no. 1/0146/19 (VeGa) and no. 004tuKe-4/2019 (KeGa) funded by the Ministry of education, science, research and sport of the slovak republic. the authors would like to thank the slovak Caves administration for giving permission for 3D laser scanning, digital photogrammetry and geomorphological research in the ochtiná aragonite Cave.
abouT The auThorS
Karol Bartoš is an assistant professor at the Institute of Geodesy, Cartography and GIs, technical university of Košice, slovakia. His research fields are digital photogrammetry technologies, terrestrial laser scanning and remote sensing, and their use in the creation of spatial models of underground and surface objects and the mapping of natural and anthropogenic objects and phenomena.
Katarína Pukanská is an associate professor at the Institute of Geodesy, Cartography and GIs, technical university of Košice, slovakia. Her research interests cover laser scanning and digital photogrammetry in creating spatial models of surface and underground objects, digital terrain models and mapping, and using these technologies in special industrial applications.
Pavel Bella is a geomorphologist and geographer, associate professor at the Department of Geography, Catholic university in ružomberok, and head of the Cave Protection Department at the slovak Caves administration in liptovský Mikuláš. His research activities cover karst geomorphology, speleology, geochronology and environmental geography.
Expedition Team Reveals Deepest Points in Indian and Southern Oceans
As part of the Five Deeps Expedition (FDE) team, scientists from Caladan Oceanic LLC and the British Geological Survey (BGS) have for the first time surveyed in detail the deepest reaches of the Indian Ocean and the Southern Ocean.
Prior to the FDE, the deepest parts of some oceans were relatively well known, such as Challenger Deep in the Mariana Trench, but others had multiple ‘deeps’ where several contenders challenged for the deepest point in that particular ocean. Data published in Geoscience Data Journal now shows the deepest point of the Indian Ocean at 7,187m within the Java Trench, and the deepest point of the Southern Ocean at 7,432m within the South Sandwich Trench.
MultibeaM Sonar Survey of Deep-Sea trencheS
Located just north of the Antarctic continent, the South Sandwich Trench spans both the Southern and Atlantic oceans. It is the only sub-zero hadal zone (deeper than 6,000m) in the world. The FDE survey produced the most accurate mapping of the South Sandwich Trench to date, using a modern multibeam sonar system. The new survey has shown that the deepest point of the trench is Meteor Deep at 8,265m, located within the waters of the Atlantic Ocean. The recently named Factorian Deep, located at the southern end of the trench, is 7,432m deep.
The Java Trench, in the eastern Indian Ocean, is more than 4,000km long. In April 2019, the FDE undertook the first crewed descent to the absolute bottom of the trench (7,187m). This mission also produced the first British person to descend into the hadal zone and the deepest dive by a British citizen: Prof Alan Jamieson. Since then, he and fellow Brit John Ramsay have dived to the deepest points of the Mariana Trench during the FDE, thus beating that record.
full-ocean Depth creweD SubMerSible
The submersible DSV Limiting Factor and the three supporting free-fall lander systems were fitted with specialist sensors that recorded data during both their descent to the sea floor and their return journey to the ship, thus playing a crucial role in mapping the deeps. The data was used to calculate full-ocean depth sound velocity profiles to correct the multibeam bathymetry data. This work was truly unique, since many offshore expeditions do not have the time or technology to send these sensors to the sea floor and therefore rely on sound velocity models rather than direct measurements.
“The global Five Deeps Expedition allowed us a unique opportunity to accurately map some of the most remote and deepest places in the world, and to validate these depths with measurements collected by the submersible and support landers,” said Cassandra Bongiovanni, chief hydrographic surveyor for the FDE and lead author of the study. “Access to state-of-the-art full-ocean depth technology allowed us to map an area equivalent to continental France in only ten months. Around 61% of where we went had never been mapped using modern technology,” she added.
“Initiatives such as the Five Deeps Expedition allow us to fill in knowledge gaps and reveal for the first time the seascape of large underwater features like subduction trenches. Collecting detailed bathymetry data allows us to further understand past and current processes, and to explore links between geology and the biodiversity of these ultradeep environments,” commented Heather Stewart, BGS marine geologist.
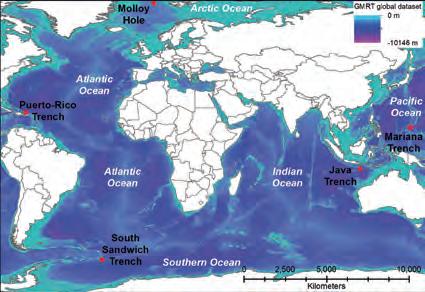
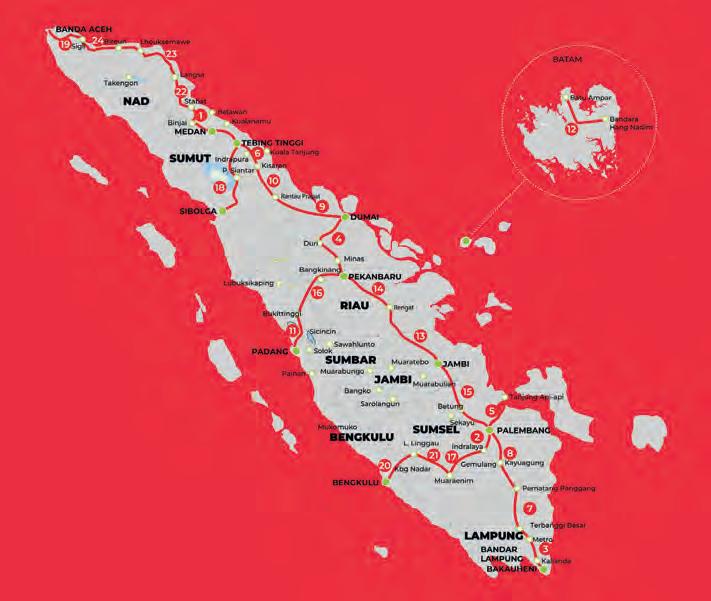
Map showing the locations (red dots) of the deepest points in each of the world’s five oceans (Atlantic, Southern, Indian, Pacific and Arctic). Global bathymetry from Global Multi-Resolution Topography Synthesis (GMRT). (Source: BGS)
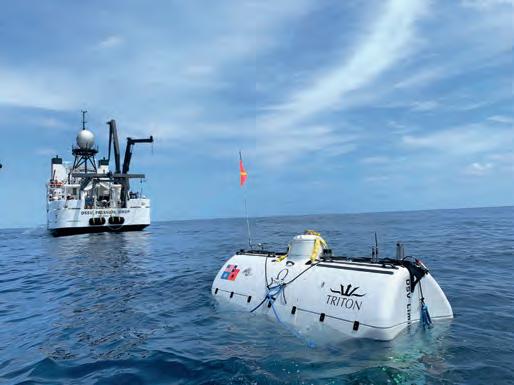
The submersible DSV limiting Factor played a crucial role in mapping the deeps. (Image courtesy: Triton Submarines)
Benefits of site monitoring with a uaV and 3dsurvey software
Construction sites and, especially, demolition sites are often challenging environments for surveyors. Nevertheless, effective project management and financial control depend on accurate and timely information about the volumes of materials which have been placed, relocated and removed. Conventional surveys to obtain this information are slow, labour-intensive, expose surveyors to danger and can disrupt site operations. Photogrammetry using an unmanned aerial vehicle (UAV or ‘drone’) and the 3Dsurvey software suite offers an efficient, cheaper and safer alternative.
Around a decade ago, three surveyors in Slovenia were building UAVs and developing 3D software to use for their own projects. In 2015 they set up 3Dsurvey to supply their comprehensive software suite for mapping and image processing to other surveyors. As Tomaž Izak, CEO and surveyor, puts it: “I just wanted to spend more time with my wife and kids. Now, my software is helping surveyors all over the world. They love 3Dsurvey because it’s tailormade for them by people who have been in their shoes, in the field, in the mud and dirt, and who know exactly what a modern digital surveyor needs. Our software is also very affordable.”
Case study: a demolition site
The demolition of a large power station in Germany required effective work progress monitoring, identification of the materials on site, and determination of volumes. The site covered approximately 40 hectares and the buildings had a combined volume of approximately one million cubic metres. Conventional surveying methods would have been extremely time-consuming, exposed the surveyors to a hazardous environment and would not have provided sufficiently detailed data.
The surveying team decided to undertake regular photogrammetric surveys using a UAV (DJI P4RTK), a GNSS receiver (Emlid Reach RS2) and the 3Dsurvey software. The initial survey of the wider area (approx. 2,000 images) was followed by monthly surveys of the demolition area (approx. 1,000 images) to determine progress. For each survey, the positions of several ground control points (GCPs) were determined using the GNSS receiver. Using a UAV with RTK significantly reduced the number of GCPs required. For applications demanding less accuracy, surveys can even be done without any GCPs. Surveyors can use any convenient type of GCP, or dedicated 3Dsurvey GCP targets which are automatically recognized by the software, to save even more time.
The flight was prepared using 3Dsurvey Pilot, the free app for planning flights with DJI UAVs. If another make of UAV had been used, the flight could have been planned using its own flight planning software.
image proCessing
This project used only UAV photographs, but for other applications these can be combined with images from ground-based cameras, Lidar and sonar. After the flight, the photographs were imported into the 3Dsurvey software and linked to the GCPs using the Orientate function. Next, the software generated the point cloud, full 3D mesh, digital surface model (DSM) and true orthophoto. The resolution of the images was high enough for effective identification of the materials to be removed from site.

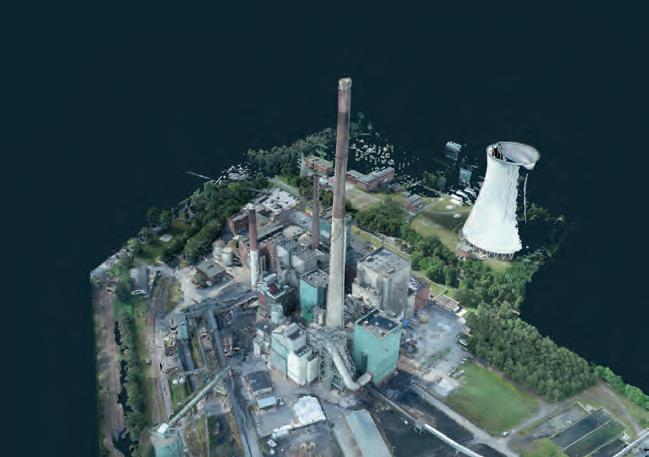
Figure 2: 3D mesh view.

Figure 3: Orthophotograph with CAD drawing overlaid.
measurement and analysis
Once the mesh had been created, features such as buildings and heaps of material could be defined and named, and their volume or area calculated. This made it particularly easy to report on the progress of the demolition and waste volumes. 3Dsurvey could also have generated contour maps and site profiles at user-specified intervals. The software has basic CAD functions to draw areas and volumes, which can be exported in DXF and other formats. Undertaking both photogrammetric processing and analysis and measurement within the same software package saved time and costs and reduced errors.
data presentation and export
The information was presented to the client in a range of formats: a video file with a simulated flight around the site, 2D site plan, 3D model and numerical information to track progress. The 3Dsurvey package exports data in a wide range of file types, such as PDF, DXF, JPEG and TIFF, KMZ for Google Earth, various mapping and GIS formats, and TXT. The client could open the original project file using the free 3Dsurvey Viewer, enabling them to choose from a range of views.
x-ray funCtion looks through roofs
3Dsurvey has a unique feature: the X-ray function. This uses data from a number of photographs taken at different angles to mark wall positions on an orthophotograph, irrespective of the roof overhang. In this way, the volume of the buildings can be determined accurately and drawn with the built-in CAD function. This avoids the need to survey the positions of building corners using conventional methods. The X-ray function can save a lot of time and effort, especially in complex and challenging settings such as this demolition site.
other appliCations
Historic buildings and city centres are documented for conservation and planning reasons. Landslides and other active geological features need to be monitored regularly, with great accuracy and without exposing surveyors to danger. The scene of road traffic accidents must be recorded in detail before the road can be opened to traffic again. This often leads to traffic delays when using conventional methods and important details may be overlooked due to time pressure. In all these cases, software such as 3Dsurvey can use input from a range of sources – such as UAV and conventional photographs, laser scans, etc. – to produce digital surface and terrain models, true orthophotographs and basic CAD drawings. These deliverables support a range of applications and can be processed with standard GIS and CAD software. Such photogrammetric surveys take much less time in the field than conventional surveys and offer the surveyor great flexibility back at the office. If the client requests additional data, beyond the original brief, then the surveyor can respond quickly, often without a further visit to the site.
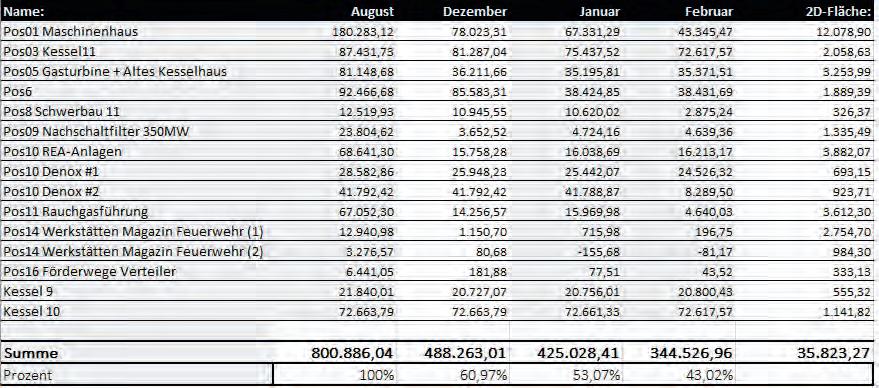
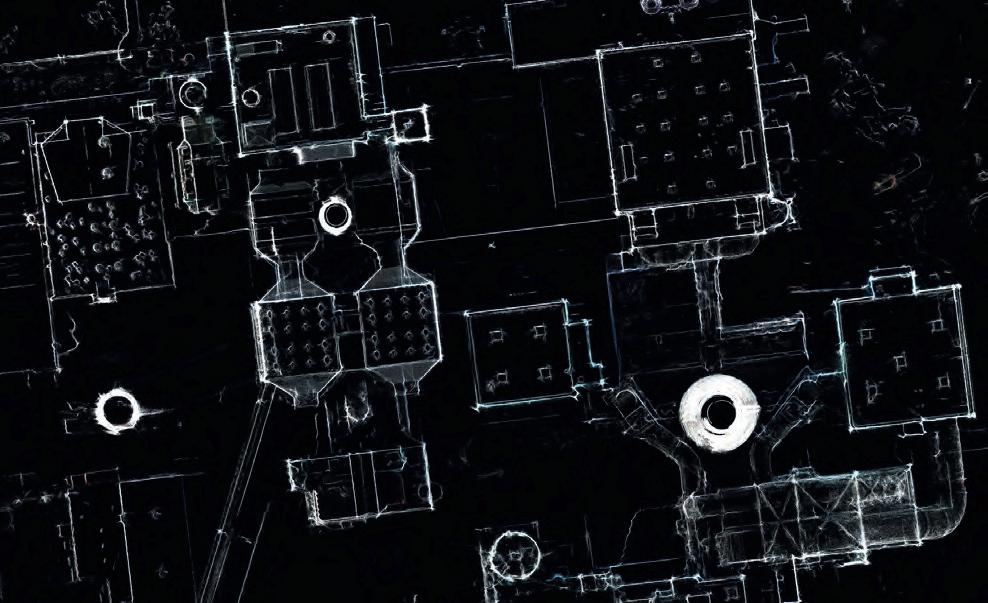
Figure 5: X-ray view showing the wall positions.
The software has also been used to create 3D models of building interiors and process plants, based on photographs taken with a handheld camera. This makes it possible to acquire the data quickly and at low cost, with a minimum impact on site operations. The models can be marked up with the position of piping and other services to support maintenance planning over the lifetime of the structure.
Open-cast mines, quarries and bulk ore terminals present dangerous environments where there is a need to measure large volumes of material safely and efficiently, without a surveyor walking around the site. This makes them a perfect application for UAV photogrammetry. When surveying a quarry where materials are excavated from a flooded area, 3Dsurvey can combine bathymetric sonar data with UAV photographs. This results in a unified 3D model of the site, showing both above-ground and underwater features.
liCensing and support
The 3Dsurvey software has a relatively low price and is available under a perpetual licence, monthly subscription, and hourly access through GeoCloud, to cater for the needs of both regular and occasional users and surveying businesses of any size. New users also receive one-to-one support online or by telephone, to help them optimize their projects.

The software is supported by extensive tutorial videos and datasets, and dozens of case studies on the developer’s website as well as a recently created user forum. As the package was designed by surveyors for surveyors, the 3Dsurvey workflow feels very natural to most users.
ConClusion
On a demolition site, the combination of a UAV, GNSS receiver and 3Dsurvey software made it possible to complete the initial map, drawings and photographs of the site quickly and safely. This was followed by regular UAV flights to report on the progress of the project. The software provided a range of accurate and valuable project management information at relatively little effort and cost.
More inforMation
www.3dsurvey.si


