
10 minute read
BUSINESS

from Issue #1351

The Roles of Russia and Ukraine in Georgia’s Food and Energy Security
Advertisement
PMC RC stands fi rmly with Ukraine, supports its sovereignty and territorial integrity, and condemns Russia’s ongoing military aggression. At this horrible time, we will of course maintain our long-standing commitment to support Ukraine’s democratic progress. While the most devastating outcome of this war is the humanitarian catastrophe of Ukraine and the destroyed lives of people, it is also essential to discuss the ramifi cations of this war that are being felt worldwide. In this bulletin, we discuss threats to the food and energy security of Georgia amid Russia-Ukraine War.
Russia and Ukraine are prominent players in the global trade of food and agricultural products. Pertinently, wheat exports from Russia and Ukraine accounted for 30% of the global wheat market in 2021. Furthermore, in 2021 exports from both countries combined represented 55% of the world’s sunfl ower oil supply1. In terms of energy provision, Russia supplies 11% of the world’s oil, making it the world’s largest exporter of this precious commodity. Meanwhile, Russia is the top gas exporter globally as well, supplying 19% of the world’s natural gas. Thus, Russia is a major player in the global energy market, with Europe in particular being highly dependent on Russian gas and oil2 .
FOOD SECURITY
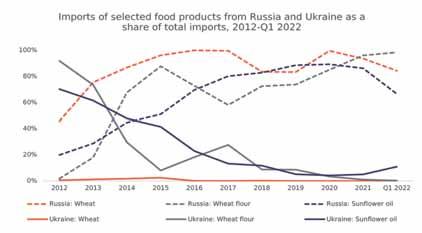
Considering the roles of Russia and Ukraine in the global food market and the high dependence of Georgia on imports of essential goods it is worth analyzing Georgia’s reliance on Russia and Ukraine with regard to major food products. Therefore, in this issue, we analyze the top three essential food products for which Georgia has the highest dependence on imports from Russia and Ukraine. In 2018, imports of wheat from Russia and Ukraine accounted for 75.3% of the total domestic supply for Georgia, while in the same year imports of sunfl ower oil from those two countries accounted for 92.2% of the total domestic supply of sunfl ower oil in Georgia3 .
Observing the dynamics of imports of wheat from Russia and Ukraine throughout the last decade reveals that imports of wheat from Ukraine has represented only a minuscule proportion of total wheat imports to Georgia (annual average of 0.6% of total wheat imports) and Russia (86.1%) has been the main source of imported wheat by a considerable margin. This can be explained by the combination of the relatively low price of wheat from Russia (with an average annual price of $0.24/KG), compared to Ukraine ($0.32/KG) and the relatively low transportation costs of importing from Russia. From 2012 to 2017, Russia’s share of wheat imports increased steadily, followed by a drop in 2018-2019 due to low crop yields and increased prices in Russia. At that point, Georgia began to embrace Kazakhstan as an alternative source of wheat imports4. Since then, the prices of imported wheat from Russia have also shown a signifi cant increase, peaking at $0.33/KG in Q1 2022, which could be attributed to the combination of the imposed export tariffs on wheat by Russia since June 20215 and the economic shock of the war in Ukraine. However, it must also be mentioned that the share of Russia is still retained at a high level, reaching the maximum of 99.5% in 2020.
On the other hand, Ukraine represented the main source of wheat fl our imported into Georgia in 2012, amounting to 91.8% of total wheat fl our imports. However, it was then substituted by Russia, largely due to the relatively low average prices of imported wheat fl our from Russia throughout the periods of 2013-2015 and 2018-2021. Overall, the share of Russia in total wheat fl our imports to Georgia on average has been increasing throughout the last decade, reaching 98.3% of total wheat fl our imports in Q1 2022. It must also be mentioned that in 2021, compared to 2020, the absolute volume of wheat imports from Russia declined signifi cantly by 18.6%. Meanwhile, wheat fl our imports have shown a drastic increase (YoY increase of 343.6%) in the same year. Therefore, Russian wheat fl our imports mostly substituted the Russian wheat in response to the barriers imposed on the wheat trade by Russia.
Similar to the situation for the import of wheat fl our to Georgia, the share of Ukraine in total sunfl ower oil imports has also been declining throughout the last decade, while Russia’s share increased steadily from 2012 to 2020, reaching 89.2%. Again, this could also be explained by the relatively low prices of imported oil from Russia (on average, throughout the last decade the price of sunfl ower oil was USD 1.12/KG) compared to Ukraine (1.18). It must also be mentioned here that despite the decreasing prices of Russian exports, the share of sunfl ower oil imports from Russia declined to 66.4% of total sunfl ower oil imports by Q1 2022. This could be attributed to a combination of the economic shock of the war in Ukraine and imposed export tariffs on sunfl ower oil by Russia6 .
The analysis of the sum of imports throughout the last decade shows a similar picture of high dependence on Russia and a high concentration of the import market. This is especially vivid in the case of wheat, as 81% of wheat imports came from Russia, followed by Kazakhstan with 16%. Most of the wheat fl our imported to Georgia also comes from Russia (75%), followed by Ukraine (18%). In the case of sunfl ower oil, 62% of imports to Georgia come from Russia, followed by Ukraine (30%) and Azerbaijan (7%).
Finally, considering Georgia’s lack of import diversifi cation in the reviewed products, some of the other major global exporters of the covered products are worth mentioning. According to FAOSTAT, in case of wheat, the USA and Canada follow Russia as the top exporting countries, however, due to logistical issues other less globally prolifi c exporters could be more relevant to Georgia, including Kazakhstan, Romania, Bulgaria, Poland, and Hungary. For wheat fl our, Turkey is among the top exporting countries, followed by Kazakhstan, both of which could be appropriate sources for the Georgian market. Apart from that, Turkey is the third-biggest exporter of sunfl ower oil after Russia and Ukraine. However, despite the attractiveness of Turkey as a trade partner, to stabilize local market conditions, it imposed temporary export restrictions in March 2022 on a number of food products, including grain and cooking oil7 .

ENERGY SECURITY
The Georgian energy market lacks its own sources and is highly dependent on imports. Indeed, Georgia’s energy production covered only 21.1% of its total energy demand in 20208. Considering that Russia is a major energy exporter across the global market but is currently being targeted by large-scale sanctions aimed at damaging its economy and limiting its role in global trade9, it is crucial to ascertain any possible threats this development may pose to the energy security of Georgia.
In 2020, Georgia imported only 6,162.8 terajoules (TJ) of electricity, while producing 40,175.3 TJ itself (meaning that only 5.3% of its domestically available electricity came from imports), which suggests that Georgia is largely capable of satisfying domestic demand for electricity. However, of the electricity Georgia imports from abroad, a considerable share comes from Russia. In 2020, 23% of Georgia’s total expenditure on energy imports went to Russia, but by Q1 2022 this had increased to 36%. From a longerterm perspective, Georgia’s dependence on Russian electricity imports has notably declined during the past decade – the share of Russian electricity imports was as high as 95% in 2013.
The domestic production of electricity in Georgia is tied to gas imports. Notably, 72.7% of electricity produced in Georgia was generated in hydropower plants (HPPs) in 2020, but 24.3% came from thermopower plants (TPPs), which rely on imported gas. Overall, natural gas accounted for almost half (47.1%) of the total domestic energy supply in 2020. Unlike electricity, for gas Georgia is almost fully dependent on imports – in 2020 Georgia, imported 99.7% (97,050.4 TJ) of its natural gas. In Q1 2022, Georgia spent $184 million on gas imports and 19% of this expenditure went to Russia. The average price of gas to have been imported to Georgia ($0.20/KG in Q1 2022) is generally lower than the average price of gas to have been imported from Russia ($0.25/KG in Q1 2022). This could be explained by the relatively low price of imports of Azerbaijani gas ($0.20/ KG in Q1 2022), which accounted for the remaining 81% of imports in Q1 2022.
Georgia also imports almost all of its oil and oil products (97.8%), though oil represents a relatively small proportion of its total energy mix (26.6% in 2020). Nevertheless, a signifi cant proportion of Georgia’s expenditure on energy imports is spent on oil. In Q1 2022, the expenditure on oil imports amounted to $244.5 million, which was 33% more than expenditure on gas imports. High expenditure on oil imports is related to high prices – the average price of oil imported to Georgia in Q1 2022 was $0.85/KG, which is four times the price of gas in the same period. Meanwhile, Russia’s share in the oil imports expenditure for Georgia was 18%, while the price of Russian oil imports ($0.83/KG) was close to the average price of total oil imports to Georgia ($0.85/KG).
The majority of coal used in Georgia is imported (82.3%), but coal makes up a very small share in the energy mix of Georgia (only 4.7% in 2020). The price of coal and, accordingly, the total expenditure on coal imports, is also low but Russia is the major exporter of coal to Georgia with 64% of Georgia’s coal import expenditure going to Russia.
Looking at the sum of Georgia’s expenditure on imports of energy products by country for the period of 2012 until Q1 2022, the energy market of Georgia is heavily concentrated. Moreover, the major player across all energy products is Azerbaijan, followed by Russia. Gas imports are the least diverse compared to other imported energy products, with 82% of gas being imported from Azerbaijan and 16% from Russia. The two major players when it comes to the heavily concentrated electricity imports are also Russia (50%) and Azerbaijan (41%). More than half of the coal imported during the covered period came from Russia (52%) and a large share (29%) also came from Ukraine. Georgia’s imports of oil and oil products are the most diversifi ed compared of all energy products. The major players in this case are Romania (25%) and Azerbaijan (21%), but Russia also accounts for 16%.
Reliance on energy imports from Russia is currently one of the most critical issues in global political decision-making. The EU recently adopted €300 billion plan (RepowerEU10) to reduce its dependence on Russian fossil fuels. One objective of the plan is to increase the share of renewables in the EU’s energy mix, which is also relevant to Georgia, considering the potential of its hydro energy resources. As for further diversifying imports of non-Russian fossil fuels, the EU plans to increase imports from other large gas exporters such as the US, Canada, and Norway, to continue cooperation with Gulf states for oil imports, while for coal the US, Colombia, South Africa, and Australia are considered the most likely countries to fi ll the gap. Likewise, it is crucial that Georgia focuses its policies toward ensuring the energy security of the country, increasing its energy independence by fully utilizing the capacity of its own energy production (especially hydro energy), and diversifying its imports.

1 Impact of the Ukraine-Russia confl ict on global food security and related matters under the mandate of the Food and Agriculture Organization of the United Nations (FAO) 2 https://www.iea.org/topics/russia-s-war-on-ukraine; https://www.oecd.org/ economic-outlook/ 3 https://ourworldindata.org/ukraine-russia-food 4 https://for.ge/view/53945/saqarTveloSi-rusul-xorbals-TandaTan-yazaxuriCaanacvlebs.html 5 https://bm.ge/ka/article/ruseti-marcvleulis-eqsportze-kvotirebis-meqanizmsaamoqmedebs-/101831 6 https://businessformula.ge/News/5613 7 https://www.fas.usda.gov/data/turkey-turkey-imposes-temporary-ban-certainagricultural-exports 8 Geostat ENERGY BALANCE OF GEORGIA, 2020. Statistical Publication 2021 9 See our publication: Assessment of the Effectiveness of Sanctions Against Russia 10 https://ec.europa.eu/commission/presscorner/detail/en/ip_22_3131


