Carbon neutral schools
FACTOR MAPS OF LOWERING CARBON FOOTPRINT IN EDUCATIONAL INSTITUTIONS REPORT
Prepared by: SCSLogopsycom
CARBON NEUTRAL SCHOOLS PROJECT

Nature of Willingness to reduce Carbon Footprint


Table of Contents 00 Part 1 01 Introduction Context Definitions 02 Carbon neutrality in the European Union 03 Carbon neutrality in schools 04 Good practices 05 Reduce our carbon footprint Methodology Part 2 01 What is a factor map? 02 Creation of the factor map 03 Validation of the factor map 04 Results 05 Conclusion 05 References
Together we can create a sustainable future. That is why, through the project activities, we are taking a small step towards sustainability for the benefit of all. What is the CO2 footprint, and why should it be reduced? Almost every action we take impacts the environment and, unfortunately, contributes to climate change. Many people probably know that the main cause of climate change is due to greenhouse gases, the most common of which is carbon dioxide (CO2). One of the most common ways to assess the environmental impact is to measure one's CO2 footprint. It shows how much CO2 is generated by our products, services and daily activities. It is true that the footprint also includes other polluting gases (e.g. methane), but when calculating these, their quantities are also converted into CO2 quantities. The main way to live more sustainably and reduce the negative impacts on the environment is to adapt our lifestyle and reduce our CO2 footprint.
A carbon footprint is left everywhere. The CO2 in the atmosphere is not only due to car or plane travel and factories - almost everything has a carbon footprint. It can be any product where natural resources, manufactured materials, equipment, and electricity have been used to produce or grow it. Similarly, if it has been transported, packaged and, after use, had to be recycled or otherwise destroyed.
1
Introduction
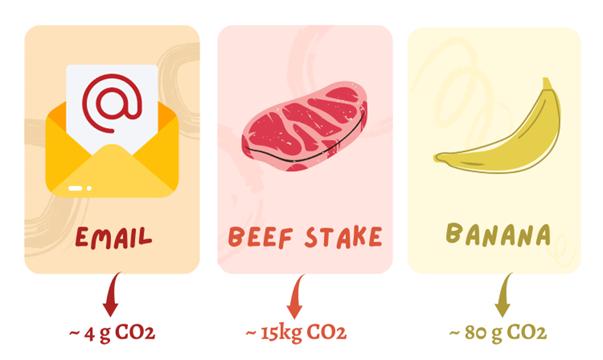
Image 1 (Corelens, Canva, s. d.)
Your smartphone, the banana or steak you eat, and the email you send have a carbon footprint. For example, the average CO2 footprint of a banana is about 80g, an email - 4g, and a beef steak - up to 15kg. Most of our CO2 footprint comes from transport, electricity used at home, food and other purchases.
About the project
The transition to a climate-neutral society is both an urgent issue and an opportunity to create a better future for all. The ultimate goal of the European Green Deal is for the EU to become the world's first 'climateneutral bloc' by 2050 (ArtSmart, 2022).
Our Carbon Neutral Schools project is an international Erasmus+ project developed by seven countries: Latvia, Finland, Austria, Italy, Belgium, Croatia, and Lithuania. The project will empower educational institutions to develop new carbon footprint reduction skills to encourage pupils to become climate-conscious citizens. Three outputs will emerge from the project:
2
FACTOR MAPS TO IDENTIFY FACTORS THAT CAN HELP EDUCATIONAL INSTITUTIONS SIGNIFICANTLY REDUCE THEIR CARBON FOOTPRINT
AN E-LEARNING COURSE ENTITLED "ORGANISATION'S LOW CARBON EXPERT"
A GREEN AMBASSADOR TOOLKIT THAT WILL TRAIN AMBASSADORS ON ENCOURAGING STUDENTS AND ADMINISTRATION TO CHANGE THEIR BEHAVIOUR
Our project will also address the priority of digital transformation by developing digital readiness, resilience and capacity. Indeed, the end result will be delivered as a fully digital tool.
About this report
Before writing this report, factor maps were produced in each partner country to identify factors that can help educational institutions significantly reduce their carbon footprint.
The factor maps produced will form the basis of the e-learning material on "How to reduce the carbon footprint of educational institutions". In the first part of this report, you will find background information on carbon neutrality, carbon footprint and all the terms that revolve around these sometimes misunderstood expressions. Following this, there will be an explanation of carbon neutrality in the European Union. We then get to the heart of the matter by discussing carbon neutrality in schools, why it is crucial to address this issue in schools, and examples of good practices already in place.
The second part of the report discusses the methodology used to create the factor maps and the expert validation process. Then, the conclusions drawn from analysing these factor maps are developed in the results section. Finally, the conclusion of this report details how the factor maps will be helpful in the future of our work.
3
Carbon neutral schools

PART 1 : CONTEXT
CONTEXT
Definitions
Carbon neutrality, climate neutrality, carbon footprint, net-zero emissions are all terms we have heard before, but not all of us know their definition. This first part of the report clarifies these terms and provides some context to our project. The first term to be defined is climate neutrality. According to the European Council, becoming 'climate neutral' means reducing greenhouse gas emissions as much as possible and offsetting the remaining emissions. This is the way to achieve a net zero emissions balance (European Parliament, 2022).
How can emissions be offset? First, by balancing these emissions so that they are equal to (or less than) the emissions that are removed by the planet's natural absorption; in simple terms, emissions are reduced through climate action (European Parliament, 2022). Often, offsetting is achieved by supporting climate-focused projects such as investing in renewable energy, energy efficiency or other clean, low-carbon technologies (United Nations Climate Change, 2021; European Parliament, 2022).

4
Image 3 (Esquivel, s. d.)
In 2021, in its "Beginner's Guide to Climate Neutrality", the United Nations still stated that offsetting is a temporary solution to help achieve climate neutrality but is not a substitute for reducing emissions. The organisation adds that once you start reducing your emissions and realise that it is not that difficult, it feels great to reduce your impact on the world (United Nations on Climate Change, 2021).
These definitions have naturally given rise to other terms that must be defined. What exactly are greenhouse gases? These are all gases that are harmful to the climate, such as carbon dioxide (CO2), methane (NH4), nitrous oxide (N20), as well as hydrofluorocarbons (HFCs), perfluorocarbons and sulphur hexafluoride (European Parliament, 2022).

Are climate neutrality and carbon neutrality two different things? The two terms are very similar and, in fact, refer to almost the same phenomenon. Indeed, while climate neutrality means reducing or offsetting greenhouse gases as much as possible, carbon neutrality is the balance between carbon emissions (CO2) and carbon absorbed by natural carbon sinks or offset emissions (European Parliament, 2022).

6
Figure 4 (Team Logopsycom, project Carbon Neutral School, 2023)
Figure 5 (Team Logopsycom, project Carbon Neutral School, 2023)
A carbon sink is any system that absorbs more carbon (CO2) than it produces. The main natural sinks are soils, forests and oceans. There are also artificial sinks, but the combination of these sinks is insufficient to absorb all the carbon emissions produced, so it is essential to reduce these emissions (European Parliament, 2022). Note that to achieve zero net emissions, all greenhouse gases must be offset, not just carbon (European Parliament, 2022).
Another important term to define is carbon footprint. According to the European Court of Auditors, carbon footprint is commonly used to refer to the overall amount of CO2 and other greenhouse gas emissions caused directly and indirectly by a product or activity or associated with the activities of an individual or organisation (United Nations Climate Change, 2021). In summary, the carbon footprint is the sum of all greenhouse gas emissions (including carbon) produced during the entire life of a product from manufacture to end of life.
Climate neutrality in the European Union
Climate change is already affecting the world, and we can see these changes in heat waves, heavy rainfall, floods or droughts.
The Intergovernmental Panel on Climate Change (IPCC) estimates that global warming must be limited to 1.5 degrees Celsius. This limit is included in the Paris agreements signed by the EU and 195 countries. Therefore, the transition to a climate-neutral society is both an urgent matter and an opportunity to create a better future for all (European Parliament, 2022).
7
Figure 6 (Fransen, 2019)
In response to these challenges, the European Commission presented the European Green Deal in 2019. The goal is for the EU to become the world's first 'climate neutral bloc' by 2050 (ArtSmart, 2022).
The European Green Deal has recognised that schools, training institutions, and universities are well placed to engage pupils, parents and the wider community in making the necessary changes for a successful transition. Therefore, in order to promote learning for environmental sustainability in the European Union, the Green Deal has set up a policy action to build a European sustainability competence framework (European Commission, 2019).
In 2022, the European Commission published the GreenComp, which identifies a set of sustainability competencies to be integrated into the curriculum to help learners develop knowledge, skills and attitudes that foster the means to think, plan and act with empathy, responsibility and care for our planet and public health.
8
"Climate neutrality is no longer a matter of choice; it is, without doubt, a necessity."
Charles Michel, President of the European Council, July 2020.
Climate neutrality in schools
Now that Europe's commitments to climate neutrality have been noted, it is important to consider the usefulness of addressing this topic in schools.
Education for implementing good habits
According to UNESCO, education, especially education targeted at children and young people, is a key aspect of the fight against climate change. It promotes changes in attitudes and behaviours among young people and helps them respond to climate change trends (ArtSmart, 2022).
Young people care about climate change
Furthermore, young people are concerned about climate change. Indeed, 96% of young Europeans agree that climate change is a "serious problem". However, only 64% of people aged 15-25 in the EU have taken action to combat it in the last six months ("Generation Climate: Young People at the Forefront of Change", 2022).
Future experts, scientists and climatologists are in school right now!
Education plays a crucial role in meeting the challenges of the climate crisis. Indeed, the climate scientists, ecologists, mathematicians, computer scientists, climate engineers, economists and climate champions needed to meet the climate challenge of the next 15 years, are all attending school or university today. Those who will become the experts will need the active and insightful support of the rest of the world's population, some of whom will be 'climate champions'. The sector also has a unique opportunity to lead by example by reducing its own carbon footprint ("Making a School Carbon Neutral", 2022).
9
"Climate champions" are individuals appointed by nations at the UN Climate Change Conference to link the work of governments with the many voluntary and collaborative actions of cities, regions, businesses and investors. These climate champions are teams whose mission is to help accelerate the race to a better, carbon-free, resilient world (UN Climate Change High-Level Champions, 2023).
Carbon neutrality is necessary not only for regions and cities but also for companies, goods and entire sectors. Economic value chains need to become much more carbon-neutral. Accelerating activities to support carbon neutrality through school education will increase competitiveness and boost the region's overall economy. Through carbon neutrality education, schools can teach students to evaluate various evidence and draw their own conclusions to become conscious citizens. More is needed to teach students the science of climate change; they also need to understand how organisations and individuals face large-scale challenges and how they fit into the bigger picture (ArtSmart, 2022).
Implementing good practice among students is more than just teaching them what to do or why it is important. The school must also act as a role model and set a good example by reducing its own ecological footprint.

10
Figure 7 (1xpert, Canva, s.d)
Good practices
Changing the way public institutions, such as schools, operate takes work. However, it is necessary, and some have already implemented innovative practices that reduce the carbon footprint of their institution. This section provides examples of good practices to inspire schools to make these changes.

In Belgium, the GoodSchoolDigitool platform helps schools to collect data on their consumption: waste, energy, water, mobility and food. The figures are then presented in a simple, fun, and student-friendly way: how many cows (weight) of residual waste are collected annually in the school? The teacher and pupils can collect the data together, analyse it and then implement sustainable actions adapted to the school. This is an innovative monitoring platform. The data is stored and analysed over time. The platform also allows the school's data to be compared with that of other schools ("GoodSchoolDigiTool", n.d.).
In the Czech Republic, a handbook has been prepared by Ekoškola to develop an EU-funded environmental programme for schools aimed at teachers. It focuses on the impact of schools on the environment. It proposes several action plans to address individual problems in energy, water, waste, school environment, traffic and biodiversity and to minimise the impact of schools. (Ekoškola, created by webdilna.com, n.d.)
11
Figure 8 (Odua Images, Canva, s.d)
Good practices
Italy has developed the "National Network of Green Schools" , which includes more than 800 interconnected schools that share projects, events, good practices and experiences in sustainability and environmental protection. The objective of the schools involved is to establish the adoption of a series of behaviours and actions to defend the ecosystem and make students more aware of and responsible for these issues. For example, reducing and eliminating the consumption of plastic bottles, replacing them with water bottles and water dispensers; promoting and respecting the selective collection of waste in all areas of the Institute; promoting scientific disclosure by organising meetings between the school community and experts in the fields of ecology and climatology; supporting democratic lobbying activity by students, encouraging them to participate in the Fridays for Future global strike; and more.
The National Network of Green Schools was born from the initiative of a Roman high school (the Socrates High School) in response to the demands of the young people involved in the Fridays for Future actions and to the need for an educational system that is more attentive to issues of sustainability and environmental protection ("Rete Nazionale Scuole Green", https://www.retescuolegreen.it/)
12
Reduce our carbon footprint
Now that the important terms have been defined, we know about the EU's commitments to climate neutrality, and now that the importance of schools has been highlighted, it is interesting to consider what we can do personally to reduce our ecological footprint individually.
Point 1 has enlightened us on how to achieve climate neutrality, which as a reminder, is to compensate for or reduce our greenhouse gas emissions. However, it is impossible to eliminate them completely as this would mean that we would have to eat almost nothing, not wash anything and live in the wild without any technology, which would seem utopian today.
However, by making a few changes to your daily habits, you can reduce at least the most significant sources of CO2. You need to look at the so-called 'emission champions' to do this. This term refers to the most polluting sectors:
CO2 EMISSION CHAMPIONS
Transport. Nearly 30% of the ecological footprint is created by transport, with planes, petrol and diesel cars leading the way in CO2 emissions. When travelling, it is better to choose more sustainable means of transport: electric cars, bicycles, trains or walking, for example.
Electricity in our home. Energy-efficient appliances reduce the electricity bill and the CO2 footprint from electricity consumption. The result will be even better if the origin of your electricity is green.
13
Food. Red meat and other animal products are undoubtedly the biggest CO2 emitters in this category. The livestock industry is particularly polluting and emits large quantities of methane gas. In addition, livestock farming uses much water and clears land that could remain green. The best way to control your CO2 footprint from food is to eat more plantbased products and try not to waste food.
Clothing. The fashion industry is also an active polluter of the environment. Especially fast fashion. Do you have a few pairs of unworn jeans in your wardrobe? Do not forget that producing one pair of jeans costs the planet around 33 kg of CO2 and even 7,000 litres of water. So, it is worth thinking before you buy a new item of clothing and avoiding fastfashion shops if possible.
A few easy-to-implement actions can then be taken in daily life. These include :
choosing sustainable transport;
using energy-efficient appliances;
choosing green electricity;
eating less meat;
avoiding food waste;
avoiding fast fashion.
14
If you want to go further and calculate your ecological footprint, scientists have developed several calculators that allow you to determine your CO2 footprint. You can find many such calculators online by typing "carbon footprint calculator" into your web browser. A simple example can be found here:
https://footprint.wwf.org.uk/#/questionnaire.

15
Figure 9 (Seventy four, Canva, s.d)
Carbon neutral schools

PART 2 : METHODOLOGY
Methodology
Part 2 of this report focuses on the methodology used to create factor maps. First, you will find an explanation of what a factorial map is and its utility. Next, the methodology used to create the maps will be discussed, followed by the process of validation of the different maps by experts. The results section will highlight the most important factors as well as the similarities and major differences between the maps. Finally, the conclusion will discuss how we will use the factor maps in the future of our project.
What is a factor map ?
A factor map, as we envision it in this project, is an innovative way to identify relevant factors for reducing the carbon footprint of educational institutions.
The blank map looks like this:

16
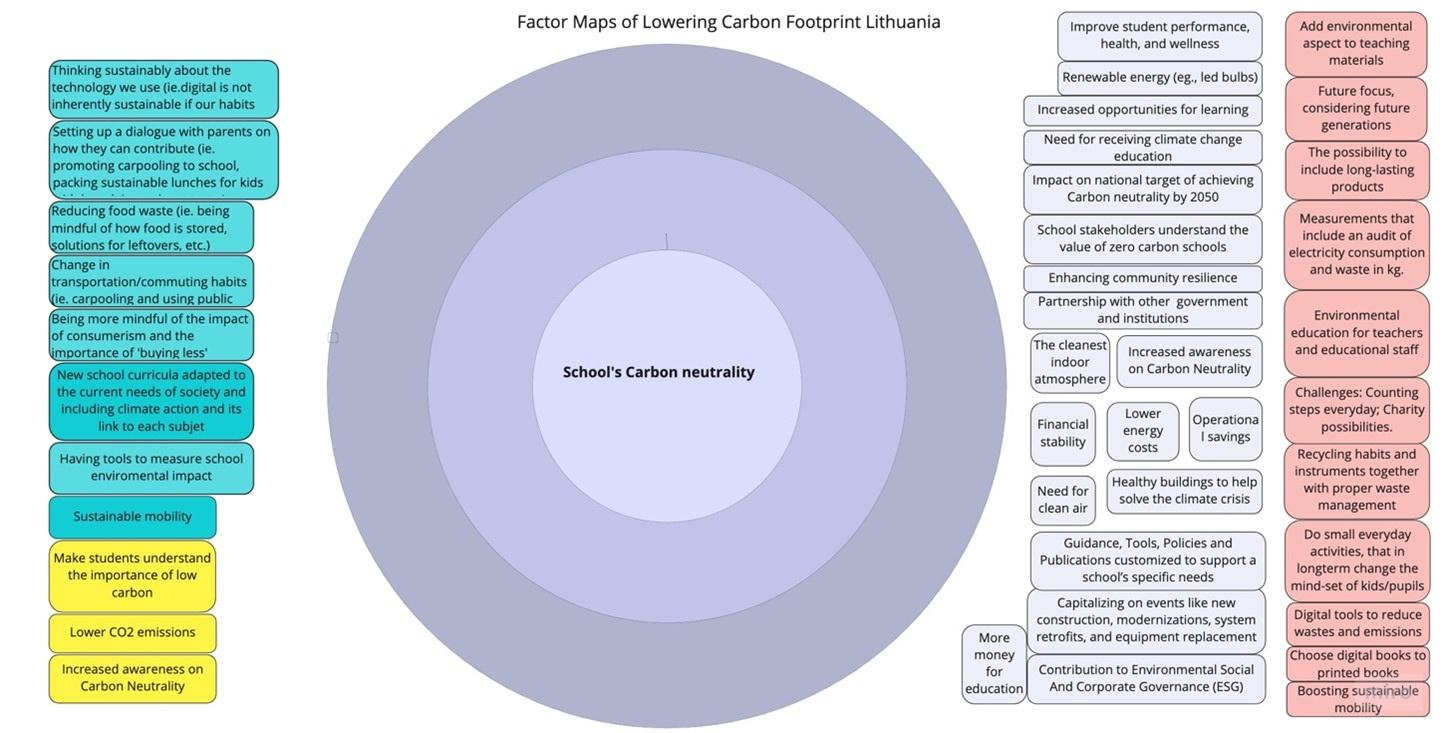
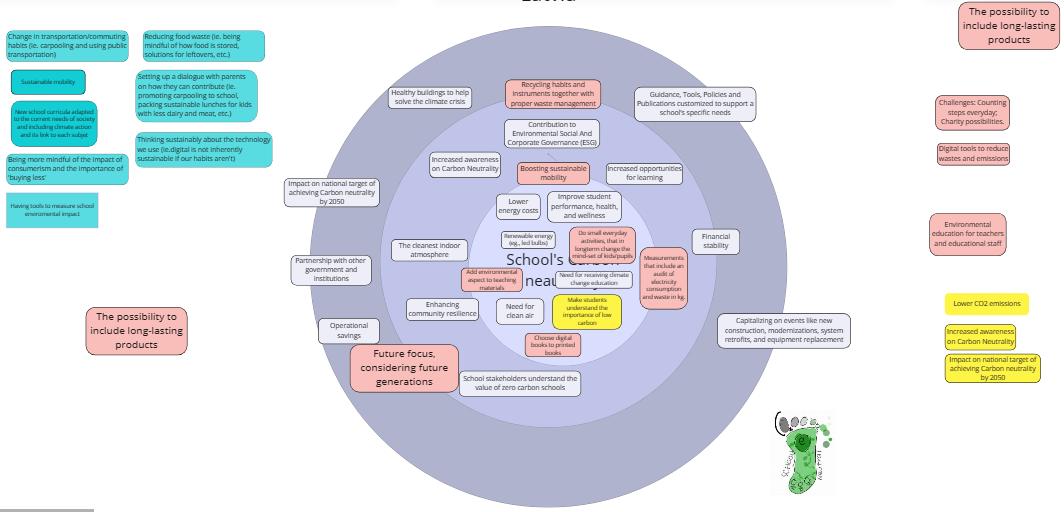
Figure 10 (Project Carbon Neutral School, 2023)
The goal is to place the most important factors at the centre of the map. The further away from the centre, the less important the factors are.
Creation of the factor maps
The creation of the factor maps took place during the first international meeting of the project in Riga, Latvia, during a brainstorming session. The maps were created using the online tool Miro. This tool reduces the number of printed documents, makes quick changes by moving elements around, and involves partners who could not physically come to Riga.
This methodology was chosen to strengthen the priority of digital transformation projects by developing digital readiness and promoting collaboration, inclusion and intercultural awareness.
The objective of creating these factor maps is to identify factors that can help educational institutions significantly reduce their carbon footprint, which will lead to the development of more effective and innovative educational practices in various education sectors, as well as to the achievement of the overall project objectives.
Step 1 : Individual part
In the first step, each country created its own map with the relevant factors in their context.
Step 2 : Pooling
Each country shared its production for the second step, and a debate on the different factors followed. Indeed, some factors were found in several maps while others were not. The partners therefore discussed the relevance of the various factors and agreed on common factors.
Step 3 : Finalisation
After agreeing on the factors to be placed, each country created its own map by placing the most relevant and essential factors at the centre of the factorial map.
17
Validation of the factor maps
Each country has created a factor map that it considers relevant to its context and school system. However, to obtain an accurate and reliable result, it is important to have the map validated by experts in the field. Therefore, after the brainstorming session, each partner visited an educational institution or consulted with teachers to validate the framework they had developed.
While the common instruction was to have the map validated by experts, each partner brought its own intervention so that the validation process may differ slightly from country to country.
The validation process of the Italian, Croatian, Belgian and Latvian maps.
The Croatian factor map (see annexe 2) was validated by two representatives of schools in the region. The first one is a school director who is also a biology and chemistry teacher, and the second one is a teacher in electrical and mechanical engineering.
The Italian factor map (see annexe 1) was validated by two schools, one located in Rome and the other in Naples. In the first case, it was validated by a biological sciences and physics teacher. In the second, it was validated by a mathematics teacher with his students.
Two secondary school teachers validated the Belgian factor map (see Appendix 3). The Latvian factorial map (see annexe 4) was also validated by experts.
18
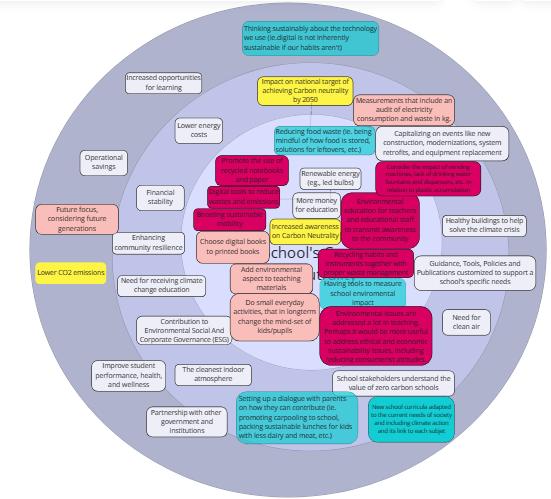
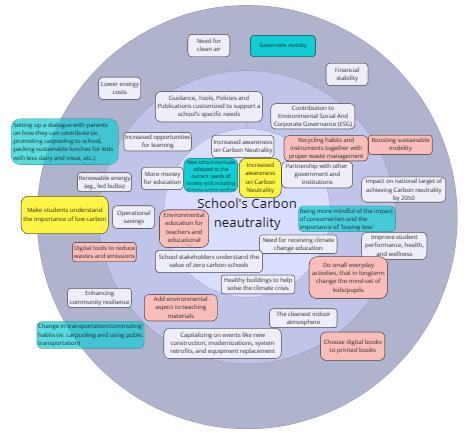
The validation process of the Lithuanian map
Teachers validated the Lithuanian factor map (see Appendix 5). In the first step, the validation was organised within a group of teachers and the project team. In the second step, the factor map was reconstructed and translated into Lithuanian, and at the schoolteachers’ meeting, the teachers tried again to add all the factors. Finally, all participating teachers agreed that the factor map corresponded to most opinions and situations.
After the activities and validation, an evaluation grid (annexe 5) was used to evaluate the factor map and the validation process. All the evaluation criteria were 4 and 5, so we can conclude from the evaluations that this factor map is good to use for teaching and understanding.
The validation process of the Finnish map
After the first version of their map was created during the meeting in Riga, the Finnish partners did some research and decided to categorise the different factors. Thus, they followed the categories of the ARENE carbon footprint calculator in the field of greenhouse gases. Therefore, the centre of the factor map would correspond to the energies produced and used (for example, the gas boiler). Circle 2 would correspond to external energy (heating, electricity, cooling system). The last circle would correspond to water, waste, cleaning, new construction, renovations, maintenance, and upkeep of outdoor spaces.
The partners submitted the map and these categories to an expert responsible for carbon footprint calculations in the Vaski project. This project is working on a new carbon footprint calculator for schools. After discussing the different factors (annexe 6) with their expert, the finalised map can now be found in Annex 6.
19
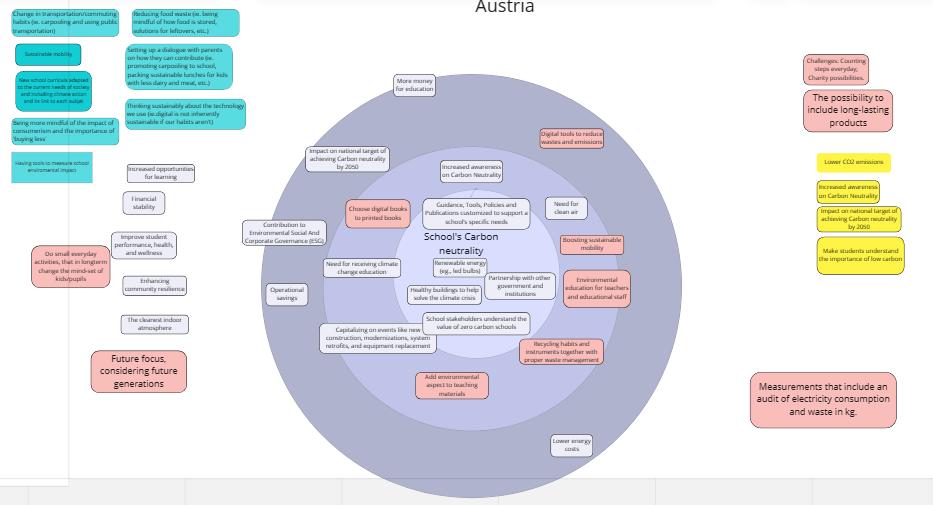
The validation process of the Austrian map:
A teacher from Graz validated the Austrian map. She validated the concept of the map but wanted to clarify the context of their school in Graz. For example, she stated that in the Austrian situation, it is important to pay adequate attention to the "renovation" of buildings, many of which are old and need to be renovated to reduce CO2 emissions. The detailed comments and the finalised factor map are in annexe 7.
Results
After learning about the process of creating and validating the factor maps, it is time to analyse their content to determine the priorities of schools in the different countries of the project partners.
As a reminder, these factor maps aim to determine the relevant factors for reducing the carbon footprint of educational institutions. These factors will influence the content of the e-learning course "Organization's Low Carbon Expert", which will be made available free of charge to schools, higher education institutions, vocational schools, and all other interested educational organisations in Europe so that they can launch their own low carbon education programs based on the introductory course they have taken.
Since there are many maps (seven) and the realities of each country are very different, there is no one factor that emerges as more important than another. Therefore, a table (see annexe 8) was created to have an overview of the different factors and the order of priority in which they are placed by the different countries. Furthermore, this table made it possible to identify the factors that were the most important for the greatest number of countries and to highlight similarities and notable differences.
20
The factors that were ranked as priority 1 or 2 by all countries include:
Need for climate change education to make students understand the importance of carbon neutrality;
Use of renewable energy (e.g., LED light bulbs);
Increasing awareness of carbon neutrality for all.
Other factors that the schools overall prioritised coincide with these three factors. Indeed, the need to reduce energy costs joins the use of renewable energy, which is often a way to reduce energy costs in short to medium term. The factor "Environmental education for teachers and educational staff" is linked to increasing awareness of carbon neutrality for all.
On the other hand, some factors are not a priority for schools in all seven of our partner countries. These factors are also interesting to note since they can be used to propose relevant content to schools and, therefore, not give too much content to subjects that are not the priority.
Factors that do not seem to be the priority for schools today are:
Changes in transportation/travel habits (e.g., carpooling and use of public transportation);
Encouraging sustainable mobility;
Impact on the national goal of carbon neutrality by 2050;
Sustainable thinking about the technology we use (e.g., turning off computers at the end of the school day);
Taking advantage of events such as new construction, retrofits, system upgrades and equipment replacement.
21
For the most part, these changes are costly (new construction, equipment replacements), require habit changes that are difficult to implement, or the results of the efforts need to be more concrete (national goal).
While some factors were more or less unanimously agreed upon by the different countries, others were more controversial. Indeed, the reality of a school from one country to another can be very different. Nevertheless, the following factors were considered a priority for some countries and not very important for others.
Replacing printed books with digital books;
Using digital tools to reduce waste and CO2 emissions;
Measuring the school's impact on the environment;
Partnering with other governments and institutions;
Doing small daily activities that, in the long run, change the mindset of the children/students.
This analysis will be helpful in the creation of learning modules' contents, which is the next step of our project.
The priorities for the schools in the seven different countries of our project are to receive climate change education to raise the awareness of the students and the other stakeholders about carbon neutrality and to implement small changes that can ultimately make a big difference for the ecology and economy of their school, such as changing the light bulbs to LED bulbs. These topics will therefore be of great importance in the learning modules developed.
22
It is also essential to remember the factors not unanimously agreed upon because even if they are not considered necessary for some countries, others have considered them a priority. Therefore, it will be important to balance these topics to address them all at the same way but giving them only a little space.
Finally, it will be important to remember the subjects that are not a priority for schools in order to give little importance to these contents in the learning modules.

23
Figure 11 (Khanisorn, Canva, s.d)
Conclusion
In summary, the first part of this report defined different terms around carbon neutrality and highlighted European policies on this topic. This part also addressed the issue of carbon neutrality at school by explaining why the topic is critical to address at school and presenting examples of good practices. Finally, part one concludes with some individual recommendations for reducing one's carbon footprint.
The second part of the report focuses on the methodology used, explaining how the factor maps were created and validated. Finally, the result section discusses the important factors to consider when creating learning modules. Indeed, it will be necessary to ensure that renewable energies and the reduction of energy costs, the measurement of the school's environmental impact, the partnership with other institutions, the place of digital tools in the fight against climate change, the establishment of small habits would be addressed to raise awareness of the various actors of the school to carbon neutrality.
We hope this report has enlightened you on carbon neutrality and the methodology used for the beginning of our project.

24
Figure 12 (Irina Iser, Canva, s.d)
References
A Beginner’s Guide to Climate Neutrality. (2021, February). United Nations Climate Change. https://unfccc.int/blog/a-beginner-s-guide-to-climateneutrality
ArtSmart. (2022). Application form. Erasmus+.
European Commission. (2019). The European Green Deal. In European Commission. https://eur-lex.europa.eu/resource.html?uri=cellar:b828d1651c22-11ea-8c1f-01aa75ed71a1.0002.02/DOC 1&format=PDF
Ekoškola, created by webdilna.com. (n.d.). Mezinárodní program Ekoškola | Ekoškola. Ekoškola. https://ekoskola.cz/cz
Generation Climate: Young people at the forefront of change. (2022, February 16). European Climate Pact. https://climate-pact.europa.eu/news/generationclimate-young-people-forefront-change-2022-02-16 en
GoodSchoolDigiTool. (n.d.). Good School Digitool.
https://www.goodschooldigitool.be/
Making a school carbon neutral. (2022, June 1). International Teaching Magazine. https://consiliumeducation.com/itm/2022/05/25/sustainabilityrevolution/
What is carbon neutrality and how can it be achieved by 2050? | News | European Parliament. (2022b, September 7). European Parliament News. https://www.europarl.europa.eu/news/en/headlines/society/20190926STO622 70/what-is-carbon-neutrality-and-how-can-it-be-achieved-by-2050
Fransen, B. (2019). The Basics of a Carbon Footprint. EcoMatcher.
https://www.ecomatcher.com/the-basics-of-a-carbon-footprint/
ANNEXES
Annexe 1 : Italian factor map
Annexe 2 : Croatian factor map
Annexe 3 : Belgian factor map

Stage 1
 Annexe 4 : Latvian factor map
Annexe 5 : Lithuanian factor map and validation process
Annexe 4 : Latvian factor map
Annexe 5 : Lithuanian factor map and validation process
Stage 2
Stage 3: https://miro.com/app/board/uXjVPm6NZ1U=/?
share _ link _ id=175113951936
Stage 4: validation of the map


Evaluation
Annexe 7: Finnish factor map and validation process
Exact comment made by the expert:
In general:
•There is logic in the presentation (map), understandable (after explanation) => some finalisation needed
•Arene calculator is basically good but focuses on buildings
•Scope3 is always difficult in details
•What is a carbon neutral school? (Discussion about the carbon sinks)
•There could be (surprisingly big) emissions of refrigerants (how to categorise them?)
•ICT purchases could be surprisingly big as well, like laptops for students
Could waste bills/reports be exploited?
•Teachers commuting? Probably should be included (Scope3)

•Like pupils commuting! (Scope3)
•And staff's business trips (Scope3)
•Students/pupils lunches: own kitchen, delivered food (central kitchen), students in work periods, remote students
•In vocational schools, there can be relatively lot of purchases (machinery, raw materials)
Annexe 6: Lithuanian Evaluation Grid
Background information provided by the teacher (exact comment by the teacher):
It is important that all changes start bottom up and are slowly introduced, step by step, in order to gain acceptance. She said that for what concerns the Austrian situation, it is important to pay adequate attention to the "renovation" of buildings, many of which, according to her, are old and in need of renovation to be able to cut CO2 emissions.

An interesting point she raised relates to food in school: she said that in her school, for example, the Mensa (Canteen) is fit with excellent, local and healthy food, but the kids, although they are not allowed in principle to leave the school, go out anyway to buy junk food (MacDonald or similar), thus not only having an unhealthy diet but also creating mountains of trash from the one-way packages in which the food is served.
She mentioned also the fact that many kids in school have either a migration background and/or come from families that have difficulties arriving at the end of the month. This is one of the reasons why, according to her, many kids are busy "fighting for survival" and do not care about the environment.
Annexe 8: Austrian factor map and validation process
In relation to carbon neutrality, goals are already part of teaching. Changing the curricula in Austria is very difficult and is not done on a regular basis: there will soon be a change in the curricula coming out, for which we are too late now. Therefore she thinks that the next modification will take many years. She also mentioned that many kids in her school come from outside Graz and usually need 1,5 hours with public transportation to arrive at school. This is one of the reasons why, when they are old enough, they come by car. She mentions that often they simply stand up in the middle of the teaching and leave to change their parking ticket. Ergo: a better transportation system would be ideal for cutting CO2 emission in (relation to) school.