2 minute read
BMBI
BUILDERS MERCHANT BUILDING INDEX
BUMPER Q1 VALUE SALES BUT INCREASE DRIVEN MORE BY PRICE INFLATION THAN VOLUME
The latest total value sales data from Britain’s Builders’ Merchants shows Q1 2022 was a bumper quarter thanks in part to a recordbreaking March, which clocked up the highest ever total sales in the history of the BMBI. However this was driven once again by price inflation more than volume growth.
QUARTERLY SALES, YEAR-ON-YEAR
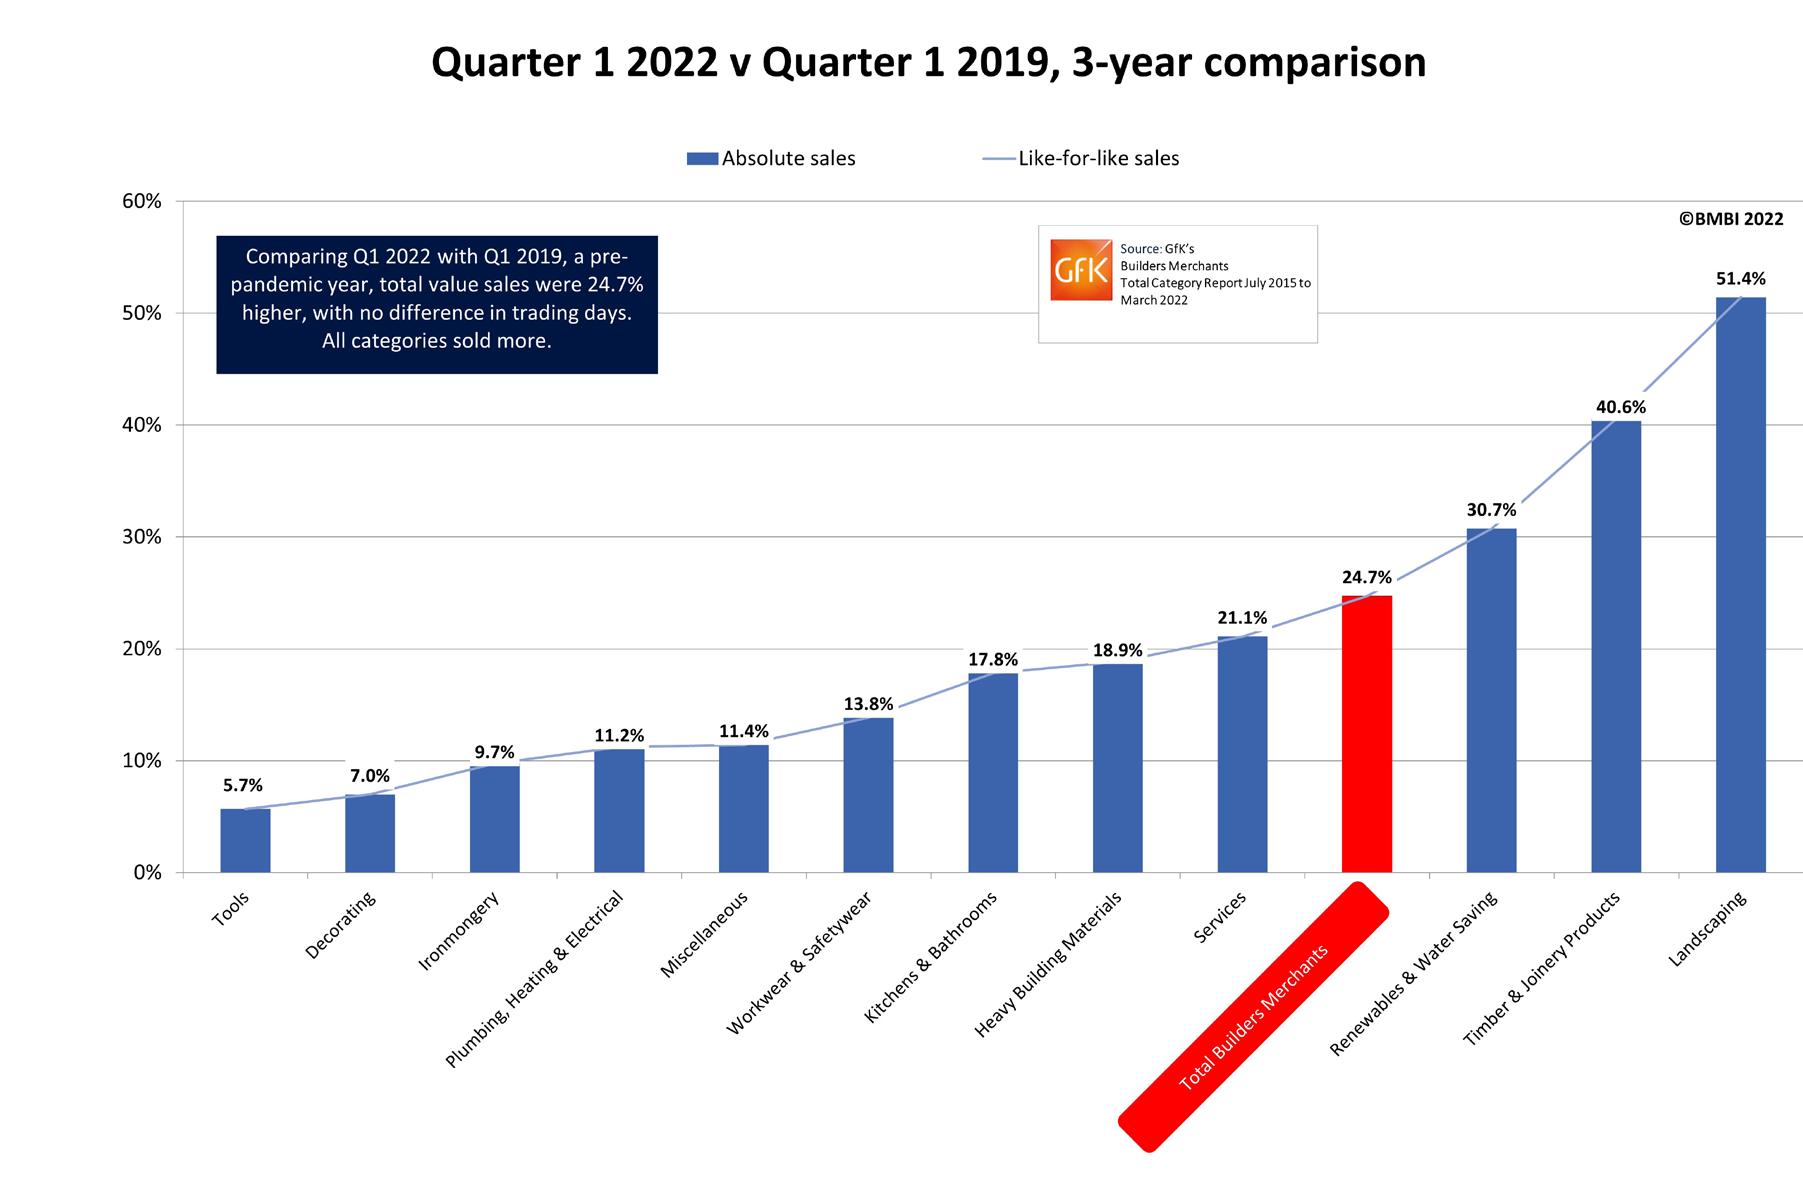
Total value sales in Q1 2022 were 17.7% higher than Q1 2021, with no difference in trading days. The increase was driven by price inflation (+16.0%) more than volume growth (+1.5%). All bar one category sold more. Kitchens & Bathrooms (+26.3%), Plumbing, Heating & Electrical (+16.4%) and Miscellaneous (+12.8%) all had their best-ever quarterly sales. Comparing Q1 2022 with Q1 2019, a pre-pandemic year, total value sales were 24.7% higher, with no difference in trading days. All categories sold more.
QUARTER-ON-QUARTER
Quarter-on-quarter, sales were up 11.4% in Q1 2022 compared to Q4 2021, helped by three more trading days in the most recent period. All categories sold more. Like-for-like sales were 6.1% higher than Q4 2021.
MARCH SALES, YEAR-ON-YEAR
Compared to March 2021, when large parts of the country were again under Covid restrictions, total sales were 9.8% higher in March 2022 with no difference in trading days. This was driven entirely by price inflation (+18.5%) rather than volume (-7.3%). All bar one category sold more. Compared to the same month three years ago, total value sales in March 2022 were 35.0% higher than March 2019, helped by two more trading days this year.

MARCH SALES, MONTHON-MONTH
Total merchant sales in March were 24.1% higher than February, boosted by three extra trading days in the most recent month. Seasonal category Landscaping (+47.2%) outperformed the other categories. Like-for-like sales were 7.9% higher.
LAST 12 MONTHS
Sales in the 12 months from April 2021 to March 2022 were 30.6% higher than in the same 12 months a year earlier, with one less trading day this year. All categories sold more. Timber & Joinery Products (+47.9%), Renewables & Water Saving (+34.4%) and Kitchens & Bathrooms (32.1%) were the best performing categories.
GfK’s Builders Merchant Panel
GfK’s Merchant Panel includes national, multi-regional and regional merchants such as Buildbase, Jewson, Travis Perkins, EH Smith, Gibbs & Dandy, MKM and Bradfords. GfK’s Builders’ Merchant Point of Sale Tracking Data represents more than 80% of the value of the builders’ merchant market. GfK insights can trace product group performance and track relevant features. GfK can also produce robust like-forlike market comparability, tailored to the requirements of an individual business.
The Builders Merchant Building Index
The BMBI is published every month, in print and online. A full quarterly report is available every three months. The BMBI is a brand of the Builders Merchants Federation. Launched and produced by MRA Research, it uses sales-out data from GfK’s Builders Merchant Panel. BMBI includes a panel of leading industry Experts, who speak exclusively for their markets.
For the full report, Expert comments and Round Table Debates, visit www.bmbi.co.uk.


