The case for clean air zones
The case for clean air zones
By Philippa Borrowman
Acknowledgements
With thanks to Chaitanya Kumar and Jonathan Ritson for their contribution to the research and writing of this report.
Thank you to Oliver Lord at the Environment Defense Fund and Andrea Lee at ClientEarth for reviewing our work.
We are grateful for the European Climate Foundation for supporting this work.
© Green Alliance, 2021 Green Alliance’s work is licensed under a Creative Commons Attribution-Noncommercial-No derivative works 3.0 unported licence. This does not replace copyright but gives certain rights without having to ask Green Alliance for permission.
Under this licence, our work may be shared freely. This provides the freedom to copy, distribute and transmit this work on to others, provided Green Alliance is credited as the author and text is unaltered. This work must not be resold or used for commercial purposes. These conditions can be waived under certain circumstances with the written permission of Green Alliance. For more information about this licence go to http:// creativecommons.org/licenses/ by-nc-nd/3.0/ Please note: our Creative Commons licence does not cover the use of any photographic images featured in this report which are subject to separate copyright and must not be shared or copied without permission.
Green Alliance
40 Broadway London SW1H 0BU
020 7233 7433
ga@green-alliance.org.uk
www.green-alliance.org.uk
@GreenAllianceUK

The Green Alliance Trust
Registered charity no 1045395 Company limited by guarantee (England and Wales) no 3037633
The Green Alliance Trust
Registered charity no. 1045395 Company limited by guarantee (England and Wales) no. 3037633
Registered at the above address
Published by Green Alliance

ISBN 978-1-909980-83-9
March 2021
Designed by Howdy
1 Contents Summary 2 Introduction 4 Clean air zones in context 6 Five common clean air zone myths 12 Making the benefits clear 15 Ensuring clean air zones are fair 18 Addressing the bigger picture 21 How to get clean air zones right 26 Lessons for the UK from abroad 28 Endnotes 34
Summary
In December 2020, for the first time, a landmark ruling stated that air pollution had been a contributing factor in the death of a nine year old child in London following an asthma attack.1 Toxic air pollution is harming people. Every year, up to 4.2 million premature deaths worldwide are attributed to poor outdoor air quality.2 It is linked to major health issues, such as cancer, asthma and strokes.3 There are also concerns that people living in polluted areas and suffering from these health problems have been more vulnerable to the impacts of Covid-19.4
This problem is also economically damaging. Estimates suggest that the UK economy would save £1.6 billion annually by tackling air pollution, from a reduced number of premature deaths, fewer days off due to sickness and higher work productivity.5
The government is beginning to address the problem with its 2019 Clean Air Strategy and local authorities across the country are increasingly taking action. But significantly more needs to be done to bring UK cities and towns in line with World Health Organization (WHO) guidelines.
The most effective way to reduce pollution is by designating clean air zones. These are specific areas where targeted action is taken, often in the form of charging the most polluting vehicles for entering the zone. They are designed to encourage the shift to cleaner vehicles and alternative modes of transport. Clean air zones are now found in over 250 cities across Europe, and there is comprehensive research demonstrating that they work.6
Despite this, there has been pushback in the UK, with claims that they are the wrong approach to reducing emissions and a suspicion that they may not be effective. Some believe they are a stealth tax, while others see them as unfairly penalising low income households, vulnerable groups and small businesses.
In this report, we address these concerns, describing the targeted measures which can ensure that clean air zones
2
are both fair and successful. We show that, when implemented alongside effective incentives, communities and businesses stand to benefit hugely from a healthier environment, a more resilient economy and better local transport choices. We make recommendations to both local and central government, to unblock the issues around clean air zones and ensure they are implemented quickly and positively across the country.
Our recommendations to local authorities: Implement the most comprehensive form of clean air zone and communicate it as part of a broader transformation plan for the area. This should include a clear plan to mitigate the impact on local businesses and residents, with financial support where necessary. Wider transformation of the transport system should include targeted action to prioritise public transport and active travel, with reallocation of road space to buses, pedestrians and cyclists, and car free streets. Local authorities should work closely with local businesses to roll out freight consolidation centres, workplace parking levies and scrappage schemes.
Consult communities and businesses extensively on local transport reforms. The reason many schemes fail is due to poor local consultation. Local authorities must set a clear overarching vision for their area and work in partnership with people and businesses on the best ways to realise it in their local context.
Our recommendations to central government:
Enshrine commitment to the WHO air pollution limit in law through the Environment Bill. This clear signal of intent by national government would indicate to local authorities and wider society that it is taking air pollution seriously. This should be supported by a national campaign to improve public perception of clean air zones and other action to reduce air pollution, making it
3
clear their positive impact on public health, the economy and the environment.
Increase support to reduce emissions. Local authorities will need more support from central government to bring down local emissions, not only to improve air quality but also to tackle climate change at the local level. This requires long term, stable, dedicated funding for improvements to transport infrastructure. This should be based on a framework, created in partnership with local leaders, setting out the expectations of local authorities and the most effective actions they can take. It will enable local areas to promote the greater use of active travel and sustainable public transport options, which are integral to operating successful clean air zones.7
4
Introduction
Poor air quality is the greatest environmental risk to public health in the UK, with up to 36,000 premature deaths a year attributed to long term exposure.8 It also has a notable impact on economic performance causing harm to both human and natural capital. Estimates suggest that the UK economy could save £1.6 billion and gain an extra three million working days a year by tackling air pollution, due to fewer premature deaths, reduced sickness and higher work productivity 9 ,10
It is also a local problem. Around a third of nitrogen oxide (NOx) pollution comes from road transport, with local road traffic contributing up to 80 per cent.11,12 Reducing illegal levels of pollution at the local level will require a concerted effort to tackle vehicle emissions, as well as promote public transport use, walking and cycling.
In 2020, three quarters of areas assessed were in breach of the air pollution law that came into effect in 2010.13 A decade of inaction has meant that over 65 local authorities have roads with concentrations of nitrogen dioxide (NO2) forecast above permissible limits of 40µg per m3 (micrograms per cubic metre of air).14
National lockdowns to prevent the spread of Covid-19 initially had some impact on air pollution and traffic volumes, with local authorities opening up more space for cycling and walking. But research shows that, post-lockdowns, these have not had a lasting impact. Air pollution returned to, and in some cases exceeded, pre-pandemic levels in 39 of 49 cities and large towns after the first lockdown in early 2020.15
Ambitious clean air zones are a fast route to legal compliance and there is demand for bold action to meet World Health Organization (WHO) air pollution guidelines.16,17 A 2019 poll revealed they also have significant public support.18 In addition, they can be transformational in cutting local carbon emissions by promoting a modal shift in transport and reducing the number of polluting vehicles in the zone.
In this report, we demonstrate how clean air zones, covering all vehicles, implemented alongside other local transport improvements, can play an important role in meeting air pollution and climate targets and improving community wellbeing. We address some of the myths holding back their roll-out and make the case for them to improve living and life outcomes in urban areas right across the country.
5
“The UK economy could save £1.6 billion and gain an extra three million working days a year by tackling air pollution.”
Clean air zones in context
There are over 250 clean air zones in Europe. Due to dangerously high levels of pollution, cities are acting to bring down pollution levels to within legal limits, as set under EU law (see table below). The UK has consistently failed to comply with both the hourly and annual mean limit values for NO2 since 2010, and a recent ruling by the Court of Justice for the European Union found that the UK has persistently failed to bring NO2 within legal limits.19 However, since leaving the EU, these limits can no longer be enforced by the European Commission in the UK, although they still exist in domestic law.20
It is estimated that bringing air pollution levels within the more stringent WHO guidelines could prevent 17,000 deaths every year in the UK caused by respiratory disease. This demonstrates the urgent need for the UK government to commit to the recommended WHO limits in law through the Environment Bill.21,22
UK air pollution levels compared to EU and WHO targets
Pollutant EU law
Fine particles (PM2.5) Cannot exceed an annual mean of 25µg per cubic metre (µg/m3)
WHO guidelines
Cannot exceed an annual mean of 10µg/m3
UK performance
Overall annual mean for UK is 10µg/m3, however levels are significantly higher in cities. All monitored roads in 19 UK cities exceed the WHO guidelines23
Nitrogen dioxide (NO2) Cannot exceed an annual mean of 40µg/m3
Cannot exceed an annual mean of 40 µg/m3
In the 43 air quality assessment zones in the UK, only ten met the mean annual limit in 201924
7
“The UK has persistently failed to bring NO₂ within legal limits.”
Government support for clean air zones across the UK
The Environment Bill, now expected to be passed in 2021, will require the government to set targets on air quality, in particular PM2.5. It provides an opportunity for the UK to enshrine the more ambitious WHO recommendations in UK law. Local authorities, communities, businesses, health and environmental organisations have all called for these stricter targets, to cut down on dangerous pollution and prevent unnecessary deaths and harm to health across the country. More importantly, to protect public health, the government should set a timescale to ensure these targets are met by 2030.25
The 2019 Clean Air Strategy, and the 2017 UK plan for tackling roadside NO2, both set out how national government intends to tackle pollution.26 27 The latter identified a number of local authorities which persistently exceed NO2 limits and need to reduce emissions in the shortest possible time. The Department for Environment, Food and Rural Affairs (Defra) and the Department for Transport (DfT) together published a clean air zone framework in 2017, setting out key principles which local authorities should follow when designating zones, accompanied by funding, through the £275 million Implementation Fund and the £220 million Clean Air Fund, to minimise the impacts on local businesses and individuals. 28
Since 2017, more than 60 local authorities have been ordered by ministers to produce plans to comply with air quality regulations as soon as possible, whether through clean air zones or other means. While this has led to comprehensive plans being produced for areas such as Bath and Birmingham, other areas have experienced severe and continuous delays, even before the Covid-19 pandemic, with 26 authorities yet to submit their final air quality plans for ministerial approval.29
Rolling out clean air zones has similarly faced numerous delays. Bath and Birmingham had their plans interrupted by the Covid-19 pandemic. In other instances, the government has failed to provide the digital systems needed for local authorities to implement charging. This was partly why plans in Leeds were delayed before the pandemic.30
8
31 32
Newcastle
English local authorities with illegal air pollution required to take action to reduce
nitrogen dioxide
authorities required to develop an action plan by 2018 to reduce emissions31
authorities required to plan a clean air zone32
North Tyneside
Gateshead
Middlesborough
Bolton
Bury
Leeds
Salford
Manchester
Tra ord
Stockport
Tameside
Derby
Birmingham
Rotherham
She eld
Nottingham
Coventry
Basildon
Surrey
Heath
Rochford
New Forest
Bristol
Bath
London
Guildford
Rushmoor
Southampton
Fareham
(NB: many other local authorities were also required to take action, but only had exceedances on one speci c road in their area)
9
Why stronger leadership is needed
Many local authorities have found it challenging to introduce these zones due to push back from businesses and residents, despite the benefits they offer for the economy, public health and the environment. National government policies have placed much of the burden of tackling air quality on local areas but have not provided support with publicity and public engagement around why the action is urgently needed. As a result, despite a number of national funding pots and policies to tackle air pollution, local authorities are holding back and plans are falling through.
As the Environment, Food and Rural Affairs (Efra) Committee has highlighted, delivering on the government’s Air Quality Strategy needs co-ordinated action. Local leaders, environmental groups, academics and community groups have all made the case for stronger leadership from the government to build a national consensus.33 And certainty from central government will allow businesses operating in cities across the UK to take a holistic, nationwide approach to improving their vehicle standards, rather than the current disjointed approach which is making it difficult for businesses to prepare for the future.
Types of clean air zone
Local authorities can decide what level of zone they implement. There are four levels, differentiated by the type of vehicles targeted.
1. CAZ A – Buses, coaches, taxis and private hire vehicles (PHVs)
2. CAZ B – Buses, coaches, taxis, PHVs and heavy goods vehicles (HGVs)
3. CAZ C – Buses, coaches, taxis, PHVs, HGVs, light goods vehicles (LGVs) and minibuses
4. CAZ D – Buses, coaches, taxis, PHVs, HGVs LGVs, minibuses and cars
Buses, coaches and HGVs that meet Euro 6 emissions standards, and cars, vans, PHVs, minibuses and taxis that meet Euro 6 (diesel) or Euro 4 (petrol) emissions standards, are normally exempt from clean air zone charges or restrictions.
10
Glasgow –Extension to all vehicles in 2023
Aberdeen
UK clean air zones
Exeter
Dundee
Edinburgh
No plan for a clean air zone
Under review
CAZ expected in 2023
CAZ expected in 2024
CAZ in place
Tyneside
Bradford
Manchester
Liverpool
Derby
Birmingham
York
Leeds
She eld
Nottingham
Leicester
Coventry
Cambridge
Oxford –launched as a pilot
Bristol
Bath
Southampton
Basildon
London – ULEZ expansion in 2023
Portsmouth
11
Five common clean air zone myths
Local authorities are understandably nervous, especially during the pandemic, about raising costs for businesses and residents at the risk of backlash. However, many of the objections to clean air zones are based on misconceptions, and here we address some common claims.
Opponents advocate other solutions to poor air quality, like investment in new road building to cut congestion, anti-idling laws and demand based pricing for parking spaces.34 But these measures will not be enough alone to meet WHO recommended limits. Nor do they discourage car use or accelerate the switch to less polluting vehicles, which a clean air zone actively promotes. Building new roads is also not possible in most city centres where NOx problems are worst and where clean air zones apply. And the rebound effects of road building, where the benefits of extra road space are cancelled out by higher demand, are well documented.35
Here we address five of the common myths around clean air zones:
1. The pandemic has led to cleaner air so they are no longer needed Many local authorities were due to implement a clean air zone during 2020 but have postponed their proposals, with some reconsidering them altogether. Some have put their projects on hold due to changes in air pollution and traffic levels during lockdowns and are now looking at other measures to maintain these levels without having to charge vehicles.
Yet, as lockdowns lift, pollution and traffic levels return, in many cases exceeding pre-lockdown levels as people avoid public transport. Of the 49 cities and towns studied in recent research, 39 had returned to pre-pandemic levels. This includes areas which have delayed, cancelled or rejected their clean air zone plans, such as Southampton and Leeds.36 Studies have also shown that the first lockdown did not improve urban air quality as much as initially thought.37
Last minute changes to plans are frustrating for local businesses. Continuous delays and policy changes by Leeds City Council throughout 2020 has caused outrage amongst the city’s taxi community, angry at policy U-turns after spending thousands of pounds on new, compliant vehicles.38
2. They have no impact on children’s health
Children are especially affected by air pollution. Data from the Breathe London campaign shows that almost 40 per cent of the NOx pollution around schools comes from road transport.39 Recent analysis revealed that the number of schools in London which exceeded the legal limit of NO2 was reduced by 97 per cent, from 455 schools in 2016 to just 14 in 2019, following the introduction of the ultra low emission zone (ULEZ).
13
“Many of the objections to clean air zones are based on misconceptions.”
Particulate matter around schools is a huge concern due to the wear and tear of car tyres and brakes during the morning school run.40 The ULEZ has reduced average levels of PM2.5 in London by up to 27 per cent at some sites, but 98 per cent of London’s schools are still in areas which exceed WHO recommended levels.41 The planned expansion of the ULEZ intends to tackle this issue. Cities across the UK face similar challenges, and a clean air zone is a powerful measure in preventing dangerous PM2.5 levels affecting children. In Birmingham, 88 per cent of school areas exceed the WHO PM2.5 level, the figures are ten per cent in Bristol and 16 per cent in Leeds.42
3. They are a stealth tax
A number of lobbying groups, and responses to consultations, have suggested that clean air zones are a stealth tax and simply a way for councils to make more money. However, as Birmingham’s plans highlight, the goal of the zone is not to generate income. Its main purpose will be to encourage active or public transport and to clear streets of the most polluting vehicles. If the intention was to generate income, a fall in non-compliant vehicles would be undesirable. Instead, Birmingham expects only seven per cent of cars to pay the charge and the money the zone generates will be reinvested directly in transport projects. The city modelled a number of different charging rates but found that a higher charge would not significantly influence behaviour change, so the proposed charge has been revised down from £12.50 to £8.
4. Vehicle improvements are short lived
One study has shown that the earlier London LEZ only led to a temporary increase in the rate of replacement in non-compliant HGVs, and it was only a year before the rate returned to the national average. However, this has been addressed with the stricter ULEZ now in place in London, where more stringent measures have resulted in HGVs having the highest compliance rate of any vehicle group, at a rate of 90 per cent compared to the average 70 per cent.43 Similarly, in Den Bosch, in the Netherlands, the HGV compliance rate increased from 70 to 83 per cent as a result of stricter enforcement.44 This points to the need for strong standards from the start.45
5. They have no discernible impact on nitrogen dioxide pollution
A 2013 study found that London’s LEZ did not reduce NO2 levels, but this was due to the fact that the zone was originally designed only to reduce particulate matter, and that, within the zone, overall traffic increased during the period studied, cancelling out any potential NO2 reductions. Without the LEZ, air quality would have been much worse. More recent studies show a very large decrease in NO2 since the stricter ULEZ was introduced, with hourly exceedances decreasing by 97 per cent within the zone.46,47 The success of low emission zones in reducing NO2 levels is seen across Europe; Madrid, for example, had the highest observed reduction in overall NO2 concentrations, falling by 32 per cent in 2019 compared to 2018.48
14
“The success of low emission zones in reducing NO2 levels is seen across Europe.”
Economic benefits
15
When designing a clean air zone, local authorities should effectively communicate with their local communities and businesses, backed up by a national campaign, to show that any negative impacts are far outweighed by the benefits they bring to health, the local economy and the environment, as we set out below.
Setting out the benefits of the zone, as well as introducing policies to minimise any negative impacts and support modal shift in transport, will help local authorities avoid misunderstandings and backlash.
Good for national and local economies
Meeting WHO guidelines for air quality in the UK will increase labour productivity, due to fewer sick days taken, reduced mortality and disease, and fewer workers retiring early due to illness. It is estimated that a £900 million increase in annual earnings across the UK would result from cleaner air. And businesses and the economy could gain from an extra £1.6 billion and three million extra working days annually.49
Impact assessments to understand the feasibility of clean air zones in UK cities have also demonstrated clear financial gains for local authorities. Greater Manchester’s original plan for a clean air zone, which changed as a result of the pandemic, aimed to implement a CAZ B by 2021, and a CAZ C by 2023. The assessment showed that, in its first year of operation, the zone could have led to almost £25 million worth of health and environmental benefits and, in 2022, the value of the scheme, even taking into account the running costs, could have reached £5.5 million as a result of improved local health and environment. This figure was estimated to rise to almost £40 million in 2030.50
A higher level of zone brings higher benefits
The highest designation, a CAZ D, which also charges private vehicles and, therefore, encourages people to reconsider the way they travel, cuts air pollution and congestion significantly more than a CAZ C. For example, Birmingham’s impact assessment of its CAZ D proposal, found that the health and environmental benefits for 2020 alone would have equated to over £50 million, twice the modelled benefits for Manchester 2022.51 Similarly, Bristol’s assessment (see below) found significantly higher benefits for a CAZ D designation.
Wider improvements to the transport system, alongside a clean air zone, also offer significant economic benefits to a local area, while supporting the zone’s success, as we discuss on page 22.
16
“Wider improvements to the transport system, alongside a clean air zone, also offer significant economic benefits to a local area.”
Why a high level zone is best Bristol: CAZ C vs CAZ D
Modelling work undertaken by Bristol in 2019 demonstrated that the financial benefits of a CAZ D are five times greater than those of a CAZ C. And the more comprehensive coverage of the CAZ D would contribute significantly more to meeting climate targets, cutting congestion, reducing air pollution and improving public health.52, 53
Emission and pollution reductions54
17
Measure CAZ C CAZ D CO 2 0.4% 11.1% NO 2 9% 85% Particulate matter 4% 11% Financial benefits55 Reduced CO 2 £1.1 million £14.3 million Reduced particulate matter £2.8 million £7.5 million Shorter journey times £7.7 million £96.5 million Fewer accidents £19.3 million £24 million More active travel £0 £9.8 million Total bene ts £30.9 million £152 million

Ensuring zones are fair
Those on low incomes suffer the worst health impacts of air pollution and have been the worst hit by the pandemic. 56 57 They are also the least likely to own a car. However, there are concerns that clean air zones will increase costs for poorer residents, and these worries have increased through the pandemic, making authorities reluctant to implement zones. But careful planning and mitigation measures can help to reduce the impact on those who might be disadvantaged. Examples include a scrappage scheme, as London has used for its ULEZ, or offering free public transport to those who need it, as provided in Brussels. Under Birmingham’s clean air zone plans, exemptions and scrappage schemes will support residents to make the switch.
There have also been objections from businesses worried that a clean air zone might put undue financial pressure on them.58 Yet they can ultimately benefit by shifting to electric vehicles which cost less over their lifetime to run than conventional vehicles. Schemes operating across Europe have seen minimal impacts on business. In Gothenburg, a survey of hauliers and suppliers operating within its low emission zone found that half of the respondents supported the scheme, with only 20 per cent rating it negatively.59
It is important that central government and local authorities ensure that local businesses are not made to pay unfairly for changes.
Targeted scrappage schemes help to alleviate some of these concerns, while new transport infrastructure, such as freight consolidation centres, can save money by reducing congestion, with some city centres seeing almost 80 per cent fewer trips needed.60
Targeted scrappage schemes and mobility credits
Scrappage schemes can play a major part in supporting households and businesses, and were recognised by two thirds of participants at the UK’s first national Climate Assembly as an important policy to reduce car use and support modal shift.61
Wherever possible, they should aim to discourage car use but households that need a car will ultimately benefit financially from the move away from fossil fuel to electric vehicles. But, where car journeys can be replaced by sustainable alternatives, a scrappage scheme that targets a shift to other modes of transport has the greatest economic value, from the drop in NOx and greenhouse gas emissions and the financial benefits for local residents (see page 30).62 One study suggests that a £4,000 per car mobility credit scheme in the West Midlands could cut car usage by up to 70 per cent and increase the use of public transport and car clubs.63 A trial planned for Coventry will offer £3,000 in local public transport credits to residents who scrap their car.
The best way to cut NOx and greenhouse gas emissions is to target vehicles with high mileage in city centres, such as delivery vehicles or
19
“Careful planning and mitigation measures can help to reduce the impact on those who might be disadvantaged.”
taxis. Policies which support local businesses while, mitigating against potential negative impacts, improve attitudes to clean air zones. Scrappage schemes which help businesses switch to low emission vehicles operate across Europe. In Paris, up to €9,000 is offered to small local businesses, Brussels provides €3,000 and Germany has a fund set up jointly by the government and the car industry to facilitate the transition.64
London’s ultra low emission zone (ULEZ)
Over the years, London has implemented a variety of schemes to cut air pollution. The current ULEZ, which is equivalent to a CAZ D, took effect in April 2019 and has already seen significant reductions in NOx, particulate matter and traffic levels. It achieved the following in its first ten months:65
37 per cent reduction in NO2 concentrations at central London roadsides
35 per cent reduction in NOx emissions from road transport in the central zone
Six per cent fall in CO2 emissions from road transport in the central zone
Three to nine per cent fall in traffic flows in central London
49 per cent reduction in non-compliant, more polluting vehicles, equivalent to 17,400 vehicles, detected in the zone
The ULEZ has put London on course to meet air quality targets from a low starting point. Although there was some resistance initially, the scheme has addressed fairness concerns with the following measures:
Exempting vehicles adapted for drivers with disabilities until 2025
A grace period for residents and those near the boundary to 2021
A grace period for not-for-profit buses used by community and faith groups to 2023
Exempting taxis alongside a scheme ensuring new taxi registrations are all zero emission vehicles
Exempting private hire vehicles until 2025, but only if they are wheelchair accessible
As the ULEZ expands outwards from central to Inner London in 2021, scrappage grants for small businesses, charities, low income households and residents with disabilities aim to minimise any negative impacts.
20
“Policies which support local businesses while, mitigating against potential negative impacts, improve attitudes to clean air zones.”
Addressing the bigger picture

Clean air zones should be part of wider transport reforms to towns and cities, to make them healthy, liveable communities with thriving economies.
Cross party and community support will be essential. Articulating a vision for a healthy community with less congestion, more sustainable transport and more resilient economies will help to keep everyone on board.
Edinburgh City Council’s vision for 2050 sets out the benefits of offering more space for pedestrians, making the city centre an attractive place to spend time and support local businesses, while improving access for pedestrians and bikes, and those with mobility impairments. Eighty per cent of respondents to a survey about the vision’s strategy supported the shift to car free, pedestrianised streets.66 67
A comprehensive clean air zone can also cut carbon emissions significantly, by reducing the number of cars on the road and encouraging low emission vehicles. Three quarters of local authorities across the UK have now declared a climate emergency, with this number steadily increasing, even during the pandemic.68 In 2019, domestic transport was the most polluting sector in the UK, responsible for a third of all carbon dioxide emissions.69 It makes sense to align air pollution and carbon emission reduction goals, with support from environment, planning and public health teams, to build momentum and present one coherent message.
Encouraging transport alternatives
Good alternatives to private vehicles need to be offered to enable a clean air zone to operate well. More investment in public transport and active travel will help those accustomed to using private vehicles to switch to efficient, well run, low emission alternatives.
Sixty eight per cent of the trips people take in England are below a distance of five miles but almost two thirds of these are made by car. This is a major opportunity for change. A survey carried out in Bristol demonstrated that between a fifth and a quarter of respondents might be willing to avoid using their vehicles and opt for public transport and active travel instead.70 And, in London, research suggests that up to 68 per cent of car trips could be made by bike.71 Investment and policy supporting this shift should start by addressing common barriers, including safety, parking facilities and high air pollution on cycle routes. In Copenhagen, heavy investment in cycling infrastructure means over half of the city’s residents now travel to work or education by bike (see page 31).72
Traffic congestion is the main reason people avoid buses.73 On top of a clean air zone, which can address congestion, other improvements to bus routes are needed. This should include central government
22
“It makes sense to align air pollution and carbon emission reduction goals.”
investment in the electrification of networks (see page 33). Similarly, local authorities should invest in bus lanes, urban traffic control, bus priority at traffic lights and better waiting facilities. The money raised through clean air zones can help to support this, with funds directly allocated to local transport improvements.
Workplace parking levy
A workplace parking levy (WPL) is a charge on employers which provide parking spaces regularly used by their employees. The UK’s first WPL, in Nottingham, has raised significant revenue to fund transport improvements. The charge of £379 per parking place, increasing to £428 in April 2021, raised over £9 million a year in its first seven years of operation.
The levy has funded a new tram system, demand-responsive buses, a passenger smart card, which works across all public transport, electric buses, and the refurbishment of tram and bus stations. The scheme has significantly reduced congestion in the city as businesses have cut the number of available parking spaces to reduce their levy liability, moving more commuters onto public transport.
Extrapolating the results from Nottingham, using local traffic data, we have estimated the potential economic benefits of this scheme for other cities.
Workplace parking levy: estimated annual economic benefit for UK cities from reduced congestion
(NB These are conservative estimates based on the results of the levy’s implementation in Nottingham after its first year, before money raised was invested in better public transport.)
23
“Local authorities should invest in bus lanes, urban traffic control, bus priority at traffic lights and better waiting facilities.”
City Annual economic benefit Liverpool £72.3 million Bolton £68.6 million Bury £53.4 million Manchester £88.5 million Oldham £37 million Rochdale £56.6 million Salford £75.7 million Stockport £62.4 million Tameside £39.6 million Trafford £48.5 million Wigan £64.6 million Birmingham £194.4 million Bristol £77.2 million
Car free streets
Restricting car access on local roads to make space for pedestrians and cycling can reduce carbon emissions, improve health and benefit the economy.
During the coronavirus pandemic, over fifty local authorities trialled around 200 low traffic neighbourhoods closing off local roads to avoid through traffic and dedicating the space to active travel. However, partly due to a lack of community consultation, some LTNs attracted strong opposition, and many of the trials were suspended.74 But, in areas where they have been a success, low traffic neighbourhoods have encouraged modal shift.
Implemented in 2015, Waltham Forest Council’s ‘Walthamstow Village’ scheme included a number of road closures. The scheme was set up after thorough community consultation and resulted in a 44 per cent reduction in vehicles on roads within the area and almost a third more residents walking and cycling. Only 1.7 per cent of residents said they wanted to scrap the scheme.75
Schemes to close off roads to vehicles have also been successful in cities around the world, such as Barcelona’s ‘superblocks’ policy, or Bogotá’s Ciclovía (see page 29). To assess the potential benefits of such a policy, we combined the results from the increase in walking and cycling achieved in Barcelona with the DfT approved Health Economic Assessment Tool (HEAT) model, which considers the health and carbon benefits to a population of more active travel. 76 For a city the size of Bristol, this could:
_ Save over 14,000 tonnes of CO2 emissions each year
_ Prevent 102 premature deaths over ten years
The monetised value of these benefits over ten years would be £265 million.
24
“In areas where they have been a success, low traffic neighbourhoods have encouraged modal shift in transport.”
The Birmingham plan
Birmingham City Council understands that meeting a challenging air quality target is also an opportunity to create a carbon neutral city by 2030, the target date declared in the city’s climate emergency declaration. By linking these two goals, the authority has mapped out short and long term measures that would simultaneously decrease the reliance on cars, cut carbon emissions and clean up the city’s air.
It has started with the introduction of a clean air zone (CAZ D level), expected to be in operation from June 2021, having been postponed due to Covid-19. Birmingham developed a political strategy to build cross party support and communicated its plans to the public focusing on preventable deaths.
The following policies complement the clean air zone proposals and are an example for other local authorities wanting to combine their clean air and net zero targets:77
a scrappage scheme, targeting vehicles used continuously, such as taxis, to get the most impact for the investment reallocation of road space away from private cars, including removing on street parking, prioritising bus lanes and curbing private vehicle access in the city centre to reduce pollution hotspots ending free parking in the city centre, to raise money and encourage the transition to more public transport usage
a workplace parking levy, charging £500 per parking space78
20 mph speed limits on local roads, to cut pollution from exhaust, tyre and brake wear; this also reduces accidents and makes public transport a more attractive option
segregated cycle lanes, to increase the perception of safety, and including walking and cycling infrastructure in housing developments to make active transport an easy choice
limited access for cars around schools, to encourage active travel from an early age and protect children from air pollution.
25
“Birmingham communicated its plans to the public, by focusing on preventable deaths.”
How to get clean air zones right

Air quality is a serious health and environmental issue. Local authorities have to find a solution. Action to tackle the problem is also compatible with the need to act on the climate emergency and cut carbon emissions. When clean air zones are well designed and implemented alongside other measures that improve local public transport and encourage active travel, they can help to create healthy, economically vibrant cities and towns.
Below are the actions local authorities and central government should take now to clean up the UK’s air:
Our recommendations to local authorities:
Implement the most comprehensive form of clean air zone and communicate it as part of a broader transformation plan for the area. This should include a clear plan to mitigate the impact on local businesses and residents, with financial support where necessary. Wider transformation of the transport system should include targeted action to prioritise public transport and active travel, with reallocation of road space to buses, pedestrians and cyclists, and car free streets. Local authorities should work closely with local businesses to roll out freight consolidation centres, workplace parking levies and scrappage schemes. Consult communities and businesses extensively on local transport reforms. The reason many schemes fail is due to poor local consultation. Local authorities must set a clear overarching vision for their area and work in partnership with people and businesses on the best ways to realise it in their local context.
Our recommendations to central government:
Enshrine commitment to the WHO air pollution limit in law through the Environment Bill.
This clear signal of intent by national government would indicate to local authorities and wider society that it is taking air pollution seriously. This should be supported by a national campaign to improve public perception of clean air zones and other action to reduce air pollution, making it clear their positive impact on public health, the economy and the environment.
Increase support to reduce emissions. Local authorities will need more support from central government to bring down local emissions, not only to improve air quality but also to tackle climate change at the local level. This requires long term, stable, dedicated funding for improvements to transport infrastructure. This should be based on a framework, created in partnership with local leaders, setting out the expectations of local authorities and the most effective actions they can take. It will enable local areas to promote the greater use of active travel and sustainable public transport options, which are integral to operating successful clean air zones.
27
“Local authorities will need more support from central government to bring down local emissions.”
Lessons for the UK from abroad
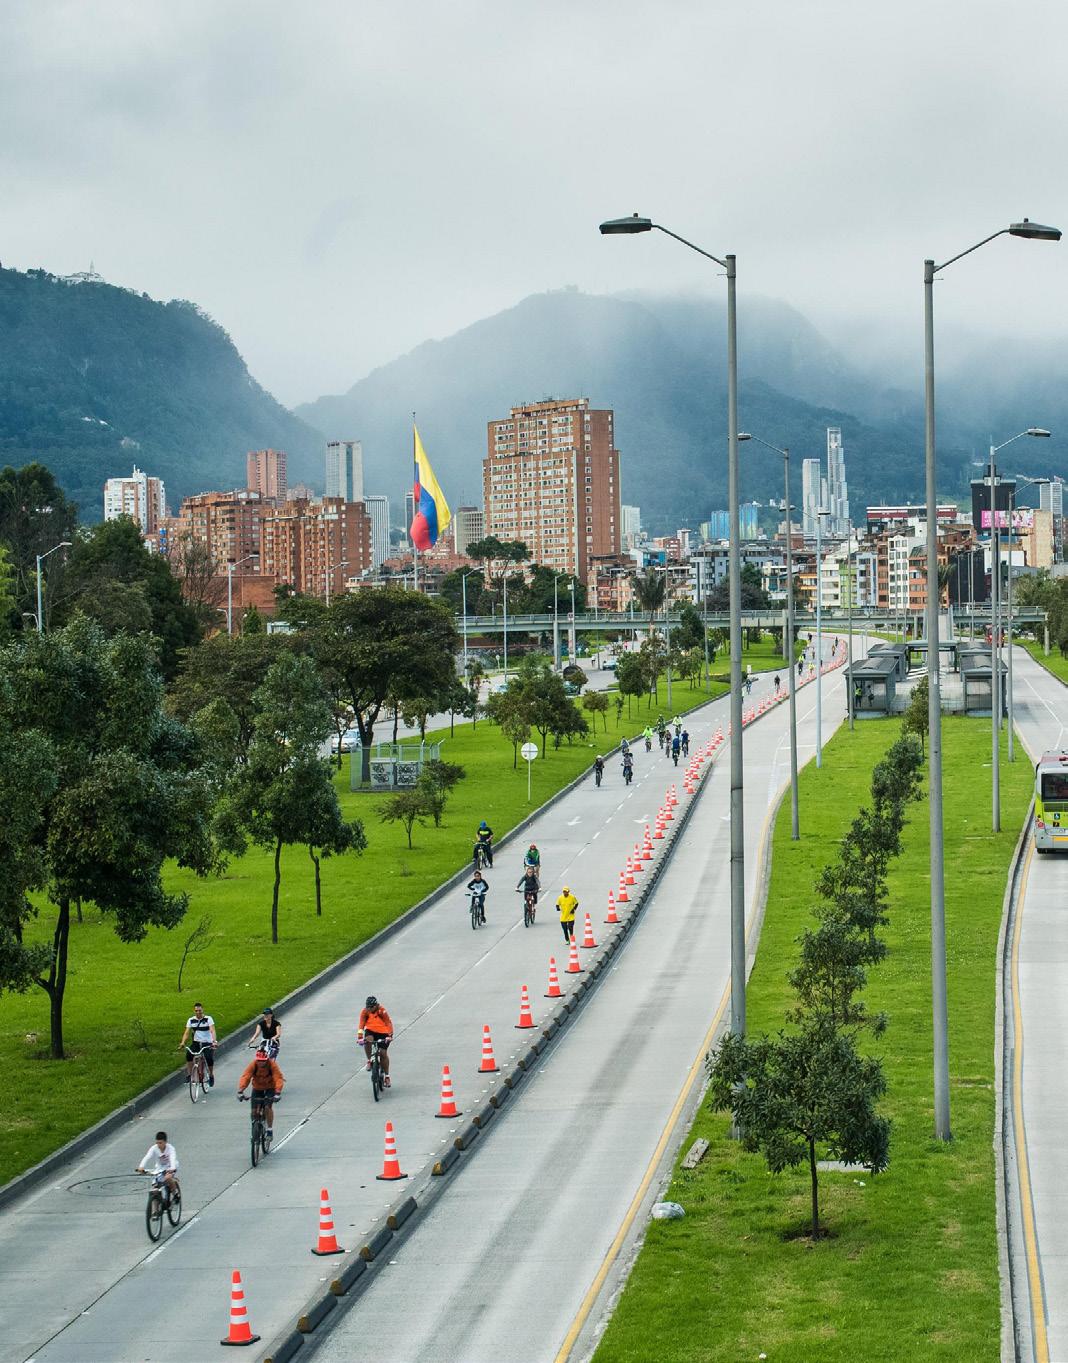
Barcelona and Bogotá: car free streets

In 2016, Barcelona set up its first ‘superblock’, an initiative which restricts access to cars and makes more space for pedestrians. Now, six areas have been appointed under the system and, by 2017, the scheme had resulted in ten per cent more walking, 30 per cent more cycling and 26 per cent less driving. Research shows that, if Barcelona rolled out all of its 503 planned ‘superblocks’ NO2 would be cut by 24 per cent, 667 premature deaths could be prevented and 65,000 people would shift to public transport and active travel. In addition, it would see annual economic benefits amounting to €1.7 billion. 79
Similar to this initiative is Ciclovía, where every Sunday and holiday Bogotá in Colombia closes 120 kilometres of roads to make way for cycling and walking. It now has more than one million weekly users, while more than 41,000 students made use of the city’s free bike school over a two year period. Due to its success, the scheme has now been replicated in many other countries.80
29
“By 2017, the scheme had resulted in ten per cent more walking, 30 per cent more cycling and 26 per cent less driving.”
Vienna, the share of
Vienna and Gent: reducing car use
In Vienna, widely supported and transformative policies to the transport system have meant the share of trips taken by car dropped by a third between 1993 to 2014. Policies to discourage driving, including a levy on large employers to help fund public transport, car free zones, traffic calming measures and limits on road construction, have been implemented with improvements to public transport, cycling and walking facilities. This has had unanimous support from local residents, politicians and businesses.81
Local authorities and their residents can benefit from adopting the ‘mobility as a service’ (MaaS) model for local transport. MaaS pulls together the various modes of transport available and facilitates multi-modal travel around an area, through an integrated platform which includes a single payment method for multiple services to help ease of use. This is better value compared to paying for individual services and integrates public and private transport to reduce competition. A trial of MaaS in Vienna found that 48 per cent of users changed their behaviour and 25 per cent combined transport modes. Usage of private cars and taxis fell amongst 20 per cent of users, and 14 per cent tried bike sharing schemes for the first time.82
Similarly, promoting car sharing, for instance through organisations like Zipcar, Liftshare or schemes to share private cars, can be a significantly cheaper option over a four year period than owning a new petrol or diesel vehicle. Car sharing continues to be cost competitive for lower usage, up to around 11,000km per year. The average annual usage of a household car in England is just over 12,000km.83 However, as car sharing becomes increasingly common and prices continue to fall, this option will become attractive to more car owners, as it becomes more cost effective than owning a new car up to around 18,000km per year.84
Cities across the world have successfully promoted car sharing as an alternative to owning a private vehicle. In Gent, Belgium, a car sharing campaign offers a subsidy of up to €4,500 if a car owner shares their car with four other residents alongside free parking for car share users and reserved parking places. Car share users have tripled in the city, from 4,000 in 2015 to 14,000 by 2020. Their ambition is to reach 25,000 users (or ten per cent of the population) by 2025.85 86 Moscow has seen a similar success, with the largest car sharing fleet seen worldwide. By the end of 2019 there were 30,000 car sharing vehicles in Moscow, with Russians spending around $15 million in 2019 on car sharing.87
30
“In
trips taken by car dropped by a third between 1993 to 2014.”
Copenhagen: investment in cycling
The number of cyclists in the UK has steadily risen over the years, with the number of miles cycled in 2019 36 per cent higher than it was 20 years ago. Despite this, cycling still only makes up one per cent of all road traffic, compared to 77 per cent for cars and taxis.88
During 2020, some positive announcements were made by national government to encourage more active travel. These included a £5 billion fund for buses and cycling and more funding for local authorities to create temporary bike lanes and expand pavements during the coronavirus pandemic. While these policies were successful at temporarily increasing uptake of cycling during the first lockdown, more recent data shows that cycling has fallen to levels even lower than the same period in previous years.89 Long term policies are necessary to ensure consistent increases in cycling uptake.
Cities in Europe are often hailed as prime examples of how active travel can play a central part in transport systems. In Copenhagen, heavy investment in improving cycling routes and safety, as well as a ‘Green Wave Route’, meaning cyclists travelling at an average speed will pass through green lights throughout their journey, has meant that 41 per cent of trips to work or education were by bicycle in 2016, compared to 24 per cent by car. In addition, there are now five times more bicycles than cars.90,91
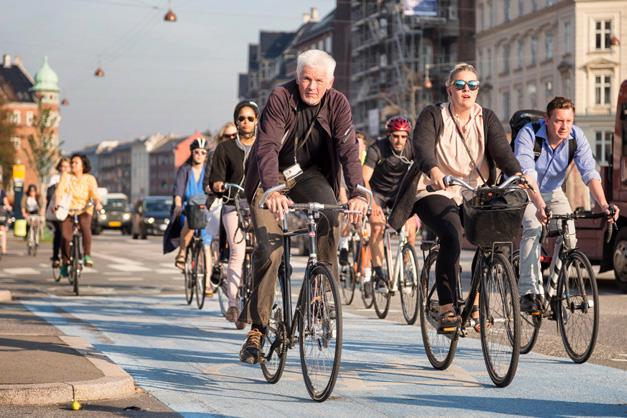
31
“Cyclists travelling at an average speed will pass through green lights throughout their journey.”
France and China: improving bus infrastructure
Despite the crucial role buses can play in tackling air quality, over the past ten years there has been a fall in England’s bus provision, with more than 3,000 services culled. A decade of decline in revenue sources has resulted in an equivalent loss of national government support for local bus services to the tune of £234 million.92 During the pandemic, some additional financial support has been made available to prevent bus services from collapsing. There is a danger that, if this support is removed too soon, bus services will find it hard to recover.93
Investment in public transport is vital to ensure a clean air zone can be successfully rolled out. In France, the ‘Versement’ public transport payroll scheme places a levy on all larger employers in towns and cities to help fund local transport. The income has been used to improve bus services and tram networks, and has been widely supported by businesses. The scheme also ensures that even small towns have a stable income stream for transport improvements.94
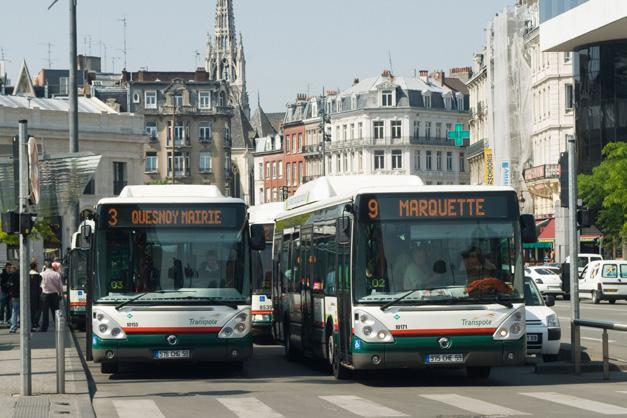
32
“In France, the ‘Versement’ public transport payroll scheme places a levy on all larger employers in towns and cities to help fund local transport.”
Investment in electric buses is urgently needed to cut air pollution. Diesel buses inflict a heavy toll on society, producing air and noise pollution and greenhouse gas emissions. There has been some success in the UK in this area: Wales is aiming for a 100 per cent electric bus fleet by 2028, and London now has the largest number of electric buses in Europe. Glasgow has also introduced its first all-electric bus route.95,96 The recently announced fund for England’s first all-electric bus cities: in Oxford and Coventry, is a good first step towards rolling out electric buses to more places across the UK, although significantly more support will be needed to achieve it.97
Shenzen, China, now has the largest fleet of electric buses in the world. The entire 160,000 bus fleet is now electric, and 40,000 charging points have been installed. As a result, CO2 emissions have fallen by 48 per cent, there have been reductions in levels of NOx, particulate matter and other pollutants, and coal use has dropped by 160,000 tonnes per year. In addition, bus operators have seen their fuel bills cut in half.98
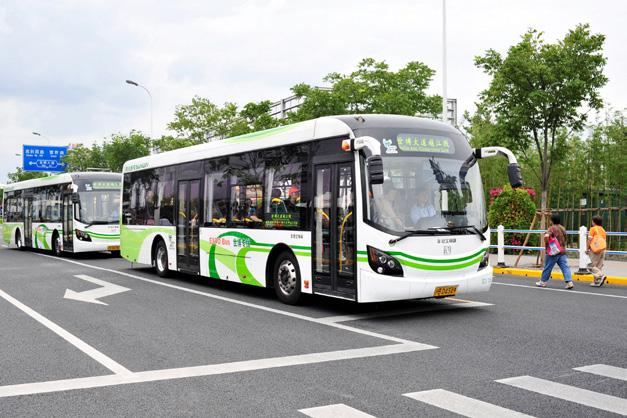
33
“Shenzen, China, now has the largest fleet of electric buses in the world.”
Endnotes
1 BBC News, December 2020, ‘Ella AdooKissi-Debrah: air pollution a factor in girl’s death, inquest finds’
2 World Health Organization, May 2018, Ambient (outdoor) air pollution
3 Royal College of Physicians, February 2016, Every breath we take: the lifelong impact of air pollution
4 World Economics Forum, April 2020, ‘The deadly link between Covid-19 and air pollution’
5 CBI Economics, September 2020, Breathing life into the UK economy
6 Transport and Environment, September 2019, Low-Emission Zones are a success – but they must now move to zero-emission mobility
7 Green Alliance, December 2020, The local climate challenge: a new partnership approach
8 Public Health England, March 2019, ‘Public Health England publishes air pollution evidence review’
9 Clean Air Fund, September 2020, ‘Reaching WHO air quality targets could boost UK economy by £1.6bn annually’
10 CBI Economics, September 2020, Breathing life into the UK economy
11 Department for Environment, Food and Rural Affairs (Defra), September 2020, ‘Emissions of air pollutants in the UK, 1970-2018, Nitrogen oxides (NOx)’
12 Defra, April 2020, ‘Concentrations of nitrogen dioxide’
13 Client Earth, October 2020, ‘UK air pollution: how clean is the air you breathe?’
14 Defra and Department for Transport (DfT), May 2017, Improving air quality in the UK: tackling nitrogen dioxide in our towns and cities
15 Centre for Cities, December 2020, How have the Covid pandemic and lockdown affected air quality in cities?
16 ClientEarth, March 2019, What do ClientEarth’s legal cases mean for local authority plans to deliver nitrogen dioxide compliance in England and Wales?
17 Air Quality News, November 2020, ‘Public call for WHO air pollution limits to be enshrined in UK law’
18 Healthy Air Campaign, October 2019, ‘British public, health organisations and MPs demand urgent action on air pollution’
19 ClientEarth, March 2021, 'Top court confirms UK has broken air pollution law'
20 Environment, Food and Rural Affairs Committee, February 2021, Air quality and coronavirus: a glimpse of a different future or business as usual
21 CBI, September 2020, ‘What is the economic potential released by achieving clean air in the UK?’
22 S Khomenko, et al, January 2021, Premature mortality due to air pollution in European cities: a health impact assessment
23 Centre for Cities, January 2020, Cities Outlook 2020
24 Environment, Food and Rural Affairs Committee, February 2021, Air quality and coronavirus: a glimpse of a different future or business as usual
25 The Independent, January 2021, ‘Government urged to include WHO air quality limits in Environment Bill’
26 Defra, January 2019, Clean Air Strategy 2019
27 Defra, July 2017, UK plan for tackling roadside national dioxide concentrations
28 Defra and DfT, February 2020, Clean Air Zone Framework
29 ClientEarth, September 2020, ‘AQU0056 – Air Quality’, written evidence to Environment, Food and Rural Affairs Parliamentary Committee
30 Environment, Food and Rural Affairs Committee, February 2021, op cit
31 Local authorities were required to produce action plans in: Defra and DfT, July 2017, UK plan for tackling roadside nitrogen dioxide concentrations
32 Defra, December 2015, 'Improving air quality in cities'
33 Environment, Food and Rural Affairs Committee, February 2021, op cit
34 Taxpayers’ Alliance, [no date], ‘Past: battling local stealth taxes – clean air zones’
34
35 K M Hymel, et al, December 2010, Induced demand and rebound effects in road transport
36 Centre for Cities, December 2020, How have the Covid pandemic and lockdown affected air quality in cities?
37 University of Birmingham, January 2020, ‘Early Covid-19 lockdown had less impact on urban air quality than first believed’
38 R Beecham, August 2020, ‘Anger at U-turn over Leeds Clean Air Zone plan’, found in the Telegraph and Argus
39 Mayor of London, November 2020, ‘Mayor unveils plans for further reduction in pollution at schools’
40 Mayor of London, February 2021, ‘Covid-19 has put a big focus on air pollution’
41 Mayor of London, April 2020, Ultra low emission zone – ten month report
42 Analysis commissioned based on data presented in: Possible and Mums for Lungs, January 2021, Schools streets: reducing children’s exposure to toxic air pollution and road danger; the data on air pollution was extracted by taking the easting and northing of each school, examining the level of NO2 and of PM2.5 in the 1km grid square containing each school, mapped against Defra’s modelled background pollution data.
43 Mayor of London, April 2020, Central London ultra low emission zone – ten month report
44 Urban Access Regulations in Europe, 2021, ‘Impact of low emission zones’
45 R B Ellison, et al, August 2013, Five years of London’s low emission zone: effects on vehicle fleet composition and air quality
46 I S Mudway, et al, January 2019, ‘Impact of London’s low emission zone on air quality and children’s respiratory health: a sequential annual cross-sectional study’
47 Mayor of London, February 2020, ‘Air pollution monitoring data in London: 2016 to 2020’
48 Transport and Environment, September 2019, Low-Emission Zones are a success – but they must now move to zero-emission mobility
49 CBI Economics, September 2020, op cit
50 Transport for Greater Manchester, February 2019, Greater Manchester’s outline business case to tackle nitrogen dioxide exceedances at the roadside: E2 modelling report; the monetised benefits are discounted to 2018 prices
51 Birmingham City Council, November 2018, Birmingham clean air zone feasibility study
52 Defra, May 2016, Committed clean air zone impact assessment draft
53 Bristol City Council, October 2019, Bristol City Council clean air plan, outline business case
54 Analysis conducted by Green Alliance. Cost and emissions savings are for the years 2021 to 2030. Based on Bristol City Council, October 2019, Bristol City Council clean air plan, outline business case, economic appraisal modelling report (1)
55 Ibid
56 J H Barnes, et al, August 2019, Emissions vs exposure: increasing injustice from road traffic-related air pollution in the United Kingdom
57 Bristol City Council, September 2019, Bristol clean air plan, transport model forecast report (T4)
58 Desmog UK, October 2020, ‘Revealed: lobby groups backed by big brands resisting clean air measures across the UK’
59 Urban Access Regulations in Europe, 2021, ‘Impact of low emission zones’
60 Travel West, no date, Case study: freight consolidation in Bristol
61 Climate Assembly UK, 2020, The path to net zero
62 BVRLA, June 2017, Economic analysis: mobility credits
63 BVRLA, March 2019, Mobility credits scrappage scheme
64 Transport and Environment, September 2019, op cit
65 Mayor of London, April 2020, op cit
66 Edinburgh City Council, May 2019, Edinburgh city centre transformation
67 Edinburgh City Council, September 2019, Edinburgh city centre transformation – finalised strategy
35
68 Climate Emergency UK, October 2020, ‘List of councils who have declared a climate emergency’
69 Department for Business, Energy and Industrial Strategy, February 2021, Final UK greenhouse gas emissions national statistics 1990-2019
70 Bristol City Council, September 2019, op cit
71 L Sloman and L Hopkinson, April 2019, Segregated cycleways and e-bikes – the future of urban travel
72 Transport for London, March 2017, Analysis of cycling potential
73 Greener Journeys, June 2016, The impact of congestion on bus passengers
74 New Statesman, November 2020, ‘Low-traffic neighbourhoods: how the culture wars came to a street near you’
75 London Borough of Waltham Forest, July 2019, Walthamstow Village review
76 We used the estimate of average and annual walking and cycling mileage in: DfT, ‘Walking and cycling statistics: England, 2018’ and created a hypothetical case of a ten per cent increase in walking and 30 per cent increase in cycling for a population the size of Bristol (c 0.5 million). The fleet assumptions and modal shift away from cars and public transport data were HEAT model v4.2.0 defaults. The monetised benefits are discounted to 2020 prices.
77 Birmingham City Council, January 2020, Birmingham transport plan
78 S Dale, et al, October 2017, ‘Evaluating the impact of a workplace parking levy on local traffic congestion: the case of Nottingham UK’
79 N Mueller, et al, September 2019, Changing the urban design of cities for health: the superblock model
80 Bloomberg Citylab, October 2018, ‘How Bogotá’s cycling superhighway shaped a generation’
81 R Buehler, et al, October 2016, Vienna’s path to sustainable transport
82 Smile simply mobile, 2014, The future of mobility
83 Department for Transport, July 2019, National Travel Survey: England 2018
84 Analysis by Element Energy for Green Alliance
85 City of Gent, 2020, ‘Subsidy for an electric shared car for private individuals’
86 Polis, July 2020, ‘Ghent and Milan win international car sharing awards’
87 S Revinova, et al, June 2020, Sharing economy in Russia: current status, barriers, prospects and role of universities
88 Cycling UK, January 2021, Cycling UK’s cycling statistics
89 DfT, January 2021, ‘Use of transport modes: Great Britain, since 1 March 2020’
90 Cycling Embassy of Denmark, July 2018, Copenhagen city of cyclists
91 A Glazener and H Khreis, March 2019, Transforming our cities: best practices towards clean air and active transportation
92 Campaign for Better Transport, October 2019, The future of the bus: future funding arrangements
93 Urban Transport Group, September 2020, The Covid-19 funding gap: the case for continuing support for urban public transport
94 Friends of the Earth and Transport for Quality of Life, January 2019, Transforming public transport
95 Mayor of London, September 2019, ‘London’s electric bus fleet becomes the largest in Europe’
96 BBC News, January 2020, ‘Electric buses launched in Glasgow in bid to cut emissions’
97 DfT, January 2021, ‘Coventry and Oxford set to be UK’s first all-electric bus cities’
98 The Guardian, December 2018, ‘Shenzhen’s silent revolution: world’s first fully electric bus fleet quietens Chinese megacity’
36
37
Green Alliance
40 Broadway
London SW1H 0BU
020 7233 7433
ga@green-alliance.org.uk
www.green-alliance.org.uk
@GreenAllianceUK
The Green Alliance Trust
Registered charity no. 1045395
Company limited by guarantee
(England and Wales) no. 3037633
Registered at the above address


