4 minute read
Methodology
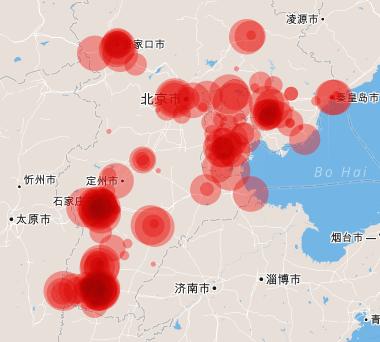
Graph: map of pollution dispersion from JJJ coal power plants
Figure 2. Jingjinji power plants’ emissions visualized on the map – each of the 200 power plants is represented by a circle, and the larger the circle, the larger the emissions from the power plant. The cities with largest power plant emissions are Shijiazhuang and Handan.
Greenpeace commissioned the U.S. air pollution modeling expert Dr. Andrew Gray to assess the PM2.5 exposure caused by Chinese coal-fired power plants. Dr. Gray has 30 years of experience in air pollution research, having worked for the U.S. government, in academic projects and as an independent consultant. Dr. Gray used the CALPUFF modeling system to evaluate the dispersion of pollutants from over 2000 operating coal-fired power plants, and the contribution these emissions make to PM2.5 levels in China. The CALPUFF modeling system is recommended by the U.S. EPA for modeling long-range transport of air pollution from point sources, such as power plant stacks. It is an advanced air pollution dispersion model that simulates the effects of time- and space-varying meteorological conditions on pollutant transport, transformation and removal. 3 The model has been applied in China earlier by a Chinese-U.S. team in Harvard University 4 . A full year of meteorological data was obtained, including data on winds,
3 http://www.src.com/calpuff/calpuff1.htm 4 Zhou et al 2006: The influence of geographic location on population exposure to emissions from power plants throughout China. Environment International 32 (2006) 365 – 373.
7
precipitation and other key meteorological variables that the model uses to calculate air pollution dispersion. Model output is PM2.5 level increases caused by power plants in each point in a 12x12km grid that covers Eastern and Central China. The modeling grid for each modeled source is 2580 km x 3480 km, using 12 km grid spacing 5 . This data was combined with high-resolution population data, matching the 2010 official census data, to estimate the number of people exposed to the pollution in each grid location, giving the total exposure caused by the power plants. The deaths caused by PM2.5 exposure were assessed using health risk models developed for the WHO Global Burden of Disease study 6 , the most up-to-date and authoritative assessment of the health impacts of PM2.5 globally, including in China. For other health impacts, the most applicable epidemiological results and official or academic data on the incidence and prevalence of different health problems was used. The emissions from the coal-fired power plants in 2011 were estimated based on average emission levels calculated from Chinese official statistics and power company CSR reports, as well as China Electricity Council plant-by-plant data on capacity, operating hours and thermal efficiency of power plants, and MEP data on installed pollution control equipment. Data on the location of the over 2000 power plants was compiled by Greenpeace. While every effort has been made to estimate the air quality and health impacts of power plants in Jingjinji as accurately as possible, there are always potential sources of error. The first of these is that if the emission data from MEP and the power companies is not accurate, this will affect the results. Secondly, Chinese authorities do not make plant-level emission data available, and the national and company level emissions need to be attributed to individual power plants using all available plant-level data. Individual power plants’ emission control performance can vary from the average, but the total health impact estimates are still quite robust, as long as the total amount of emissions is correct. Thirdly, the atmospheric simulations carried out by the current version of the CALPUFF model have been found to correspond to observations relatively well, but due to the complexity of atmospheric processes, there is always uncertainty involved. The population data is accurate enough that any uncertainty is negligible compared to the other steps. Lastly, the statistical relationships between PM2.5 exposure and health impacts have uncertainty associated with them; for example, the 95% confidence interval for the number of deaths from Jingjinji power plants is 3,600-13,900, with the best estimate being 9,800. This uncertainty affects the total impacts much more than the relative severity of the impacts of individual power plants or power plants in different provinces. Overall, Greenpeace believes that the modeling results give an unprecedentedly robust and detailed picture of the role of coal-fired power plants in Jingjinji’s air pollution problem, and the magnitude of the health impacts caused by power generation from coal in the region.
http://www.sciencedirect.com/science/article/pii/S016041200500200X 5 With the exception of sources close to the boundaries of the modeling domain. 6 Lim SS et al 2012: A comparative risk assessment of burden of disease and injury attributable to 67 risk factors and risk factor clusters in 21 regions, 1990—2010: a systematic analysis for the Global Burden of Disease Study 2010. The Lancet 380:2224-2260. http://dx.doi.org/10.1016/S0140-6736(12)61766-8
8


