3 minute read
SCIENTIFIC LANGUAGE
To communicate the results of scientific research, we use very rigorous language, which is usually accompanied by physical equations, data tables and graphs.
4.1 Physical equations
A physical equation is a mathematical formula that relates physical quantities.
For example, mean velocity is the distance an object travels in a given unit of time. Its equation is:
Relaciones de proporcionalidad
Direct proportion
When two quantities, A and B, are directly proportional, their mathematical relationship is:
Ak B =
Inverse proportion
When two quantities, A and B, are inversely proportional, their mathematical relationship is:
A B k =
In both equations, k is a constant.
This formula is not read ‘v is equal to d divided by t’. Instead, the letter ‘v’ represents average velocity, ‘d’ the distance travelled, and ‘t’ the time required to travel it. The letters in physical equations are symbols used to represent physical quantities and, since they have physical meaning, they are measurable properties.
Apart from calculating the value of quantities, physical equations are also useful for finding the proportionality of quantities. Two of the most common relationships are direct and inverse proportionalities.
Two quantities are directly proportional when you can multiply one by a number to obtain the other and they are inversely proportional when a number is divided by a quantity and you obtain the other one.
The box below shows the mathematical equations of these types of proportionality. Practise analysing them every time you see a physical equation.
Problem solved
3 Study the proportionality between the mean velocity, the distance travelled and time.
Supposing the distance travelled was 6 m and the time taken was 3 s, the mean velocity would be: v = 3 6 s m = 2 m/s
If we double the distance to 12 m, but keep the time constant at 3 s, the velocity also doubles: v = 3 12 s m = 6 m/s
If we keep the distance at 6 m and double the time to 6 s, the velocity halves: v = 6 6s m = 1 m/s
This tells us that mean velocity is directly proportional to the distance travelled, and inversely proportional to the time employed.
4.2 Tables and graphs
To study the relationship between two quantities, we design experiments in which we change the values of one of them (the independent variable) and measure the values of the other (the dependent variable). Then we organise these measurements in data tables, from which we can make graphs. To do so:
• We trace the coordinates, or axes.
• We label each one with the quantity it represents and the units in which we measured it. We put the independent variable on the abscissa (X axis) and the dependent variable on the ordinate (Y axis).
• We select a scale for each axis such that it contains the entire range of values of the variable it represents.
• We plot one point for each data pair in the table.
• We join the points with a line.
• From the data table and the graphs, we can deduce the proportionality of the quantities. The figure on the right shows the graph of the proportionalities studied. The graphs on the right show the proportional relationships you have studied.
Problem solved
4 We measure how a spring lengthens when we hang a mass on it and obtain the following data:
Common graphs
Direct linear proportionality
Does not intersect the origin.
Intersects the origin.
Inverse proportionality
Represent the data in a graph and find the relationship between mass and length.
In this case, the mass is the independent variable (it is what we are changing) and the length is the dependent variable (what we are measuring). The graph is shown on the right.
Understand, think, investigate...
17 Pressure is defined as the force exerted per unit of surface area (p = F/S). Study the proportionality between the given quantities.
18 In Problem solved 4, write the relationship between the quantities: length and mass, in words. What is k? What is its unit
We observe a directly proportional relationship, so Δl = k · m. From the data in the table, we can deduce that k = 2. So Δl = 2 · m, where Δl is measured in cm, and m in kg.
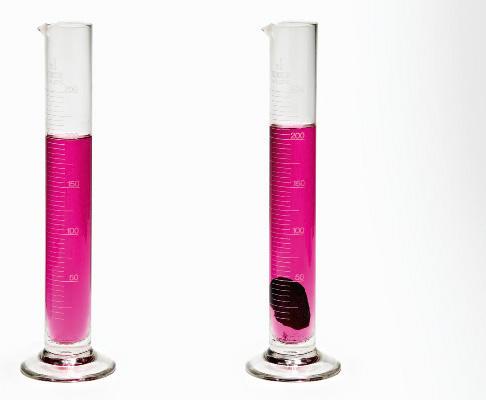
19 We measure the volume of a mineral fragment as a function of its mass. We obtain:
Draw the graph and study the V-m relationship.


