2 minute read
Data Consolidation and Refinement
Team analyzing the collected data in order to define nodes. Once all Gingerbreads within each zone were identified, the teams then distinguished smaller areas of clustered Gingerbreads based on a range of criteria, including size and condition of the Gingerbread houses, dynamics and socio-economic character of the neighborhood, commercial/residential/institutional uses, and potential stakeholders’ willingness to engage in the preservation or adaptive reuse of the historic properties, among others.
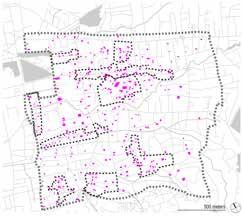
Ten nodes of Gingerbread groupings were identified. These areas varied greatly in size, from just three Gingerbread houses (Rue M) to twenty-nine Gingerbreads surrounded by substantial development (Rue du Travail). These nodes were then reassigned to the teams, who documented all buildings surrounding the already-surveyed Gingerbreads during the remaining days of fieldwork. Ultimately the teams surveyed all of the properties in each node in order to better understand the relationship between Gingerbreads and their surrounding context.
Identification of Gingerbreads.

Node boundaries delineated within the study area.
At the end of the week in Haiti, a total of 651 non-Gingerbread buildings were surveyed. Including the 356 Gingerbread houses identified, over 1,000 properties were catalogued.
Data Consolidation and Refinement. Upon returning to New York, the team began the process of cleaning and consolidating the downloaded data from KoBo in preparation for analysis. To do so, all survey results were exported into Microsoft Excel. A variety of cleaning tasks were completed, including standardizing street names, eliminating invalid data points, and removing repetitive records. The team encountered points with wrong coordinates, correcting the mistyped digit by using the average coordinates of addresses nearby. Once all GPS coordinates were plotted onto the basemap using ArcGIS, each field group matched these GPS coordinates with polygons representing building footprints, using the 2014 aerial satellite imagery provided by CNIGS, as well as in-field photographs and street address information. Fields were also added to the GIS data, including Gingerbread size and a field to note the certainty of the shape of the polygon drawn.
With the data cleaned and combined, the team conducted quantitative analyses of the Gingerbreads, as well as for all surveyed properties within the nodes. This allowed the team to assess the overall features of Gingerbreads, the general urban context of the nodes, and the building environment of the study area. The field-selected node boundaries were specified based on survey data, street maps, and the statistical and spatial analysis of each individual node.


