RamblinWreck.com
Facebook.com/gtathletics
@gtathletics
GEORGIA TECH 2011 Football
4 NATIONAL CHAMPIONSHIPS 11 CONFERENCE TITLES 15th CONSECUTIVE BOWL GAME Game 13
GEORGIA TECH SPORTS INFORMATION
GEORGIA TECH vs. UTAH rv/rv 8-4 / 5-3 ACC YELLOW JACKETS
Date...................................December 31, 2011 Time ............................................2:00 p.m. ET Television.................................................CBS Location ....................................El Paso, Texas Venue.....................Sun Bowl Stadium (50,426) Surface .............................................Field Turf
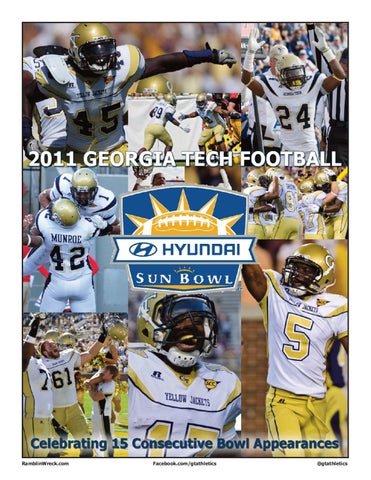
TECH’S 15th STRAIGHT BOWL WILL BE AGAINST UTAH IN THE DEC. 31 HYUNDAI SUN BOWL Georgia Tech, playing in a bowl game for the 15th consecutive season, will take on Utah Dec. 31 in the Hyundai Sun Bowl in El Paso, Texas (2:00 p.m. ET/CBS). The Yellow Jackets, 8-4 overall and 5-3 in the ACC (tied for second in the Coastal Division), will make their second Sun Bowl appearance and first since 1970. Tech will play Utah for just the second time. The Jackets, picked to finish fourth in the Coastal Division, surprised the experts with their 6-0 start while producing staggering numbers on offense. Tech went 2-4 down the stretch against an extremely difficult schedule (wins over No. 6 Clemson and on the road at Duke; losses on the road to Virginia and Miami, and home defeats against No. 10 Virginia Tech and No. 13 Georgia. Tech, one of the youngest teams in college football (just 10 scholarship seniors on the roster), leads the ACC in rushing offense (316.8 yards per game), total offense (459.6) and scoring offense (34.9).
Contact: Dean Buchan, Assistant AD /Media Relations O: 404.894.5445 C: 404.295.8703 E-mail: dbuchan@athletics.gatech.edu Twitter: @deanbuchan
nr/nr 7-5/4-5 PAC 12 UTES
Utah, 7-5 and 4-5 in the Pac-12, closed the season by winning four of its last five games and the Utes went 30 in 2011 against non-conference competition (Montana State, BYU, Pittsburgh). The Utes, 12-4 all-time in bowl games including 6-1 under coach Kyle Whittingham, was in contention for the Pac-12 South Division title until an upset loss to Colorado on Nov. 25. Utah is in its first season in the Pac-12. The only previous meeting between Georgia Tech and Utah came in the 2005 Emerald Bowl -- a 38-10 Utes’ victory in San Francisco, Calif. BRIEFLY ABOUT THE HYUNDAI SUN BOWL The Sun Bowl, along with the Sugar Bowl, are the second-oldest bowl games behind the Rose Bowl. The inaugural Sun Bowl was played in 1935. The Hyundai Sun Bowl’s association with the ACC began last year when Miami represented the league against Notre Dame. A crowd of 54,021 attended last year’s Sun Bowl.
2011 SCHEDULE/RESULTS
S1 S10 S17 S24 O1 O8 O15 O22 O29 N10 N19 N26 D31
Secondary Contact: Mike DeGeorge, Assistant SID O: 404.894.5445 C: 404.263.9478 E-mail: mdegeorge@athletics.gatech.edu
WESTERN CAROLINA ESPN3 W, 63-21 Atlanta, Ga. / Bobby Dodd Stadium (42,131) / GT leads 5-0 at Middle Tennessee State ESPN3 W, 49-21 Murfreesboro, Tenn. / Floyd Stadium (30,502) / GT leads 2-0 KANSAS RSN W, 66-24 Atlanta, Ga. / Bobby Dodd Stadium (42,025) / GT leads 2-1
Coaches: Paul Johnson (Western Carolina, ‘79) GT/Overall Record.............34-18 (4th Yr.)/141-57 (15th Yr.) Kyle Whittingham (Brigham Young, ‘84) Utah/Overall Record..............65-25 (7th Yr.)/65-25 (7th Yr.) Television: CBS. Verne Lundquist (play-by-play), Gary Danielson (analysis) and Tracy Wolfson (sidelines) call the action. Craig Silver produces and Steve Milton directs. Radio: Georgia Tech IMG Sports Network. Wes Durham (play-byplay) and former Georgia Tech quarterback Rick Strom (color). Miller Pope is the producer/engineer. National Radio: TBD Satellite Radio: Sirius -- TBD; XM TBD
NORTH CAROLINA (rv/25) ESPN W, 35-28 Atlanta, Ga. / Bobby Dodd Stadium (46,849) / GT leads 26-18-3
Twitter Updates: @gtathletics, @deanbuchan, @mikedegeorge
at NC State ABC/ESPN W, 45-35 Raleigh, N.C. / Carter-Finley Stadium (55,811) / GT leads 18-10
Opponent SID: Liz Abel (label@huntsman.utah.edu) Office: 801.581.3511
MARYLAND ESPNU W, 21-16 Atlanta, Ga. / Bobby Dodd Stadium (45,905) / GT leads 14-6 at Virginia ESPNU L, 21-24 Charlottesville, Va. / Scott Stadium (47,692) / UVA leads 17-16-1 at Miami ESPN L, 7-24 Miami Gardens, Fla. / Sun Life Stadium (43,716) / GT leads 10-6
Sun Bowl SID: Ana Chavez (achavez@sunbowl.org) Office: 801.581.3511 Websites: Georgia Tech - RamblinWreck.com Opponent - utahutes.cstv.com Sun Bowl - SunBowl.org
CLEMSON (6/6) ABC W, 31-17 Atlanta, Ga. / Bobby Dodd Stadium (55,646) / GT leads 50-25-2
Ticket Office: 1-888-TECH-TIX or ramblinwreck.com/tickets
VIRGINIA TECH (10/9) ESPN L, 26-37 Atlanta, Ga. / Bobby Dodd Stadium (50,140) / VT leads 6-3
Georgia Tech Coaching Staff Paul Johnson (Field)........................................Head Coach Brian Bohannon (Press Box)..............Quarterbacks/B-Backs Al Groh (F) ......................................Defensive Coordinator Charles Kelly (F) ...............................................Secondary Andy McCollum (PB) .........Defensive Line/Recruiting Coord. Lamar Owens (F).................................................A-Backs Al “Buzz” Preston (PB)...............................Wide Receivers Mike Sewak (F).......................................Co-Offensive Line Joe Speed (PB) .....................................Inside Linebackers Todd Spencer (PB)..................................Co-Offensive Line
at Duke ACC Network W, 38-31 Durham, N.C. / Wallace Wade Stadium (18,747) / GT leads 48-30-1 GEORGIA (13/14) ESPN L, 17-31 Atlanta, Ga. / Bobby Dodd Stadium (54,925) / UGA leads 62-39-5 Utah CBS 2:00 ET El Paso, Texas / Sun Bowl Stadium (50,426) / Utah leads 1-0
2011 GEORGIA TECH FOOTBALL
RAMBLINWRECK.COM
GEORGIA TECH HAS STRONG BOWL TRADITION With its 15th consecutive bowl appearance, Georgia Tech has a tie for the fourth-longest active streak. The Yellow Jackets trail only Florida State (30), Florida (21) and Virginia Tech (19). Tech will make its 40th bowl appearance overall, tying for the 12th-most nationally. With a record of 22-17 in bowl games, Tech has the ninth-highest bowl winning percentage nationally and a tie for the 10th-most bowl victories. Despite its long success in bowl games, the Jackets will be attempting to snap a streak of six consecutive losses in bowl games. Georgia Tech was the first school to win each of the four traditional major bowls -- the Rose, Orange, Sugar and Cotton. It completed that feat in 1955. Following the 2009 season, Tech played in a BCS bowl game -- the Orange Bowl -- against Iowa. Tech’s first bowl game was the 1929 Rose Bowl -the famous “Wrong Way Riegels” game against California. NOTING THE YELLOW JACKETS
1). Last season it had one game with two TD passes (at Wake Forest). Tech had a 100-yard receiver four times and a 100yard rusher six times this season. The Yellow Jackets have played 10 true freshmen – DB/PR Zach Laskey, LB Kyle Travis, LB Tremayne McNair, LB Nick Menocal, CB Jamal Golden, OL Shaq Mason, WR Jeff Greene, WR Darren Waller, DB Corey Dennis and LS Sean Tobin. Tech has used two players to kickoff (Justin Moore, David Scully), two placekickers (Moore, Scully), two punters (Sean Poole, Chandler Anderson), four kick returners (Orwin Smith, Tony Zenon, Roddy Jones, Embry Peeples) and two punt returners (Zach Laskey, Jemea Thomas). The Jackets are out-scoring opponents 115-55 in the first quarter and 104-44 in the third quarter, but are being out-scored 103-73 in the fourth quarter. Tech has had 141 offensive possessions this season and has scored 56 touchdowns. Georgia Tech, with a bowl game victory, could possibly finish ranked in the top 25 for the third time in the last four years. Tech began the season 6-0 for the first time since 1966 and 3-0 in the ACC for the first time since 2006.
Georgia Tech ranks in the top 20 nationally in 11 different categories: third down percentage (1st), rushing (3rd), punt return defense BRUTALLY TOUGH HOME SCHEDULE (6th), red-zone offense (12th), fewest NCAA LEADERS Georgia Tech’s final three home games penalties (12th), fewest penalty yards came against 6th-ranked Clemson (win), 3rd-Down Percentage (13th), total offense (17th), sacks allowed 10th-ranked Virginia Tech (loss) and 13th1. Georgia Tech 54.9 (17th), tackles for loss allowed (18th), scor2. TCU 54.2 ranked Georgia (loss). ing offense (19th) and passing efficiency 3. Wisconsin 54.1 The last time Tech hosted three consec(19th). 4. BYU 52.9 utive ranked teams in Bobby Dodd Stadium Georgia Tech is one of just four FBS 5. Stanford 52.2 came in 1992. The last time the Jackets schools rushing for more than 300 yards per 6. Houston 52.1 hosted three straight opponents ranked game, and the Yellow Jackets are one of 7. Boise State 51.5 13th or higher came in 1959. 8. Oklahoma State 50.0 eight teams that have converted at least 50 9. Nevada 49.1 A fourth home opponent, North Carolina, percent of their third-down attempts. 10. Northwestern 49.1 was not ranked in the AP poll, but was The Yellow Jackets finished tied for ranked 25th in the Coaches poll, when the second in the ACC’s Coastal Division despite Rushing Offense two teams met back in September. preseason predictions that picked Tech 1. Army 350.9 fourth. 3. Air Force 320.3 JOHNSON: IMPRESSIVE NUMBERS 3. Georgia Tech 316.8 Junior OL Omoregie Uzzi (first team) 4. Navy 313.7 Between 1967 and Paul Johnson’s arand junior LB Julian Burnett (second team) 5. Oregon 295.7 rival in 2008, Georgia Tech went 2-29-1 at were named All-ACC. Junior CB Rod Sweet6. Utah State 277.5 home against teams ranked in the top 10. ing and sophomore OLB Jeremiah At7. Temple 256.7 Johnson is 2-1 at home against top-10 taoachu were named honorable mention 8. Nevada 251.8 teams -- a win over No. 4 Virginia Tech in All-ACC. 9. Northern Illinois 247.6 10. Wisconsin 237.4 2009, a victory against No. 6 Clemson Oct. With a win in the bowl game, Tech 29 and a loss to No. 10 Virginia Tech on would have nine wins for the third time in Punt Return Defense Nov. 10. four seasons under Paul Johnson and for 1. LSU 0.35 Johnson is 6-2 at home against teams the 10th time in the last 55 years. 2. Louisville 0.42 ranked in the top 25. The Jackets are 485 yards shy of pro3. Northern Illinois 1.00 Since Bobby Dodd retired after the ducing 6,000 yards of total offense for the 4. Ohio 2.00 5. South Florida 2.11 1966 season, only one Georgia Tech coach season. 6. Georgia Tech 3.73 -- George O’Leary (.612) -- won 60 percent There are just 10 scholarship seniors 7. Arkansas State 3.83 of his games. Johnson’s win percentage is on the Tech roster (11 total). 8. San Diego State 4.00 .654. The Yellow Jackets have produced 9. Virginia Tech 4.12 Johnson is the first coach in Georgia eight one-play touchdown drives. Last sea10. Utah 4.23 Tech history to win eight or more games in son Tech had zero. three of his first four seasons. Tech has produced seven touchdown Johnson has at least eight wins in 13 of his 15 seadrives of 90 yards or longer, which are the most by any sons as a head coach. team nationally. The Jackets have seven TD drives that With the Oct. 8 win over Maryland, Johnson became lasted seven minutes or longer. just the fourth ACC coach to defeat all 11 conference op Junior quarterback Tevin Washington, senior Roddy ponents. Johnson joins Bobby Bowden, Frank Beamer Jones and junior Orwin Smith give Tech three current caand Tom O’Brien. reer 1,000-yard rushers. Senior Embry Peeples enters the Johnson is 12-3 at Tech in games decided by five bowl game just 24 yards shy of 1,000 career rushing points or less. yards. Johnson’s Tech teams are 22-1 when scoring more Smith averages 10.3 yards per carry and has rushed than 30 points. for a touchdown once every 5.45 carries (11 TDs, 60 attempts). Johnson is the first coach in ACC history to be named Coach of the Year in each of his first two seasons. Nine of junior Stephen Hill’s 26 receptions have been of 40 yards or longer, including three 70 yards or longer. JOHNSON’S RECORD WHEN... Hill averages more yards per reception (30.2) than any 7-6 vs. nationally-ranked opponents player in all of the NCAA, regardless of division. 16-2 when holding opponents to 20 points or less Junior linebacker Julian Burnett ranks fifth in the 20-5 at home in four years under Johnson ACC and 32nd nationally in tackles (113). He has 44 more 22-1 when scoring more than 30 points tackles than any other Tech player. 26-4 when leading at halftime Coach Paul Johnson is 12-3 at Tech in games de29-2 when leading after three quarters cided by five points or less. 31-7 when scoring at least 20 points Tech threw at least two touchdown passes in a game four times this season (but no TD passes since Oct.
2011 GEORGIA TECH FOOTBALL
2011 ACC STANDINGS Coastal Division ACC Virginia Tech . . . . . . . . . . . . . . . . .7-1 Georgia Tech . . . . . . . . . . . . . . . . .5-3 Virginia . . . . . . . . . . . . . . . . . . . . .5-3 Miami . . . . . . . . . . . . . . . . . . . . . .3-5 North Carolina . . . . . . . . . . . . . . . .3-5 Duke . . . . . . . . . . . . . . . . . . . . . . .1-7
Overall . . . . .11-2 . . . . . .8-4 . . . . . .8-4 . . . . . .6-6 . . . . . .7-5 . . . . . .3-9
Atlantic Division ACC Clemson . . . . . . . . . . . . . . . . . . . .6-2 Florida State . . . . . . . . . . . . . . . . .5-3 Wake Forest . . . . . . . . . . . . . . . . .5-3 NC State . . . . . . . . . . . . . . . . . . . .4-4 Boston College . . . . . . . . . . . . . . . .3-5 Maryland . . . . . . . . . . . . . . . . . . . .1-7
Overall . . . . .10-3 . . . . . .7-5 . . . . . .6-6 . . . . . .7-5 . . . . . .4-8 . . . . .2-10
ACC BOWL SCHEDULE Monday, December 26th AdvoCare V100 Independence Bowl, 5:00 Shreveport, La. / ESPN2 North Carolina (7-5) vs. Missouri (7-5) Tuesday, December 27th Belk Bowl, 8:00 Charlotte, NC / ESPN NC State (7-5) vs. Louisville (7-5) Thursday, December 29th Champs Sports Bowl, 6:30 Orlando, Fla. / ESPN Florida State (8-4) vs. Notre Dame (8-4) Friday, December 30th Franklin American Mortgage Music City Bowl, 6:40 Nashville, Tenn. / ESPN Wake Forest (6-6) vs. Mississippi State (6-6) Saturday, December 31st Hyundai Sun Bowl, 2:00 El Paso, Texas / CBS Georgia Tech (8-4) vs. Utah (7-5) Saturday, December 31st Chick-fil-A Bowl, 7:30 Atlanta, Ga. / ESPN Virginia (8-4) vs. Auburn (7-5) Tuesday, January 3rd Allstate Sugar Bowl , 8:30 New Orleans, La. / ESPN Virginia Tech (11-2) vs. Michigan (9-3) Wednesday, January 4th Discover Orange Bowl, 8:00 Miami Gardens, Fla. / ESPN Clemson (10-3) vs. West Virginia (9-3)
GET SOCIAL
facebook.com/gtathletics twitter.com/gtathletics youtube.com/ramblinwrecktube gtathletics.tumblr.com
RAMBLINWRECK.COM
GEORGIA TECH’S BOWL CALENDAR MONDAY (Dec. 12)
TUESDAY (Dec. 13)
WEDNESDAY (Dec. 14)
THURSDAY (Dec. 15)
FRIDAY (Dec. 16)
SATURDAY (Dec. 17)
SUNDAY (Dec. 18)
3:45 -- Practice (closed) (Tentative) Requested players, coaches available after practice
TBD -- Practice (Tentative)
3:45 -- Practice (closed) (Tentative) Requested players, coaches available after practice
Off
Off
2:00 -- Georgia Tech Commencement (Chandler Anderson, Preston Lyons, B.J. Machen and Steven Sylvester will graduate)
Off
TBD -- Practice (Tentative) MONDAY (Dec. 19)
TUESDAY (Dec. 20)
WEDNESDAY (Dec. 21)
THURSDAY (Dec. 22)
FRIDAY (Dec. 23)
SATURDAY (Dec. 24)
SUNDAY (Dec. 25)
TBD -- Practice
TBD -- Practice
Off
Off
Off
Off
MERRY CHRISTMAS!
MONDAY (Dec. 26)
TUESDAY (Dec. 27)
WEDNESDAY (Dec. 28)
THURSDAY (Dec. 29)
FRIDAY (Dec. 30)
SATURDAY (Dec. 31)
SUNDAY (Jan. 1)
Travel to El Paso
9:00 AM -- Head coaches press conference (Hawthorn Inn & Suites)
TBD
9:00-10:30 AM Coordinators press conference (Hawthorn Inn & Suites) 9:00 -- Utah 9:45 -- Georgia Tech (Paul Johnson/Al Groh)
10:30 AM -- Head coach press conference (Judson F. Williams Convention Center) 11:30 -- Rotary Sun Bowl Team Luncheon (Judson F. Williams Convention Center)
2:00 ET -- Hyundai Sun Bowl (El Paso, Texas) Georgia Tech vs. Utah CBS
2011-12 COLLEGE FOOTBALL BOWL SCHEDULE Bowl Game Gildan New Mexico Famous Idaho Potato R+L Carriers New Orleans Beef O’Brady’s St. Petersburg San Diego County Credit Union Poinsietta MAACO Las Vegas Sheraton Hawai’i AdvoCare V100 Independence Little Caesars Pizza Belk Military presented by Northrop Grumman Bridgepoint Education Holiday Champs Sports Valero Alamo Bell Helicopter Armed Forces New Era Pinstripe Franklin American Mortgage Music City Insight Meineke Car Care of Texas Hyundai Sun Bowl AutoZone Liberty Kraft Fight Hunger Chick-fil-A TicketCity Capital One Outback Gator Rose Bowl Game presented by VIZIO Allstate Sugar Discover Orange Tostitos Fiesta AT&T Cotton BBVA Compass GoDaddy.com Allstate BCS National Championship
Date/Time (ET) Dec. 17 / 2 p.m. Dec. 17 / 5:30 p.m. Dec. 17 / 9 p.m. Dec. 20 / 8 p.m. Dec. 21 / 8 p.m. Dec. 22 / 8 p.m. Dec. 24 / 8 p.m. Dec. 26 / 5 p.m. Dec. 27 / 4:30 p.m. Dec. 27 / 8 p.m. Dec. 28 / 4:30 p.m. Dec. 28 / 8 p.m. Dec. 29 / 5:30 p.m. Dec. 29 / 9 p.m. Dec. 30 / 12 p.m. Dec. 30 / 3:20 p.m. Dec. 30 / 6:40 p.m. Dec. 30 / 10 p.m. Dec. 31 / 12 p.m. Dec. 31 / 2 p.m. Dec. 31 / 3:30 p.m. Dec. 31 / 3:30 p.m. Dec. 31 / 7:30 p.m. Jan. 2 / 12 p.m. Jan. 2 / 1 p.m. Jan. 2 / 1 p.m. Jan. 2 / 1 p.m. Jan. 2 / 5 p.m. Jan. 3 / 8:30 p.m. Jan. 4 / 8:30 p.m. Jan. 5 / 8:30 p.m. Jan. 6 / 8 p.m. Jan. 7 / 1 p.m. Jan. 8 / 9 p.m. Jan. 9 / 8:30 p.m.
Site Albuquerque, N.M. Boise, Idaho New Orleans, La. St. Petersburg, Fla. San Diego, Calif. Las Vegas, Nev. Honolulu, Ha. Shreveport, La. Detroit, Mich. Charlotte, N.C. Washington, D.C. San Diego, Calif. Orlando, Fla. San Antonio, Texas Fort Worth, Texas New York, N.Y. Nashville, Tenn. Tempe, Ariz. Houston, Texas El Paso, Texas Memphis, Tenn. San Francisco, Calif. Atlanta, Ga. Dallas, Texas Orlando, Fla. Tampa, Fla. Jacksonville, Fla. Pasadena, Calif. New Orleans, La. Miami, Fla. Glendale, Ariz. Arlington, Texas Birmingham, Ala. Mobile, Ala. New Orleans, La.
TECH BY-THE-BOWL Matchup Network Temple vs. Wyoming ESPN Ohio vs. Utah State ESPN San Diego State vs. La.-Lafayette ESPN Florida International vs. Marshall ESPN TCU vs. Louisiana Tech ESPN Arizona State vs. Boise State ESPN Nevada vs. Southern Miss ESPN North Carolina vs. Missouri ESPN2 Western Michigan vs. Purdue ESPN NC State vs. Louisville ESPN Toledo vs. Air Force ESPN Texas vs. California ESPN Florida State vs. Notre Dame ESPN Washington vs. Baylor ESPN Tulsa vs. BYU ESPN Rutgers vs. Iowa State ESPN Wake Forest vs. Mississippi State ESPN Iowa vs. Oklahoma ESPN Northwestern vs. Texas A&M ESPN GEORGIA TECH vs. Utah CBS Cincinnati vs. Vanderbilt ABC Illinois vs. UCLA ESPN Virginia vs. Auburn ESPN Houston vs. Penn State ESPNU Nebraska vs. South Carolina ESPN Michigan State vs. Georgia ABC Ohio State vs. Florida ESPN2 Oregon vs. Wisconsin ESPN Virginia Tech vs. Michigan ESPN Clemson vs. West Virginia ESPN Oklahoma State vs. Stanford ESPN Kansas State vs. Arkansas FOX SMU vs. Pittsburgh ESPN Arkansas State vs. N. Illinois ESPN LSU vs. Alabama ESPN
SUN BOWL HISTORY In most of its early history, the game pitted the champion of the Border Conference against an at-large opponent. Games are now played at Sun Bowl Stadium on the campus of the University of Texas at El Paso. The first three were played at El Paso High School Stadium (1935–1937), then switched to Kidd Field until the present stadium was ready in 1963. For its first 24 years of existence the game was played on January 1 (New Year's Day) or January 2; since then, with the exception of a January 2 game in 1977, the game has been played in December with the last 15 games played on or near December 31.
2011 GEORGIA TECH FOOTBALL
All American Bowl (1-0) 1985 Georgia Tech 17, Michigan State 14 Aloha Bowl (1-0) 1991 Georgia Tech 18, Stanford 17 Bluebonnet Bowl (0-1) 1962 Missouri 14, Georgia Tech 10 Carquest Bowl (1-0) 1997 Georgia Tech 35, West Virginia 30 Champs Sports Bowl (1-0) 2004 Georgia Tech 51, Syracuse 14 Cotton Bowl (1-1) 1943 Texas 14, Georgia Tech 7 1955 Georgia Tech 14, Arkansas 6 Emerald Bowl (0-1) 2005 Utah 38, Georgia Tech 10 Florida Citrus Bowl (1-0) 1991 Georgia Tech 45, Nebraska 21 Gator Bowl (3-4) 1956 Georgia Tech 21, Pittsburgh 14 1960 Arkansas 14, Georgia Tech 7 1961 Penn State 30, Georgia Tech 15 1965 Georgia Tech 31, Texas Tech 21 1999 Georgia Tech 35, Notre Dame 28 2000 Miami 28, Georgia Tech 13 2007 West Virginia 38, Georgia Tech 35 Humanitarian Bowl (1-1) 2004 Georgia Tech 52, Tulsa 10 2007 Fresno State 40, Georgia Tech 28 Independence Bowl (0-1) 2010 Air Force 14, Georgia Tech 7 Liberty Bowl (1-0) 1972 Georgia Tech 31, Iowa State 30 Oil Bowl (1-0) 1947 Georgia Tech 41, St. Mary’s 19 Orange Bowl (3-3) 1940 Georgia Tech 21, Missouri 7 1945 Tulsa 26, Georgia Tech 12 1948 Georgia Tech 20, Kansas 14 1952 Georgia Tech 17, Baylor 14 1967 Florida 27, Georgia Tech 12 2010 Iowa 24, Georgia Tech 14 Chick-fil-A/Peach Bowl (0-4) 1971 Mississippi 41, Georgia Tech 18 1978 Purdue 41, Georgia Tech 21 2000 LSU 28, Georgia Tech 14 2008 LSU 38, Georgia Tech 3 Rose Bowl (1-0) 1929 Georgia Tech 8, California 7 Seattle Bowl (1-0) 2001 Georgia Tech 24, Stanford 14 Silicon Valley Classic (0-1) 2002 Fresno State 30, Georgia Tech 21 Sugar Bowl (4-0) 1944 Georgia Tech 20, Tulsa 18 1953 Georgia Tech 24, Mississippi 7 1954 Georgia Tech 42, West Virginia 19 1956 Georgia Tech 7, Pittsburgh 0 Sun Bowl (1-0) 1970 Georgia Tech 17, Texas Tech 9
RAMBLINWRECK.COM
Georgia Tech Bowl Results DATE Dec. 27, 2010 Jan. 5, 2010 Dec. 31, 2008 Dec. 31, 2007 Jan. 1, 2007 Dec. 29, 2005 Dec. 21, 2004 Jan. 4, 2004 Dec. 31, 2002 Dec. 27, 2001 Dec. 29, 2000 Jan. 1, 2000 Jan. 1, 1999 Dec. 29, 1997 Dec. 25, 1991 Jan. 1, 1991 Dec. 31, 1985 Dec. 25, 1978 Dec. 18, 1972 Dec. 30, 1971 Dec. 19, 1970 Jan. 2, 1967 Jan. 1, 1966 Dec. 22, 1962 Dec. 30, 1961 Jan. 2, 1960 Dec. 29, 1956 Jan. 2, 1956 Jan. 2, 1956 Jan. 1, 1954 Jan. 1, 1953 Jan. 1, 1952 Jan. 1, 1948 Jan. 1, 1947 Jan. 1, 1945 Jan. 1, 1944 Jan. 1, 1943 Jan. 1, 1940 Jan. 1, 1929
BOWL Independence Bowl FedEx Orange Bowl Chick-fil-A Bowl Humanitarian Bowl Gator Bowl Emerald Bowl Champs Sports Bowl Humanitarian Bowl Silicon Valley Classic Seattle Bowl Chick-fil-A Bowl Gator Bowl Gator Bowl Carquest Bowl Aloha Bowl Florida Citrus Bowl All-American Bowl Peach Bowl Liberty Bowl Peach Bowl Sun Bowl Orange Bowl Gator Bowl Bluebonnet Bowl Gator Bowl Gator Bowl Gator Bowl Sugar Bowl Cotton Bowl Sugar Bowl Sugar Bowl Orange Bowl Orange Bowl Oil Bowl Orange Bowl Sugar Bowl Cotton Bowl Orange Bowl Rose Bowl
CITY Shreveport, La. Miami Gardens, Fla. Atlanta, Ga. Boise, Idaho Jacksonville, Fla. San Francisco, Calif. Orlando, Fla. Boise, Idaho San Jose, Calif. Seattle, Wash. Atlanta, Ga. Jacksonville, Fla. Jacksonville, Fla. Miami, Fla. Honolulu, Hawaii Orlando, Florida Birmingham, Ala. Atlanta, Ga. Memphis, Tenn. Atlanta, Ga. El Paso, Texas Miami, Fla. Jacksonville, Fla. Houston, Texas Jacksonville, Fla. Jacksonville, Fla. Jacksonville, Fla. New Orleans, La. Dallas, Texas New Orleans, La. New Orleans, La. Miami, Fla. Miami, Fla. Houston, Texas Miami, Fla. New Orleans, La. Dallas, Texas Miami, Fla. Pasadena, Calif.
RESULT Air Force 14 Iowa 24 LSU 38 Fresno State 40 West Virginia 38 Utah 38 Georgia Tech 51 Georgia Tech 52 Fresno State 30 Georgia Tech 24 LSU 28 Miami 28 Georgia Tech 35 Georgia Tech 35 Georgia Tech 18 Georgia Tech 45 Georgia Tech 17 Purdue 41 Georgia Tech 31 Mississippi 41 Georgia Tech 17 Florida 27 Georgia Tech 31 Missouri 14 Penn State 30 Arkansas 14 Georgia Tech 21 Georgia Tech 7 Georgia Tech 14 Georgia Tech 42 Georgia Tech 24 Georgia Tech 17 Georgia Tech 20 Georgia Tech 41 Tulsa 26 Georgia Tech 20 Texas 14 Georgia Tech 21 Georgia Tech 8
Georgia Tech 7 Georgia Tech 14 Georgia Tech 3 Georgia Tech 28 Georgia Tech 35 Georgia Tech 10 Syracuse 14 Tulsa 10 Georgia Tech 21 Stanford 14 Georgia Tech 14 Georgia Tech 13 Notre Dame 28 West Virginia 30 Stanford 17 Nebraska 21 Michigan St. 14 Georgia Tech 21 Iowa State 30 Georgia Tech 18 Texas Tech 9 Georgia Tech 12 Texas Tech 21 Georgia Tech 10 Georgia Tech 15 Georgia Tech 7 Pittsburgh 14 Pittsburgh 0 Arkansas 6 West Virginia 19 Mississippi 7 Baylor 14 Kansas 14 St. Mary’s 19 Georgia Tech 12 Tulsa 18 Georgia Tech 7 Missouri 7 California 7
NOTE Tevin Washington rushes for 131 yards, but special teams prove costly Tech digs 14-point hole early in first ever BCS bowl appearance Charles Scott runs for three TDs, Tech loses in backyard State scores 27 unanswered points after Tech’s early 7-0 lead Tashard Choice’s 169 yards not enough, Pat White leads WV Utah rolls up 550 yards of offense, blanks Tech in second half Tech has 514 yards of total offense, Reggie Ball throws for 2 TDs P.J. Daniels rushes for 307 yards, four TDs, Tech defense shines Tech makes strong rally, but Bulldogs score game’s final 10 points Godsey, Campbell, interim coach lead Tech in first Seattle Bowl Tech can’t overcome six turnovers, lose to Nick Saban’s Tigers Five-game bowl win streak ends, two ‘Canes rush for 100 yards Joe Hamilton threw three TD passes and caught another MVP Joe Hamilton has 356 yards total offense, three touchdowns Jimy Lincoln’s 2-point conversion with 14 seconds left seals win Tech clinches UPI national title behind MVP QB Shawn Jones Malcolm King runs for 122 yards and scores winning TD late With Eddie Lee Ivery out with injury, Tech has 12 yards rushing Back-up QB Jim Stevens throws for 3 TDs, ISU fails on 2-pointer Despite 317 yards total offense, Tech blown out in Atlanta bowl Jacket defense pitches first-half shut out, builds 10-0 lead Steve Spurrier quarterbacks Gators past Bobby Dodd, Jackets QB Jerry Priestley’s 1-yard TD early in fourth quarter keys Jackets MU’s Bill Tobin runs for 114 yards, Tech throws four interceptions Tech bolts to 9-0 lead, but State’s Galen Hall passes for 3 TDs Former Tech star Frank Broyles coaches Razorbacks to win Tech wins sixth straight bowl, beats Pitt for second straight year Wade Mitchell scores only TD, Tech wins fifth straight major bowl Jackets complete “grand slam” with wins in all four major bowls Tech unleashes aerial attack, completing 20-of-35 for 268 yards National championship clinched after scoring 24 straight points Pepper Rodgers’ field goal secures win, 11-0-1 season for Tech Tech forces fumble inside 1-yard line to foil Kansas’ frenzied rally Yellow Jackets pick off eight St. Mary’s passes in the rain and mud Frank Broyles’ 304-yard passing effort can’t overcome 20-0 deficit Tech overcomes 18-7 second-half deficit, blanks Tulsa in 2nd half Gallant Tech comeback falls short when drive stalls on 3-yard line 21 straight points makes first of five Orange Bowl trips a success Wrong Way Riegels helps Golden Tornado to perfect 10-0 season
Georgia Tech Bowl Superlatives TEAM RECORDS Points: 52 vs. Tulsa (2004 Humanitarian) Fewest Points Allowed: 0 vs. Pittsburgh (1956 Sugar) Total Offense: 514 vs. Syracuse (2004 Champs) Fewest Total Offense Allowed: 66 vs. California (1929 Rose) Rushing: 371 vs. Tulsa (2004 Humanitarian) Fewest Rushing Yards Allowed: - 52 vs. Tulsa (2004 Humanitarian) Rushing Attempts: 79 vs. Texas Tech (1965 Gator) Fewest Rushing Attempts Allowed: 22 vs. Texas Tech (1965 Gator), West Virginia (1997 Carquest) Passing Yards: 326 vs. West Virginia (2007 Gator) Fewest Passing Yards Allowed: 0 vs. Missouri (1962 Bluebonnet) Pass Completions: 23 vs. Stanford (2001 Seattle) Fewest Pass Completions Allowed: 0 vs. Missouri (1962 Bluebonnet) Pass Attempts: 40 vs. Miami (2000 Gator) Fewest Pass Attempts Allowed: 0 vs. Missouri (1962 Bluebonnet) INDIVIDUAL RECORDS Yards Rushing: 307, P.J. Daniels vs. Tulsa, (2004 Humanitarian) *NCAA Bowl Record Rushing Attempts: 33, Lenny Snow vs. Texas Tech (1965 Gator Bowl) Pass Attempts: 40, Joe Hamilton vs. Miami, (2000 Gator) Pass Completions: 23, George Godsey vs. Stanford (2001 Seattle) Yards Passing: 326, Taylor Bennett vs. West Virginia (2007 Gator) Completion Pct.: .696 (16-23), Shawn Jones vs. Nebraska (1991 Citrus) Total Offense: 356, Joe Hamilton vs. West Virginia (1997 Carquest) (274 pass, 82 rush) Receptions: 10, Kelly Campbell vs. Stanford, (2001 Seattle) Yards Receiving: 186, Calvin Johnson vs. West Virginia (2007 Gator) Touchdowns: 4, P.J. Daniels vs. Tulsa (2004 Humanitarian) TDs Rushing: 4, P.J. Daniels vs. Tulsa (2004 Humanitarian)
2011 GEORGIA TECH FOOTBALL
TD Passes: 3, Jim Still vs. Kansas (1948 Orange); Pepper Rodgers vs. WVU (1954 Sugar); Jim Stevens vs. Iowa St. (1972 Liberty); Joe Hamilton vs. Notre Dame (1999 Gator); Taylor Bennett vs. WVU (2007 Gator) TD Receptions: 2, George Brodnax vs. St. Mary’s (1947 Oil); Jim Patton vs. Kansas (1948 Orange); Dez White vs. Notre Dame (1999 Gator); Calvin Johnson vs. WVU (2007 Gator) Points: 24, P.J. Daniels vs. Tulsa (2004 Humanitarian) Points by Kicking: 9, Scott Sisson vs. Nebraska (1991 Citrus) Field Goals: 2, Luke Manget vs. Miami (2000 Gator) PATs: 7, Travis Bell vs. Syracuse (2004 Champs) Interceptions: 2, Tom Bleick vs. Texas Tech (1965 Gator); Rick Lewis vs. Texas Tech (1970 Sun) Tackles: 16, Ron Rogers vs. West Virginia (1997 Carquest) Longest Run: 68 yards (TD), Joseph Auer vs. Penn State (1961 Gator) Longest Pass: 80 yards (TD), Reggie Ball to Nate Curry (2004 Champs) Longest Field Goal: 40 yards, David Bell vs. Michigan State (1985 All American) Longest Interception Return: 73 yards, W.P. McHugh vs. St. Mary’s (1947 Oil Bowl) Longest Kickoff Return: 43 yards, Drew Hill vs. Purdue (1978 Peach) Longest Punt Return: 63 yards, Willie Clay vs. Stanford (1991 Aloha) Longest Punt: 67 yards, Jason Bender vs. Stanford (1991 Aloha) Best Punting Avg: 49.1 (7 punts), Chandler Anderson vs. Iowa (2010 Orange) INDIVIDUAL CAREER LEADERS Rushing: P.J. Daniels (3), 535 yds, 68 att Passing: Joe Hamilton (3), 756 yds Pass Attempts: Joe Hamilton (3), 96 att Pass Completions: Joe Hamilton (3), 52 cmp TD Passes: Pepper Rodgers (2), 5 TD Total Offense: Joe Hamilton (3), 906 yds Receptions: Kelly Campbell (4), 18 rec , 176 yds Receiving Yards: Calvin Johnson (3), 266 yds, 13 rec Touchdowns: P.J. Daniels (3), 6 TD
MOST BOWL VICTORIES Rk. School 1. Alabama . . . . . . . . . 2. Southern California . . 3. Penn State . . . . . . . . 4. Georgia . . . . . . . . . . Oklahoma . . . . . . . . 6. Tennessee . . . . . . . . Texas . . . . . . . . . . . 8. Nebraska . . . . . . . . . 9. Florida State . . . . . . 10. Georgia Tech . . . . . LSU . . . . . . . . . . . . . 12. Mississippi . . . . . . . . Auburn . . . . . . . . . . 14. Ohio State . . . . . . . . 15. Michigan . . . . . . . . .
. . . . . . . . . . . . . . .
. . . . . . . . . . . . . . .
. . . . . . . . . . . . . . .
. . . . . . . . . . . . . . .
. . . . . . . . . . . . . . .
. . . . . . . . . . . . . . .
. . . . . . . . . . . . . . .
. . . . . . . . . . . . . . .
. . . . . . . . . . . . . . .
. . . . . . . . . . . . . . .
. . . . . . . . . . . . . . .
. . . . . . . . . . . . . . .
. . . . . . . . . . . . . . .
. . . . . . . . . . . . . . .
. . . . . . . . . . . . . . .
Wins . . .33 . . .32 . . .27 . . .26 . . .26 . . .25 . . .25 . . .24 . . .23 . . .22 . . .22 . . .21 . . .21 . . .20 . . .19
MOST BOWL APPEARANCES Rk. School Appearances 1. Alabama . . . . . . . . . . . . . . . . . . . . . . . . . . . 59 2. Texas . . . . . . . . . . . . . . . . . . . . . . . . . . . . .50 3. Tennessee . . . . . . . . . . . . . . . . . . . . . . . . . 49 4. Southern California . . . . . . . . . . . . . . . . . . . .48 Nebraska . . . . . . . . . . . . . . . . . . . . . . . . . . .48 6. Georgia . . . . . . . . . . . . . . . . . . . . . . . . . . . .47 7. Oklahoma . . . . . . . . . . . . . . . . . . . . . . . . . .45 8. Penn State . . . . . . . . . . . . . . . . . . . . . . . . . .44 9. LSU . . . . . . . . . . . . . . . . . . . . . . . . . . . . . . 43 Ohio State . . . . . . . . . . . . . . . . . . . . . . . . . .43 11. Michigan . . . . . . . . . . . . . . . . . . . . . . . . . . . 41 12. Georgia Tech . . . . . . . . . . . . . . . . . . . . . . .40 Florida State . . . . . . . . . . . . . . . . . . . . . . . .40 14. Arkansas . . . . . . . . . . . . . . . . . . . . . . . . . . .39 Florida . . . . . . . . . . . . . . . . . . . . . . . . . . . . .39 LONGEST CURRENT BOWL STREAKS Rk. School Years 30 Florida State . . . . . . . . . . . . . . . . 1982-present 21 Florida . . . . . . . . . . . . . . . . . . . . .1991-present 19 Virginia Tech . . . . . . . . . . . . . . . . .1993-present 15 Georgia Tech . . . . . . . . . . . . . . .1997-present 15 Georgia . . . . . . . . . . . . . . . . . . . .1997-present 13 Oklahoma . . . . . . . . . . . . . . . . . .1999-present
RAMBLINWRECK.COM
The 1970 Sun Bowl
Georgia Tech 17, Texas Tech 9 Dec. 19, 1970 / El Paso, Texas By Jon Cooper, Sting Daily (Dec. 4, 2011) The college football landscape was a lot different in the 1970s than it is today. The phrase "bowl eligible" had yet to enter the vernacular and six wins didn't guarantee a team anything more than a winning season. There also were a lot fewer bowls in which to participate (11, as opposed to 35 today). Back in 1970, conference ties wouldn't have helped Georgia Tech, anyway, as the school played as an independent, having left the Southeastern Conference six years earlier. But in 1970, Tech was a very good independent. Four seasons removed from the end of the Bobby Dodd era, and on the heels of three consecutive 4-6 finishes under Head Coach Bud Carson, the Jackets had a break out season. Led by sophomore quarterback Eddie McAshan and the running of Brent Cunningham and Bob Healy, and a defense featuring Consensus All-American Rock Perdoni that limited opponents to 296.4 yards of total offense and 14.2 points per game, the Yellow Jackets finished the regular season 8-3 and ranked No. 13 nationally. Tech's schedule was a tough one that season, including four top-25 teams. The Jackets opened the season by beating No. 17 South Carolina, 23-20, at Grant Field, sparking a 4-0 start. The streak ended with backto-back road losses to No. 20 Tennessee then at No. 8 Auburn, led by Pat Sullivan, who would finish sixth in that season’s Heisman Trophy voting. Following the loss at Auburn, the Jackets would lose only once more the rest of the way. In their final game against a ranked opponent, on Nov. 14, the Jackets traveled to South Bend to face topranked Notre Dame and quarterback Joe Theismann. Tech lost the game, 10-7, but showed enough that pollsters moved No. 2 Texas ahead of the Fighting Irish. They would also hurt the Heisman hopes of Theismann — surname pronunciation change and all — and the ND QB would finish runner-up to Stanford's Jim Plunkett. The Jackets finished the season on a high, knocking off Georgia for the second straight season, 17-7 in Athens, and received a bid to play in El Paso.
Their opponent would be No. 19 Texas Tech. The third-place team in the Southwest Conference (behind Texas, and Arkansas), the Red Raiders would go to a bowl over Arkansas despite having a lower national ranking than the Razorbacks, one less win and two more losses, including a 24-10 loss to Arkansas in Lubbock. The Georgia Tech-Texas Tech match-up would be the first in the game's 36-year history to feature two ranked teams and would more than live up to the hype. The Jackets drew first blood on the initial drive, taking a 7-0 lead as senior quarterback Jack Williams orchestrated a 62-yard, 11-play drive, capped off by Bob Healy's two-yard plunge. Then the defense, led by Perdoni, took over. The unit, which allowed 10 or fewer points over the final five regular season games (during which Tech went 41), dominated the vaunted Texas Tech running game, led by Doug McCutchen, who became the first 1,000yard rusher in Texas Tech history in 1970, allowing them to cross midfield only once in the first 30 minutes. A 21-yard Jack Moore field goal in the closing minute gave the Yellow Jackets a 10-0 lead heading into the locker room at intermission and completed what Carson called "the best first half we've played all year." Texas Tech got going in the second half and pulled to within a point on a McCutchen seven-yard touchdown run and a safety, as a Chip Pallman punt was blocked out of the end zone. Early in the fourth the Red Raiders drove deep into Georgia Tech territory and threatened to take the lead. But the Jackets’ defense dug in and when Tech kicker Dickie Ingram misfired on a 26-yard field goal, the 109 lead was preserved. Fittingly, the Yellow Jacket defense would set up the score that put the game away late in the fourth. Linebacker Bill Flowers recovered a fumble deep in Texas Tech territory and tailback Kevin McNamara scored six plays later on a two-yard run with 1:44 to play to extend the lead to 17-9, which would be the final score. Flowers, who made eight unassisted tackles in addition to the fumble recovery, was named the game’s MVP. Perdoni, who set a Sun Bowl record with four tackles for loss as part of his 13 on the day, was named Outstanding Lineman. His four TFLs are still fourth-most in Sun Bowl history even though the record fell in 1984, when Tennessee's Reggie McKenzie made 4.5 TFLs. Williams also set a record in the game, completing 78.6 percent of his passes (11-of-14). That record stood alone until Stanford's Chad Hutchinson completed 22 of 28 passes in 1996. Georgia Tech Texas Tech
7 0
3 0
0 9
7 0
---
Scoring Summary: GT - Healy 2 yd run (Thigpen kick), 10:23, 1st GT - Moore 21 yd field goal, 0:42, 2nd TT - McCutchen 7 yd run (Ingram kick), 8:13, 3rd TT - Safety, 6:41, 3rd GT - McNamara 2 yd run (Thigpen kick), 1:44, 4th Attendance: 30,512 Statistics GT First Downs . . . . . . . . . . . . . . . . . . . . . .18 Att-Yds Rushing . . . . . . . . . . . . . . . .54-186 Yards Passing . . . . . . . . . . . . . . . . . . .138 Total Offense . . . . . . . . . . . . . . . . . . . .324 Passes Com-Att-Int . . . . . . . . . . . .13-19-1 Fumbles-Lost . . . . . . . . . . . . . . . . . . . .0-0 Punts-Avg . . . . . . . . . . . . . . . . . . . .6-34.3 Penalties-Yards . . . . . . . . . . . . . . . . . .7-66
TT . . . . . . .13 . . . .49-215 . . . . . . .28 . . . . . .243 . . . .3-11-3 . . . . . .6-3 . . . .4-41.0 . . . . . .4-40
Leading Rushers: GT - Healy 20-59, TD; Cunningham 14-42 TT - Hargrave 8-83; McCutchen 22-81, TD Leading Passers: GT - Williams 11-14-1, 123; McAshan 2-5-0, 15 TT - Napper 3-11-3, 28 Leading Receivers: GT - Pallman 3-42; Macy 3-37; Foster 3-24 TT - Odom 2-23 Tech in the 1970 Sun Bowl parade.
2011 GEORGIA TECH FOOTBALL
17 9
ALL-TIME LONGEST BOWL STREAKS No. School Years 35 Nebraska . . . . . . . . . . . . . . . . . . . . . . .1969-03 34 Michigan . . . . . . . . . . . . . . . . . . . . .1975-2007 30 Florida State . . . . . . . . . . . . . . . . 1982-present 25 Alabama . . . . . . . . . . . . . . . . . . . . . . .1959-83 21 Florida . . . . . . . . . . . . . . . . . . . . .1991-present 19 Virginia Tech . . . . . . . . . . . . . . . . .1993-present 17 Brigham Young . . . . . . . . . . . . . . . . . . .1978-94 16 Tennessee . . . . . . . . . . . . . . . . . . . . 1989-2004 15 Mississippi . . . . . . . . . . . . . . . . . . . . . . 1957-71 15 Ohio State . . . . . . . . . . . . . . . . . . . . .1972-86 15 Georgia Tech . . . . . . . . . . . . . . . 1997-present 15 Georgia . . . . . . . . . . . . . . . . . . . .1997-present 14 Penn State . . . . . . . . . . . . . . . . . . . . . .1971-83 13 Oklahoma . . . . . . . . . . . . . . . . . . .1999-present BEST BOWL WINNING PERCENTAGE MINIMUM OF 25 BOWL APPEARANCES Rk. School W-L-T 1. Southern California . . . . . . . . .32-16-0 2. Penn State . . . . . . . . . . . . . . .27-14-2 3. Mississippi . . . . . . . . . . . . . . 21-12-0 4. Florida State . . . . . . . . . . . . .23-14-2 5. Auburn . . . . . . . . . . . . . . . . .21-13-2 6. Oklahoma . . . . . . . . . . . . . . .26-17-1 7. Georgia . . . . . . . . . . . . . . . . .26-17-3 8. Alabama . . . . . . . . . . . . . . . .33-22-3 9. Georgia Tech . . . . . . . . . . . .22-17-0 10. NC State . . . . . . . . . . . . . . . .13-11-1 11. LSU . . . . . . . . . . . . . . . . . . .22-19-1 12. Texas . . . . . . . . . . . . . . . . . .25-22-2 13. Miami . . . . . . . . . . . . . . . . . .18-16-0 14. Arizona State . . . . . . . . . . . . .12-11-1 15. Nebraska . . . . . . . . . . . . . . . .24-23-0 16. Tennessee . . . . . . . . . . . . . . .25-24-0 17. Wisconsin . . . . . . . . . . . . . . .11-11-0
Pct .667 .639 .636 .615 .611 .602 .598 .595 .564 .540 .536 .531 .529 ,521 .511 .510 .500
BY BOWL W-L All-American Bowl 1-0 Aloha Bowl 1-0 Bluebonnet Bowl 0-1 Carquest /Champs 2-0 Chick-fil-A/Peach 0-4 Cotton Bowl 1-1 Florida Citrus Bowl 1-0 Emerald Bowl 0-1 Gator Bowl 3-4 Humanitarian Bowl 1-1
BY BOWL Independence Bowl Liberty Bowl Oil Bowl Orange Bowl Rose Bowl Seattle Bowl Silicon Valley Classic Sugar Bowl Sun Bowl
BY CITY, STATE Atlanta, Ga. Birmingham, Ala. Boise, Idaho Dallas, Texas El Paso, Texas Honolulu, Hawaii Houston, Texas Jacksonville, Fla. Memphis, Tenn.
W-L 0-4 1-0 1-1 1-1 1-0 1-0 1-1 3-4 1-0
BY CITY, STATE W-L Miami/Miami Gardens 4-3 New Orleans, La. 4-0 Orlando, Fla. 2-0 Pasadena, Cal. 1-0 San Francisco, Cal. 0-1 San Jose, Cal. 0-1 Seattle, Wash. 1-0 Shreveport, La. 0-1
BY OPPONENT Air Force Arkansas Baylor California Florida Fresno State Iowa Iowa State Kansas LSU Miami Michigan State Mississippi Missouri
W-L 0-1 1-1 1-0 1-0 0-1 0-2 0-1 1-0 1-0 0-2 0-1 1-0 1-1 1-1
BY OPPONENT Nebraska Notre Dame Penn State Pittsburgh Purdue Saint Mary’s Stanford Syracuse Texas Texas Tech Tulsa Utah West Virginia
W-L 1-0 1-0 0-1 2-0 0-1 1-0 2-0 1-0 0-1 2-0 2-1 0-1 2-1
BY CONFERENCE ACC Big East Big Ten Big 12 Conference USA
W-L 0-1 5-1 1-3 7-2 2-1
BY CONFERENCE Independent Mountain West PAC 10 SEC WAC
W-L 2-0 0-2 3-0 2-5 0-1
BY DATE December December December December December December
W-L 1-0 1-0 1-0 0-1 1-1 1-1
BY DATE December 29 December 30 December 31 January 1 January 2 January 4 January 5
W-L 2-2 0-2 1-3 11-4 2-2 1-0 0-1
18 19 21 22 25 27
W-L 0-1 1-0 1-0 3-3 1-0 1-0 0-1 4-0 1-0
RAMBLINWRECK.COM
TECH-UTAH STATISTICAL COMPARISON
MISCELLANEOUS SUN BOWL NOTES
Georgia Tech ranks third nationally in rushing offense (316.8). Meanwhile, Utah ranks seventh nationally in rushing defense (97.0). The Yellow Jackets rank 19th nationally in scoring offense (34.9), while the Utes rank 18th nationally in scoring defense (19.7). Utah’s John White ranks 11th nationally in rushing (117.0 ypg). Georgia Tech has allowed a 100-yard rusher five times this season.
Georgia Tech will play in the state of Texas for the first time since a 31-27 loss at Baylor on Nov. 7, 1992. Yellow Jacket co-offensive line coach Todd Spencer was an assistant coach at UTEP in 1989. Yellow Jacket recruiting coordinator and defensive line coach Andy McCollum coached linebackers and special steams at UTEP from 1989-92. Georgia Tech has two players on its roster from Texas -- senior WR Tyler Melton (Houston) and sophomore WR Jeremy Moore (Austin). Both Georgia Tech and Utah are making their second appearance in the Sun Bowl. Tech last played in 1970, a win over Texas Tech. Utah last played in 1939 (the 1938 season). Georgia Tech’s Paul Johnson has coached in El Paso previously. As an assistant coach at Hawaii from 198794, the Warriors played UTEP every season as both were members of the WAC. CBS Sports will broadcast the game for the 44th consecutive year, which is the longest running partnership between a network and a bowl game.
STATISTICAL COMPARISON Category Georgia Tech Record . . . . . . . . . . . . . . . . . . . . . . . .8-4 Rushing Offense . . . . . . . . . . . .316.83 (3) Passing Offense . . . . . . . . . . .142.75 (112) Total Offense . . . . . . . . . . . . . .459.58 (17) Scoring Offense . . . . . . . . . . . . .34.92 (19) Rushing Defense . . . . . . . . . .162.92 (T-70) Pass Efficiency Defense . . . . . . .124.55 (46) Total Defense . . . . . . . . . . . . . .361.17 (45) Scoring Defense . . . . . . . . . . . . .25.75 (60) Net Punting . . . . . . . . . . . . . . . .36.86 (55) Punt Returns . . . . . . . . . . . . . . . .8.00 (63) Kickoff Returns . . . . . . . . . . . . .19.28 (109) Turnover Margin . . . . . . . . . . . .+.17 (T-42) Pass Defense . . . . . . . . . . . . . .198.25 (30) Passing Efficiency . . . . . . . . . . .152.55 (19) Sacks . . . . . . . . . . . . . . . . . . . . .1.67 (79) Tackles for Loss . . . . . . . . . . . . . .4.58 (99) Sacks Allowed . . . . . . . . . . . . . . .1.08 (17) (2011 NCAA ranking in parenthesis)
Utah . . . . . . . . . .7-5 . . . .137.08 (82) . . . .171.58 (99) . . .308.67 (110) . . . . .24.58 (78) . . . . . .97.00 (7) . . . .114.70 (23) . . . .342.75 (29) . . . . .19.67 (18) . . . . .39.19 (15) . . . . . .8.29 (59) . . . . .21.87 (56) . . . . . .+.83 (14) . . . .245.75 (89) . . . .126.09 (70) . . . . . .2.50 (25) . . . . . .5.83 (54) . . . . . .2.58 (95)
TECH-UTAH SERIES HISTORY Utah leads the all-time series, 1-0. The Utes won the only previous meeting, 38-10, in the Emerald Bowl on Dec. 29, 2005. Utah’s Travis LaTendresse caught 16 passes for 214 yards, Brett Ratliff passed for 381 yards and the Utes rolled up 550 yards of total offense in San Francisco. Georgia Tech is 6-9 all-time against teams in the Pac-12. Tech’s last meeting with a Pac-12 team was the loss to Utah in the 2005 Emerald Bowl, although the Utes were not yet league members. The last time the Jackets played a team that was a Pac-12 member at the time was a win over Stanford in the 2001 Seattle Bowl. TECH vs. THE PAC 12 Tech is 3-0 vs. Pac-12 Arizona 0-2 teams in bowl play, 3-1 if you Arizona State 0-0 count the loss to Utah in California 3-4 2005. The Jackets also beat Colorado 0-0 Stanford in the 1991 Aloha Oregon 0-0 Bowl and Tech beat Cal in the Oregon State 0-0 Jan. 1, 1929 Rose Bowl. Southern Cal 1-2 Stanford 2-0 Utah coach Kyle WhitUCLA 0-0 tingham was in his first full Utah 0-1 season as head coach of the Washington 0-0 Utes when they beat Georgia Washington State 0-0 Tech in 2005. TOTAL 6-9 Georgia Tech’s Paul Johnson has never coached against Utah. The Yellow Jackets are 1-2 all-time against teams from Utah, including a 1-1 mark vs. BYU and an 0-1 record against the Utes. Georgia Tech is scheduled to host BYU next season and will travel to Provo in 2013. The other newest member of the Pac-12, Colorado, shared the 1990 national championship with Tech. YELLOW JACKET-UTE CONNECTIONS Georgia Tech has no players on its roster from Utah, and the Utes have no players from Georgia. Both teams have wide receivers from Houston -Georgia Tech senior Tyler Melton and Utah junior Josh Gordon. Utah offensive coordinator Norm Chow is familiar with the ACC, having served as the offensive coordinator at NC State in 2000. State beat Tech, 30-23 in overtime, in 2000. Utah assistant coach Dave Schramm was an assistant coach at Montana in 2003 and 2004 when current Tech associate athletic director Wayne Hogan was serving as athletic director for the Grizzlies.
2011 GEORGIA TECH FOOTBALL
ON THIS DATE IN TECH HISTORY Georgia Tech is 1-3 all-time when playing on New Year’s Eve... the Yellow Jackets have lost three straight on Dec. 31st, with their only win coming in 1985 when Tech beat Michigan State 17-14 in the All-American Bowl. DECEMBER 31st IN TECH HISTORY Year Result Opponent 2008 nL 3-38 LSU (Chick-fil-A Bowl) 2007 nL 28-40 Fresno State (Humanitarian Bowl) 2002 nL 21-30 Fresno State (Silicon Valley Classic) 1985 nW 17-14 Michigan State (All-American Bowl)
SENIORS TO PLAY FINAL GAME Georgia Tech’s 11-man senior class will play its final game in a Yellow Jacket uniform. Those seniors have accomplished a great deal over the last four seasons: Over the last four years combined, Georgia Tech has won 34 games (8.5 wins per year). The Yellow Jackets won the ACC championship outright in 2009 for the first time since 1990. Tech played in its first BCS bowl game. Tech’s seniors will play in their fourth consecutive bowl game. The Jackets have defeated eight nationally-ranked teams including two ranked in the top 10. Tech was 20-5 at home over the last four years. In 2010, Tech became the first team in school history to lead the nation in rushing offense. Over the last four years, Tech has defeated every team in the ACC at least once. 2011 Senior Class Chandler Anderson, K/P . . . .Came to Tech as a walk-on Roddy Jones, AB . . . . . . . . .One of Tech’s all-time favorites Preston Lyons, BB . . . . . . . .Atlanta native, Colgate transfer Tyler Melton, WR . . . . . . . . .Four-year starter Embry Peeples, AB . . . . . . . .Speedster played as true freshman Jason Peters, DE . . . . . . . . .Baton Rouge native a solid DE Michael Peterson, DB . . . . . .Valuable reserve for four years Ty Rawlings, K . . . . . . . . . . .Georgia Military transfer Rashaad Reid, DB . . . . . . . .Will play in 53rd career game Steven Sylvester, LB . . . . . . .Co-captain as a senior Logan Walls, DT . . . . . . . . .Three-year starter in the middle
JACKETS HAVE BEEN CONSISTENTLY GOOD Since 2008, when Paul Johnson took over at Georgia Tech, only Virginia Tech has won more ACC games: Last 4 Seasons Combined (2008-2011) Rk. School . . . . . . . . . . . . . . . .ACC 1. Virginia Tech . . . . . . . . . . . .26-6 2. Georgia Tech . . . . . . . . . .21-11 3. Clemson . . . . . . . . . . . . . .20-12
. . . .Overall . . . . . .42-12 . . . . . .34-18 . . . . . .32-21
Last 6 Seasons Combined (2006-2011) Rk. School . . . . . . . . . . . . . . . .ACC 1. Virginia Tech . . . . . . . . . . . .39-9 2. Georgia Tech . . . . . . . . . .32-16 3. Clemson . . . . . . . . . . . . . .30-18
. . . .Overall . . . . . .63-18 . . . . . .50-30 . . . . . .49-30
TECH IN THE ACC, NCAA STATS TEAM Pct/# Rushing Offense . . . . . . . . . . .316.83 Passing Offense . . . . . . . . . . .142.75 Total Offense . . . . . . . . . . . . .459.58 Scoring Offense . . . . . . . . . . . .34.92 Rushing Defense . . . . . . . . . . .162.92 Pass Defense . . . . . . . . . . . . .198.25 Total Defense . . . . . . . . . . . . .361.17 Scoring Defense . . . . . . . . . . . .25.75 Net Punting . . . . . . . . . . . . . . .36.86 Punt Returns . . . . . . . . . . . . . . .8.00 Kickoff Returns . . . . . . . . . . . . .19.28 Turnover Margin . . . . . . . . . . . .+.17 Fumbles Recovered . . . . . . . . . . . . .7 Passes Intercepted . . . . . . . . . . . .13 Fumbles Lost . . . . . . . . . . . . . . . .10 Passes Had Intercepted . . . . . . . . . .8 Turnovers Gained . . . . . . . . . . . . .20 Turnovers Lost . . . . . . . . . . . . . . .18 Passing Efficiency . . . . . . . . . .152.55 Pass Efficiency Defense . . . . . .124.55 Fewest Penalties . . . . . . . . . . . . .4.5 Fewest Yards Penalized . . . . . . . .37.5 Punt Return Yardage Def. . . . . . . .3.7 Kickoff Return Yardage Def. . . . . .20.9 Sacks . . . . . . . . . . . . . . . . . . . .1.67 Tackles for Loss . . . . . . . . . . . . .4.58 Sacks Allowed . . . . . . . . . . . . . .1.08 Tackles for Loss Allowed . . . . . . . .4.5 3rd-Down Conversion Pct. . . . . .54.88 4th-Down Conversion Pct. . . . . .52.63 3rd-Down Defense . . . . . . . . . .43.83 4th-Down Defense . . . . . . . . . .63.64 Time of Possession . . . . . . . . . .31:45 First Downs . . . . . . . . . . . . . . . .20.5 Opponent First Downs . . . . . . . .18.75 Opponent Penalty Yards . . . . . . .27.8 Field Goal Percentage . . . . . . . . .69.2 Red Zone Offense . . . . . . . . . . . .89.0 Red Zone Defense . . . . . . . . . . .81.0 PAT Kicking . . . . . . . . . . . . . . .100.0
ACC 1 12 1 1 8 3 7 8 6 6 12 5 T-7 T-3 T-7 T-1 T-6 4 3 7 4 4 --8 10 1 -1 4 11 11 2 4 5 12 6 1 5 T-1
NCAA 3 112 17 19 T-70 30 45 60 55 63 109 T-42 T-91 T-32 T-52 T-23 T-64 T-28 19 46 T-12 13 6 50 T-79 T-99 17 18 1 T-55 92 T-108 26 55 T-37 --T-12 T-54 --
INDIVIDUAL Pct/# Jeremiah Attaochu, So., LB Sacks . . . . . . . . . . . . . . . . . . . .0.60 Tackles For Loss . . . . . . . . . . . . .0.85 Julian Burnett, Jr., LB Tackles . . . . . . . . . . . . . . . . . . .9.42 Tackles For Loss . . . . . . . . . . . . .0.79 Stephen Hill, Jr., WR Receiving . . . . . . . . . . . . . . . . . .65.4 Isaiah Johnson, So., S Interceptions . . . . . . . . . . . . . . .0.25 Justin Moore, So., K Scoring . . . . . . . . . . . . . . . . . . .6.67 PAT Pct. . . . . . . . . . . . . . . . . . .100.0 Field Goal Pct. . . . . . . . . . . . . . .69.2 Sean Poole, So., P Punting . . . . . . . . . . . . . . . . . . .38.7 Orwin Smith, Jr., AB Scoring . . . . . . . . . . . . . . . . . . .6.55 All Purpose . . . . . . . . . . . . . . .115.82 Rod Sweeting, Jr., CB Passes Defended . . . . . . . . . . . .1.00 Interceptions . . . . . . . . . . . . . . .0.25 Jemea Thomas, r-So., S Interceptions . . . . . . . . . . . . . . .0.25 Tevin Washington, Jr., QB Rushing . . . . . . . . . . . . . . . . . .74.17 Scoring . . . . . . . . . . . . . . . . . . .7.00 Total Offense . . . . . . . . . . . . .200.42
ACC
NCAA
4 14
T-43 --
5 T-17
T-32 --
8
72
T-6
T-65
7 T-1 6
T-89 ---
8
--
8 7
T-92 65
4 T-6
-T-65
T-6
T-65
6 T-5 9
65 T-78 69
2011 GAMES MISSED BECAUSE OF INJURY B.J. Bostic . . . . . . . . . . . . . . . . . . . . . . . . . . . . . . .12 Fred Holton, S . . . . . . . . . . . . . . . . . . . . . . . . . . . . .12 Jimmie Kitchen, DL . . . . . . . . . . . . . . . . . . . . . . . . .12 Morgan Bailey, OL . . . . . . . . . . . . . . . . . . . . . . . . . . .7 Lance Richardson, DB . . . . . . . . . . . . . . . . . . . . . . . .7 Tyler Morgan, LS . . . . . . . . . . . . . . . . . . . . . . . . . . . .4 J.C. Lanier, OL . . . . . . . . . . . . . . . . . . . . . . . . . . . . .3 Jeremiah Attaochu, LB . . . . . . . . . . . . . . . . . . . . . . . .2 Daniel Drummond, LB . . . . . . . . . . . . . . . . . . . . . . . .1 Jay Finch, C . . . . . . . . . . . . . . . . . . . . . . . . . . . . . . .1 Jeff Greene, WR . . . . . . . . . . . . . . . . . . . . . . . . . . . .1 Preston Lyons, BB . . . . . . . . . . . . . . . . . . . . . . . . . . .1 Orwin Smith, AB . . . . . . . . . . . . . . . . . . . . . . . . . . . .1 Brandon Watts, LB . . . . . . . . . . . . . . . . . . . . . . . . . .1
RAMBLINWRECK.COM
MODEL OF CONSISTENCY Tech will play in a bowl game for the 15th consecutive season. That ranks as the fourth-longest active streak among FBS schools. Tech has finished .500 or better in league play for an ACC-record 17 consecutive seasons. That’s the longest current streak in the nation. Florida’s streak of 24 straight seasons came to an end this season. CURRENT CONSECUTIVE BOWL GAME APPEARANCES 30 Florida State 1982-present 21 Florida 1991-present 19 Virginia Tech 1993-present 15 Georgia Tech 1997-present 15 Georgia 1997-present Includes 2011 CONSECUTIVE NON-LOSING SEASONS IN CONFERENCE PLAY No. Team Conference Since 17 Georgia Tech ACC 1995 16 a-Southern Miss C-USA 1996 13 Boise State WAC/Big West 1999 13 Clemson ACC 1999 12 Oklahoma Big 12 1999 10 USC Pac-10 2001 a - was an independent prior to 1996
JONES, REID APPROACHING MILESTONES Senior A-back Roddy Jones made his 51st career start Nov. 26 against Georgia, breaking the all-time Georgia Tech record. Senior defensive back Rashaad Reid will play in his 53rd career game in the bowl game, which will tie the Tech career record for games played. Career Games Started 51, Roddy Jones . . . . . . . . . . . . . . . . .RB 50, Recardo Wimbush . . . . . . . . . . . . . .LB 49, Reggie Ball . . . . . . . . . . . . . . . . . . .QB 48, Andrew Gardner . . . . . . . . . . . . . . .OT
. . . . . . .2008-11 . . . . . . .1999-02 . . . . . . .2003-06 . . . . . . .2005-08
Career Games Played 53, Scott Blair . . . . . . . . . . . . . . . . . . . . .K 52, Rashaad Reid . . . . . . . . . . . . . . . .DB 52, Mario Butler . . . . . . . . . . . . . . . . . .CB 52, Darryl Richard . . . . . . . . . . . . . . . . .DT 51, Roddy Jones . . . . . . . . . . . . . . . . .RB 51, Steven Sylvester . . . . . . . . . . . . . .LB
. . . . . . .2007-10 . . . . . . .2008-11 . . . . . . .2007-10 . . . .2004, 06-08 . . . . . . .2008-11 . . . . . . .2008-11
UZZI NAMED 1ST TEAM ALL-ACC; BURNETT 2ND TEAM; ATTAOCHU, SWEETING HM Georgia Tech junior guard Omoregie Uzzi was named first team All-Atlantic Coast Conference and junior linebacker Julian Burnett earned second team honors. Uzzi earned All-ACC honors for the second straight year. He was a second-team selection in 2010. Uzzi is part of a Yellow Jacket offense that leads the ACC in rushing offense, total offense and scoring offense. Tech, which ranks third nationally in rushing, also either leads the league or is tied for the conference lead in fewest sacks allowed, third-down percentage and redzone offense. Burnett, who earns all-conference honors for the first time, ranks fifth in the ACC in tackles (113). Burnett, who has 44 more tackles than any other Tech player, leads the team in tackles for loss (9.5), and he has forced and recovered fumbles. Georgia Tech has placed an offensive lineman on the
All-ACC first team for five consecutive seasons (Andrew Gardner, 2007; Gardner, 2008; Sean Bedford and Cord Howard, 2009; Bedford, 2010; Uzzi, 2011). Since Tech's first All-ACC selection in 1982, a Jacket offensive lineman has earned first-team honors 17 times -- more than any other position. Burnett is the first Yellow Jacket linebacker to earn AllACC honors since Philip Wheeler was named second team in 2007. Brad Jefferson was an honorable mention linebacker in 2009. Tech has placed at least one player on the All-ACC first team every year since 1996. Yellow Jacket sophomore Jeremiah Attaochu and junior cornerback Rod Sweeting were named honorable mention All-ACC. Attaochu leads the team in sacks (6.0) despite missing two games with an injury. Sweeting ranks third on the team in tackles, leads the team in pass break-ups (9) and has three interceptions. ON THE DEFENSIVE Defensively, Tech improved its national ranking, compared to last year, in every statistical category. Georgia Tech has more interceptions this season (13) than it had all of last season (8). Oct. 29 against sixth-ranked Clemson, Tech held the Tigers to 95 yards rushing, three first-half points and forced four turnovers. At Miami (Oct. 22), Tech held the Hurricanes to just three second-half points. Miami scored 24 points in the game, but seven of those came on a fumble recovery in the end zone. At Virginia, Tech held its opponent scoreless in the second half for the second time this season (also vs. Western Carolina). Last season the Jackets did not hold any opponent scoreless in any half. Maryland entered the fourth quarter with just three points against Tech. Tech has allowed just 44 third-quarter points. Category Rushing Defense Pass Defense Pass Efficiency Defense Total Defense
2011 162.92 (70) 198.25 (30) 124.55 (46) 361.17 (45)
2010 2009 169.7 (78) 151.6 (68) 201.9 (34) 208.6 (47) 129.1 (63) 136.3 (88) 371.6 (64) 360.3 (54) (national ranking)
NOTING THE SPECIAL TEAMS Georgia Tech’s special teams have been understandably scrutinized this season. Two Tech field goals have been blocked (one returned for a touchdown), a fumbled punt return resulted in a Miami TD, kickoffs have been returned from deep in the end zone and there have been two punts of less than 20 yards. But, special teams have had their positive moments as well: The Yellow Jackets rank sixth nationally in punt return defense (3.7 ypa). Tech has blocked or deflected four punts or field goal attempts. Sophomore Justin Moore has converted all 53 PATs. With one more PAT, he will break Tech’s single-season record. Freshman Tony Zenon’s 79-yard kick return against Maryland set up a key Yellow Jacket touchdown.
THE ENEMY CAMP A look at Georgia Tech’s 2011 opponents Opponent (Date vs. GT) Western Carolina (9/1) Middle Tennessee State (9/10) Kansas (9/17) North Carolina (9/24) NC State (10/1) Maryland (10/8) Virginia (10/15) Miami (10/22) Clemson (10/29) Virginia Tech (11/10) Duke (11/19) Georgia (11/26) Utah (12/31) Opponent Total
W-L 1-10 2-10 2-10 7-5 7-5 2-10 8-4 6-6 10-3 11-2 3-9 10-3 7-5 75-79
2011 GEORGIA TECH FOOTBALL
AP ------rv -14 17 -18 --
USA ------rv -14 11 -18 --
Last Week L, 45-21 vs. Coastal Carolina L, 7-59 at North Texas L, 10-24 vs. Missouri W, 37-21 vs. Duke W, 56-41 vs. Maryland L, 41-56 at NC State W, 14-13 at Florida State L, 17-24 vs. Boston College W, 38-10 vs. Virginia Tech L, 10-38 vs. Clemson L, 21-37 at North Carolina L, 10-42 vs. LSU W, 47-38 at Arizona State
Bowl Game None None None Independence Bowl Belk Bowl None Chick-fil-A Bowl None Discover Orange Bowl Allstate Sugar Bowl None Outback Bowl Hyundai Sun Bowl
TECH IN THE NATIONAL POLLS Associated Press . . . . . . . . . . . . . . . . . . . . . . .RV USA Today Coaches . . . . . . . . . . . . . . . . . . . . .RV Harris Poll . . . . . . . . . . . . . . . . . . . . . . . . . . . . . . CBS . . . . . . . . . . . . . . . . . . . . . . . . . . . . . . . . . . . Sagarin Ratings . . . . . . . . . . . . . . . . . . . . . . . . . . Associated Press 1. LSU (60) 2. Alabama 3. Oklahoma St. 4. Stanford 5. USC 6. Oregon 7. Arkansas 8. Boise State 9. Wisconsin 10. South Carolina 11. Kansas State 12. Michigan State 13. Michigan 14. Clemson 15. Baylor 16. TCU 17. Virginia Tech 18. Georgia 19. Oklahoma 20. Houston 21. Nebraska 22. Southern Miss 23. West Virginia 24. Penn State 25. Florida State
13-0 11-1 11-1 11-1 10-2 11-2 10-2 11-1 11-2 10-2 10-2 10-3 10-2 10-3 9-3 10-2 11-2 10-3 9-3 12-1 9-3 11-2 9-3 8-4 8-4
Receiving Votes: Notre Dame 23, Cincinnati 22, Arkansas State 18, BYU 12, Georgia Tech 7, Northern Illinois 7, Missouri 5, Virginia 5, Tulsa 2, Louisville 1
USA Today Coaches Poll 1. LSU (59) 13-0 2. Alabama 11-1 3. Oklahoma St. 11-1 4. Stanford 11-1 5. Oregon 11-2 6. Boise State 11-1 7. Arkansas 10-2 8. Wisconsin 11-2 9. South Carolina 10-2 10. Kansas State 10-2 11. Virginia Tech 11-2 12. Michigan 10-2 13. Michigan State 10-3 14. Clemson 10-3 15. TCU 10-2 16. Baylor 9-3 17. Houston 12-1 18. Georgia 10-3 19. Oklahoma 9-3 20. Nebraska 9-3 21. Southern Miss 11-2 22. West Virginia 9-3 23. Penn State 9-3 24. Cincinnati 9-3 25. Florida State 8-4 Receiving Votes: BYU 20, Northern Illinois 14, Missouri 11, Georgia Tech 10, Arkansas State 9, Notre Dame 9, Virginia 5, Louisiana Tech 2, Rutgers 1, Texas 1
WEEK-BY-WEEK IN THE POLLS AP Preseason . . . . . . .NR September 6 . . . . .RV September 11 . . . .RV September 18 . . . . .25 September 25 . . . . .21 October 2 . . . . . . . .13 October 9 . . . . . . . .12 October 16 . . . . . . .20 October 23 . . . . . . .RV October 30th . . . . .22 November 6 . . . . . .20 November 13 . . . . .RV November 20 . . . . .25 November 27 . . . . .RV December 4 . . . . . .RV
USA . . . . . . . .RV . . . . . . . .RV . . . . . . . .RV . . . . . . . . .24 . . . . . . . . .21 . . . . . . . . .13 . . . . . . . . .12 . . . . . . . . .19 . . . . . . . .RV . . . . . . . . .23 . . . . . . . . .19 . . . . . . . . .23 . . . . . . . . .21 . . . . . . . .RV . . . . . . . .RV
BCS
. . . . . . . . .22 . . . . . . . . .23 . . . . . . . . .21 . . . . . . . . .23
TECH IN THE AP POLL Last time ranked in the top 25 . . . .Nov. 20, 2011 Last time ranked in the top 10 . . . . .Dec. 6, 2009 All-time weeks ranked in AP poll . . . . . . . . .293 All-time weeks ranked in top 10 . . . . . . . . . .143 All-time weeks ranked in top 5 . . . . . . . . . . . .58 Highest AP ranking all-time . . . . . .2nd (13 times) vs. AP top 25 all-time . . . . . . . . . . . . . . .87-156-6 vs. ACC . . . . . . . . . . . . . . . . . . . . . . . . .26-38 at home . . . . . . . . . . . . . . . . . . . . . . .47-72-4 on road . . . . . . . . . . . . . . . . . . . . . . . .24-74-2 neutral sites . . . . . . . . . . . . . . . . . . . . . .16-10 under Paul Johnson . . . . . . . . . . . . . . . . . . .7-6
THE VOTERS TAKE ON TECH Where random Associated Press poll voters placed the Yellow Jackets this week: Josh Kendall, The State (Columbia, S.C.) . . . . . .22nd Chad Cripe, Idaho Statesman . . . . . . . . . . . . . .24th John Clay, Lexington Herald-Leader . . . . . . . . . .25th
RAMBLINWRECK.COM
THREE YARDS AND A CLOUD OF DUST? The Yellow Jackets have produced 73 plays of at least 20 yards. Tech had 13 plays of at least 20 yards vs. Kansas. Georgia Tech has produced 22 offensive plays of 40 yards or more. Georgia Tech has four pass plays of 70-plus yards this season. Last year Tech had just one pass play of at least 70 yards. The Yellow Jackets also have two rushing plays of 70-plus yards, for a total of six scrimmage plays that have gone that distance. Last season Tech had just three plays of 70 yards or longer. Thirteen different players have produced a play of 20 yards or more. Orwin Smith’s 95-yard touchdown run on Tech’s first offensive play from scrimmage against Kansas was the longest rushing attempt in Tech history. It was also the fourth-longest rush in the FBS in 2011. The Jackets have scored 15 touchdowns on plays of 20 yards or longer and they have scored 10 touchdowns on plays of 50 yards or longer. Tech has eight one-play touchdown drives. The Yellow Jackets had zero one-play drives last season. The Jackets have 27 touchdown drives of less than three minutes. Ten TD drives have been less than one minute.
Eleven different offensive players have scored at least one offensive touchdown and six different players have at least three TDs. Thirteen different players have had at least one 20yard offensive play (rushing or receiving). LIGHTING UP THE SCOREBOARD Georgia Tech ranks first in the ACC and 19th nationally in scoring (34.9 points per game). The Yellow Jackets’ scoring average is their highest since 1999. Georgia Tech has scored in 37 of 48 quarters. Eleven different players have scored at least one touchdown -- five A-backs, three B-backs, two quarterbacks and one wide receiver. Tech is 47-of-53 (89%) scoring inside the red zone, ranking first in the ACC and tied for 12th nationally in redzone offense. Tech was just the second team in ACC history to score more than 200 points through its first four games. The Jackets are outscoring opponents 115-55 in the first quarter and 104-44 in the third quarter. Tech has scored in the second quarter of every game. Georgia Tech scored on its first possession in each of the first six games of the season (5 touchdowns, 1 field goal). The Yellow Jackets, in fact, scored on their first offensive play in each of the first three games.
TECH CAN SUSTAIN LONG DRIVES AS WELL Tech has produced seven touchdowns drives of 90 yards or more -- more than any team nationally. Eighteen Yellow Jacket touchdown drives have been of at least 80 yards. Tech has produced seven touchdown drives lasting longer than seven minutes and four TD drives of at least nine minutes. Oct. 22 at Miami, Tech had a 20-play, 92-yard touchdown drive that lasted 9:15. At Middle Tennessee State, Tech had TD drives of 17 plays, 98 yards, 9 minutes, 25 seconds, and 16 plays, 73 yards, 9 minutes and 41 seconds. Most 90-Yard Scoring Drives (FBS) 7 Georgia Tech 95, 98, 90, 95, 92, 94, 91 6 Alabama 98, 94, 92, 92, 92, 90 5 Texas Tech 91, 95, 92, 92, 91 5 Utah State 91, 90, 99, 99, 94 5 Southern Miss 94, 95, 96, 98, 99 5 California 92, 91, 91, 91, 96 5 BYU 99, 97, 96, 91, 90 5 Virginia Tech 97, 96, 90, 95, 96 5 Middle Tennessee 95, 95, 94, 98, 96 5 Louisiana Tech 92, 91, 91, 91, 96 Tech’s 90-Yard Touchdown Drives 98 Middle Tennessee State 95 Kansas 95 Western Carolina 94 Duke 92 Miami 91 Duke 90 Middle Tennessee State
A H H (th) A A A A
Sept. 10, 2011 Sept. 17, 2011 Sept. 1, 2011 Nov. 19, 2011 Oct. 22, 2011 Nov. 19, 2011 Sept. 10, 2011
Longest Tech Scoring Drives (Plays)/Last 30 Years 20 Miami A Oct. 22, 2011 20 (fg) North Carolina A Sept. 18, 2010 20 North Carolina A Nov. 11, 2006 19 Virginia A Oct. 15, 2011 Longest Tech Scoring Drives (Time)/Last 30 Years 10:47 Virginia A Oct. 24, 2009 10:32 (fg) North Carolina A Sept. 18, 2010 10:30 North Carolina A Nov. 11, 2006 9:41 Middle Tennessee State A Sept. 10, 2011 9:31 Virginia A Oct. 15, 2011 9:27 Florida State H Oct. 24, 1998 9:25 Middle Tennessee State A Sept. 10, 2011 9:15 Miami A Oct. 22, 2011
BALANCED ATTACK Unlike previous seasons when the Georgia Tech offense leaned on Calvin Johnson (2006), Tashard Choice (2007), Jonathan Dwyer (2008, 2009) and Anthony Allen (2010), this year’s offense is more balanced: Three players -- Tevin Washington (74.2), David Sims (58.2) and Orwin Smith (56.0) -- average at least 56 yards rushing per game.
2011 GEORGIA TECH FOOTBALL
Tech’s First Play of the Game vs. W. Carolina O. Smith 5-yard run at MTSU Zenon 73-yard catch vs. Kansas O. Smith 95-yard run
Touchdown Touchdown Touchdown
Tech’s First Possession vs. W. Carolina Touchdown at MTSU Touchdown vs. Kansas Touchdown vs. N. Carolina Field Goal at NC State Touchdown vs. Maryland Touchdown vs. Virginia Tech Touchdown
TECH COULD HAVE FOUR 1,000-YARD RUSHERS There are three career 1,000-yard rushers on the Yellow Jacket roster -- senior Roddy Jones (1,826), junior quarterback Tevin Washington (1,444) and junior Orwin Smith (1,158). There could be a fourth. Senior Embry Peeples enters the bowl game with 976 career yards. TECH OPPONENTS RARELY GET FLAGGED... Georgia Tech’s opponents have been called for just 50 penalties for an average of 27.8 yards per game. The Jackets rank last in the ACC in opponent penalties. Three times this season -- vs. Kansas, Maryland and Miami -- Tech’s opponents were called for just one penalty for five yards. Kansas’ only penalty -- a delay of game -- was taken intentionally. .. AND TECH IS LIGHT ON PENALTIES, TOO Georgia Tech ranks 12th nationally in fewest penalties (4.5 per game). The Yellow Jackets rank 13th nationally in fewest penalty yards per game (37.5). THE CLOSER: JEMEA THOMAS Jemea Thomas has three interceptions over the last four games -- the first three INTs of his career -- but more importantly, he almost single-handedly secured Georgia Tech’s last two victories. Nov. 19 at Duke, the Blue Devils were driving late in the fourth quarter for a potential game-tying touchdown when Thomas intercepted a Sean Renfree pass. Oct. 29 in the win over sixth-ranked Clemson, Thomas recorded two fourth-quarter interceptions. His performance vs. Clemson -- his first career start -- earned him ACC Defensive Back of the Week honors. Thomas was the first Yellow Jacket with two interceptions in a game since Jerrard Tarrant had two picks against Middle Tennessee State on Oct. 16, 2010. Thomas also took over as Tech’s punt returner in late October. He has two punt returns for 21 yards.
TECH BY THE NUMBERS Junior Stephen Hill leads the nation in yards per reception (30.2).
1 1 1 3 3 3 4 6-2 7 7 7 8 9 10 10 11 13 12-3 12.1
Kicker Justin Moore needs to make one more PAT to break the Tech single-season record. Georgia Tech leads the nation in third-down percentage (54.9 percent). Tech ranks third nationally in rushing offense (316.8 ypg). Times the Yellow Jackets have scored on their first offensive play of the game. Times junior QB Tevin Washington has rushed and passed for more than 100 yards in a game. Georgia Tech has played four nationally-ranked opponents, three ranked 13th or higher. Paul Johnson is 6-2 at Tech when playing nationally-ranked teams at home.
Touchdown drives of 90 yards or longer for Tech this season. Tech has scored on its first possession in seven games this season (6 TDs, 1 FG). Consecutive years Tech has been ranked at least one week in the AP top 25. Tech has produced eight one-play touchdown drives. Tech has produced nine offensive plays of 60 yards or longer. True freshmen have seen action in 2011. Just 10 scholarship seniors on the roster. The Yellow Jackets rank in the top 20 nationally in 11 different statistical categories. The Yellow Jackets have recorded 13 interceptions, five more than they had in all of 2010. Paul Johnson is 12-3 at Georgia Tech in games decided by five points or less.
Georgia Tech broke an NCAA record with an average of 12.1 yards per rushing attempt vs. Kansas. Consecutive years the Yellow Jackets will play in a bowl game.
15 17 17 20 24 26-4 29-2 38
Consecutive years the Yellow Jackets have finished .500 or better in ACC play. True freshman wide receiver Darren Waller’s shoe size – the largest on the team. Tech has produced 20 touchdown drives of five plays or less. Rushing yards needed by senior Embry Peeples to reach 1,000 career yards. Georgia Tech’s record under Paul Johnson when leading at halftime. Georgia Tech’s record under Paul Johnson when leading after three quarters.
Players in Tech history have rushed for 1,000 career yards, including current Yellow Jackets Roddy Jones, Orwin Smith and Tevin Washington. Years ago, in 1966, was the last time Georgia Tech started 6-0 like it did this season.
45 51 56 73 170 183
Career games started by senior A-back Roddy Jones, the most in Tech history. Touchdowns Tech has scored on its 141 possessions. Tech has produced 73 offensive plays of 20 yards or longer. Straight games without returning a kickoff for a TD (last: 10/31/98 at Maryland). Consecutive games without being shutout (last: 10/18/97 vs. Florida State).
RAMBLINWRECK.COM
WASHINGTON A PRODUCTIVE DUAL-THREAT QB Junior quarterback Tevin Washington is enjoying one of the most productive seasons ever by a Tech QB: Washington’s 321 yards of total offense at Duke Nov. 19 were the most by a Yellow Jacket since Oct. 6, 2005 when Reggie Ball had 367 yards vs. NC State. Against Duke, he rushed and passed for more than 100 yards for the third time in his career. His 176 yards rushing against Clemson were the most ever by a Yellow Jacket quarterback. His pass efficiency (153.5) ranks second in Tech history. WASHINGTON’S 100-YARD RUSHING/PASSING GAMES Date Opponent Site Rush Pass Nov. 19, 2011 Duke A 136 185 Oct. 8, 2011 Maryland H 120 114 Nov. 13, 2010 Maryland H 122 101 WASHINGTON IN 2011 Category 2011 Rank in Tech History Rushing Yards by a QB . . . . . . .890 . . . . . . . . . .2nd Rushing Touchdowns by a QB . .14 . . . . . . . . . .2nd Pass Efficiency . . . . . . . . . . . .153.5 . . . . . . . . .2nd Rushing Touchdowns . . . . . . . .14 . . . . . . . . . .t-3rd TDs Responsible For . . . . . . . . .24 . . . . . . . . . .4th Touchdowns . . . . . . . . . . . . . . .14 . . . . . . . . . .t-5th Total Offense . . . . . . . . . . . . .2,405 . . . . . . . . .10th Points Scored . . . . . . . . . . . . . .84 . . . . . . . . .t-10th Rushing Attempts . . . . . . . . . .222 . . . . . . . . .13th Rushing Yards . . . . . . . . . . . . .890 . . . . . . . . .20th WASHINGTON’S CAREER TOTALS Category Career Rank in Tech History Pass Efficiency . . . . . . . . . . . .137.4 . . . . . . . . .3rd Rushing Touchdowns by a QB . .18 . . . . . . . . . .t-3rd Rushing Yards by a QB . . . . . .1,444 . . . . . . . . .4th TDs Responsible For . . . . . . . . .30 . . . . . . . . . .12th Total Offense . . . . . . . . . . . . .3,397 . . . . . . . . .13th Rushing Touchdowns . . . . . . . .18 . . . . . . . . .t-13th Touchdowns . . . . . . . . . . . . . . .18 . . . . . . . . .t-19th Passing Yards . . . . . . . . . . . . .1,953 . . . . . . . . .20th Rushing Yards . . . . . . . . . . . .1,444 . . . . . . . . .25th
MOST RUSHING YARDS BY A TECH QUARTERBACK 176 Tevin Washington vs. Clemson Oct. 29, 2011 151 Joshua Nesbitt vs. Virginia Tech Sept. 13, 2008 130 Joshua Nesbitt vs. S.C. State Sept. 4, 2010 130 Reggie Ball vs. Troy Sept. 16, 2006 MOST RUSHING YARDS BY AN ACC QUARTERBACK 220 Woodrow Dantzler (Clemson) vs. Virginia 184 Woodrow Dantzler (Clemson) vs. NC State 183 Woodrow Dantzler (Clemson) vs. Maryland 176 Tevin Washington (Georgia Tech) vs. Clemson
2000 2001 1999 1976
ACC SINGLE-SEASON RUSHING TDs BY A QUARTERBACK 1. Joshua Nesbitt Georgia Tech 2009 18 2. Larry Russell Wake Forest 1971 15 3. Tevin Washington Georgia Tech 2011 14 4. Woodrow Dantzler Clemson 2000 13 Scott Smith NC State 1979 13 ACC CAREER RUSHING TDs BY A QUARTERBACK 1. Joshua Nesbitt Georgia Tech 2007-10 2. Larry Russell Wake Forest 1969-71 3. Woodrow Dantzler Clemson 1998-01 4. Tyrod Taylor Virginia Tech 2007-10 5. Mike Dunn Duke 1975-78 6. Shawn Jones Georgia Tech 1989-92 7. Tevin Washington Georgia Tech 2009-* Two players
35 29 27 23 22 19 18 18
ACC SINGLE-SEASON RUSHING YARDS BY A QB 1. Woodrow Dantzler Clemson 2001 2. Joshua Nesbitt Georgia Tech 2009 3. Woodrow Dantzler Clemson 2000 4. Tevin Washington Georgia Tech 2011 5. Larry Russell Wake Forest 1971 6. Joshua Nesbitt Georgia Tech 2008
1,061 1,037 1,028 890 803 693
ACC CAREER RUSHING YARDS BY A QB 1. Joshua Nesbitt Georgia Tech 2. Woodrow Dantzler Clemson 3. Tyrod Taylor Virginia Tech 4. Mike Dunn Duke 5. Larry Russell Wake Forest 6. Joe Hamilton Georgia Tech 7. Steve Fuller Clemson 8. Reggie Ball Georgia Tech 9. Tevin Washington Georgia Tech
2,806 2,761 2,196 1,939 1,923 1,748 1,737 1,451 1,444
2007-10 1998-01 2007-10 1975-78 1969-71 1996-99 1975-78 2003-06 2009-*
Starter Lost
A-Back A-Back
Roddy Jones Orwin Smith (Jr.)
Receiver Receiver
Stephen Hill (Jr.) Tyler Melton
Tackle Guard Center Guard Tackle
Phil Smith (Jr.) Omoregie Uzzi (Jr.) Jay Finch (So.) Will Jackson (So.) Ray Beno (So.)
DEFENSE End
Starter Lost Jason Peters
Tackle
Logan Walls
End Outside LB Inside LB Inside LB Outside LB
Steven Sylvester
Cornerback Safety Safety
Rashaad Reid
Cornerback KICKERS Kicker Punter Snapper
Starter Returning Tevin Washington (Jr.) David Sims (So.)
Starter Lost
Back-Ups Returning Synjyn Days (So.) Charles Perkins (r-Fr.) Richard Watson (Jr.) Tony Zenon (r-Fr.) Robert Godhigh (So.) Deon Hill (r-Fr.) Darren Waller (Fr.) Chris Jackson (Jr.) Jeff Greene (Fr.) Daniel McKayhan (Jr.) Jeremy Moore (So.) Tyler Kidney (So.) J.C. Lanier (So.) Nick McRae (Jr.) Shaq Mason (Fr.) Catlin Alford (r-Fr.) Morgan Bailey (r-Fr.)
Starter Returning
Back-Ups Returning Emmanuel Dieke (So.) Anthony Williams (r-Fr.) T.J. Barnes (Jr.) Shawn Green (r-Fr.) Izaan Cross (Jr.) Euclid Cummings (So.) Chris Crenshaw (So.) Jeremiah Attaochu (So.) Malcolm Munroe (Jr.) Julian Burnett (Jr.) B.J. Machen (Jr.) Tremayne McNair (Fr.) Quayshawn Nealy (r-Fr.) Daniel Drummond (So.) Morgan Carter (So.) Brandon Watts (So.) Kyle Travis (Fr.) Nick Menocal (Fr.) Rod Sweeting (Jr.) Jamal Golden (Fr.) Jemea Thomas (So.) Isaiah Johnson (Jr.) Corey Dennis (Fr.) Zach Laskey (Fr.) Louis Young (So.) Starter Returning Justin Moore (So.) Sean Poole (So.) Sean Tobin (So.)
2011 GEORGIA TECH FOOTBALL
Back-Ups Returning David Scully (So.) Tyler Morgan (Jr.)
Jeremiah Attaochu (So., OLB) Honorable Mention All-ACC Bronko Nagurski Watch List ESPN Gameday Helmet Sticker (9/24) ACC Linebacker of the Week (9/26) FWAA National Player of the Week (9/27) Julian Burnett (Jr., LB) (Team co-Captain) Second Team All-ACC Preseason Third Team All-ACC (Phil Steele) Izaan Cross (Jr., DE) Ted Hendricks Award (Watch List) Stephen Hill (Jr., WR) Preseason Third Team All-ACC (Phil Steele) Biletnikoff Award Watch List ACC Receiver of the Week (9/6) Will Jackson (Jr., G) Preseason Fourth Team All-ACC (Phil Steele) Isaiah Johnson (So., S) ACC Defensive Back of the Week (9/26) Roddy Jones (Sr., RB) (Team co-Captain) Allstate AFCA Good Works Team Candidate Justin Moore (So, PK) ACC Specialist of the Week (10/3) Charles Perkins (r-Fr., RB) Preseason ACC Newcomer of the Year (Blue Ribbon) Jason Peters (Sr., DE) Preseason Second Team All-ACC (Lindy’s) Preseason Fourth Team All-ACC (Phil Steele) Orwin Smith (Jr., AB) Paul Hornung Weekly Honor Roll (9/19) Rod Sweeting (Jr., CB) Honorable Mention All-ACC ACC Defensive Back of the Week (10/17) Steven Sylvester (Sr., LB) (Team co-Captain) Preseason Fourth Team All-ACC (Phil Steele)
Whose Returning, Whose Not In 2012 OFFENSE Quarterback B-Back
2011 HONORS
Injured In ‘11
B.J. Bostic (So.)
Redshirted In ‘11 Vad Lee
Chris Milton Broderick Snoddy Brandon Oliver
Bryan Chamberlain Trey Braun Errin Joe Bryce Sweeney Injured In ‘11
Redshirted In ‘11 Jimmie Kitchen
Anthony Harrell Chaz Cheeks Jabari Hunt-Days
Tyler Marcordes
Jemea Thomas (So., DB) ACC Defensive Back of the Week (10/31) Omoregie Uzzi (Jr., G) First Team All-ACC Preseason All-ACC Outland Trophy Watch List Preseason First Team All-ACC (Phil Steele) Preseason First Team All-ACC (Athlon) Preseason First Team All-ACC (Blue Ribbon) ACC Offensive Lineman of the Week (9/19) ACC Offensive Lineman of the Week (9/26) Third Team Midseason All-American (Phil Steele) Tevin Washington (Jr., QB) Maxwell Award Watch List Rivals’ ACC Player of the Week (Oct. 31)
TEAM PLAYERS OF THE WEEK in wins only Game WCU MTSU KU UNC NCST MD Clemson Duke
Offense S. Hill T. Washington O. Smith T. Melton/S. Hill R. Jones O. Smith T. Washington T. Melton
Defense L. Walls I. Johnson S. Sylvester J. Attaochu I. Cross R. Reid J. Thomas B. Watts
Special Teams None J. Thomas J. Thomas D. Waller S. Tobin None S. Poole J. Thomas
ACC PLAYERS OF THE WEEK Fred Holton (So.) Demond Smith Lance Richardson (So.) Nick Luly Domonique Noble Injured In ‘11
Redshirted In ‘11
9-6 9-19 9-26 9-26 9-26 10-3 10-17 10-31
Receiver of the Week Off. Lineman of the Week Off. Lineman of the Week Linebacker of the Week Defensive Back of the Week Specialist of the Week Defensive Back of the Week Defensive Back of the Week
Stephen Hill Omoregie Uzzi Omoregie Uzzi Jeremiah Attaochu Isaiah Johnson Justin Moore Rod Sweeting Jemea Thomas
RAMBLINWRECK.COM
STEPHEN HILL GIVES TECH BIG-PLAY THREAT When junior WR Stephen Hill’s number has been called this season, he has usually responded with a big play: Hill has nine receptions of 40 yards or longer and three catches of 70 yards or longer. Four of his 26 receptions have been for touchdowns. Has three 100-yard receiving games this season and two games with 150 yards. He has more than 1,200 career receiving yards. Hill’s 181 receiving yards vs. Western Carolina were the 15th-most single-game yards in Tech history. Hill averages 30.2 yards per reception, which ranks first nationally. The NCAA single-season record is 31.9 yards per catch by Tulsa’s Brennan Marion in 2007. Not only does Hill lead the nation in yards per reception, he dominates the category. Only one other player -- Fresno State’s Jalen Saunders (21.30 ypr) -- averages at least 20 yards per catch. Hill’s career average for yards per catch is 25.8. The NCAA record is 24.4 by Fresno State’s Henry Ellard in 1982. Hill, against North Carolina, made one of the great one-handed catches in college football this season: http://www.youtube.com/watch?v=rcs-iqymQrk He made another remarkable catch vs. Clemson: http://www.youtube.com/watch?v=kfALNRblfXk NCAA Yards Per Reception 1. Stephen Hill Georgia Tech 2. Jalen Saunders Fresno State 4. Jordan Matthews Vanderbilt 3. Patrick Edwards Houston 5. Titus Davis Central Michigan
30.19 21.30 19.51 19.29 18.78
WASHINGTON-TO-HILL: A CAPITAL DUO On a team known for its rushing attack, juniors Tevin Washington and Stephen Hill have quietly developed into one of the top home run passing combinations in Georgia Tech history. Three of the 24 longest pass plays in Yellow Jacket history have been Washington to Hill, and two of those long plays (82 and 77 yards) came in the season opener against Western Carolina. To put Tech’s longest pass plays into perspective, consider that Tech’s greatest receiver, Calvin Johnson, is not on the list of the 24 longest pass plays. Also, Washingtonto-Hill is the only quarterback-receiver combination that is on the list three times. In fact, Joe Hamilton-to-Dez
White (two times) is the only other combination listed more than once. LONGEST PASS PLAYS IN GEORGIA TECH HISTORY 96 (td) B. Shaw to Charlie Rogers UCF, 1996 90 (td) T. Peeples to Drew Hill Duke, 1978 88 (td) J. Shaw to D. Thomas Duke, 2008 87 (td) J. Nesbitt to E. Peeples Vanderbilt, 2009 87 (td) D. Gast to Greg Lester Duke, 1987 82 (td) T. Washington to S. Hill WCU, 2011 82 (td) S. Jones to K. Walker Maryland, 1991 81 (td) S. Jones to B. Rodriguez Clemson, 1989 80 (td) R. Ball to Nate Curry Syracuse, 2004 80 (td) J. Hamilton to Dez White Maryland, 1999 80 (td) J. Hamilton to D. White FSU, 1999 80 (td) G. Stroman to C.Williams Maryland, 1994 80 (td) D. Davis to D. Steagall Furman, 1993 80 (td) M. Kelley to L. Chadwick N. Dame, 1979 80 (td) K. King to John Sias TCU, 1967 79 (td) T. Washington to S.Hill Duke, 2010 79 (td) C. Booker to . Dwyer Gardner-Webb, 2008 79 R. Strom to S. Davenport Citadel, 1987 79 (td) E. Holtsinger to J. Kilzer Auburn, 1945 78 (td) S. Jones to W. Bell Chattanooga, 1990 78 (td) K. Bonifay to John Sias Duke, 1968 77 (td) T. Washington to S. Hill WCU, 2011 77 T. Luginbill to O. Cassidy UNC, 1994 77 (td) E. McAshan to J. Robinson M. State, 1972
BURNETT FITS THE PART At 5-10, 220 pounds, junior Julian Burnett may not fit the physical description of an inside linebacker in Al Groh’s 3-4 defense. However, the player Paul Johnson once called a “heat-seeking missile” makes up for his stature with effort and speed. Burnett has 113 tackles this season -- that’s 44 more than any other Yellow Jacket player. It also ranks him fifth in the ACC and 32nd nationally. He has produced double-digit tackles in a game five times this season. Burnett leads the team in tackles for loss (9.5). He has forced one fumble and has one fumble recovery. MORE EFFICIENT IN 2011 Georgia Tech ranks 19th nationally in pass efficiency (152.6). Last season the Jackets were near the bottom of the pack, ranking 113th in efficiency (102.00).
TEAM STATS UNDER PAUL JOHNSON
TECH RECORDS BROKEN IN 2011
Category 2011 2010 2009 2008 Rushing Offense 316.83 (3) 323.3 (1) 295.4 (2) 273.2 (4) Passing Offense 142.75 (112) 83.9 (119) 126.7 (115) 99.2 (116) Total Offense 459.58 (17) 407.2 (36) 442.1 (11) 372.5 (50) Scoring Offense 34.92 (19) 26.0 (71) 33.8 (11) 24.4 (74) Rushing Defense 162.92 (T-70) 169.7 (78) 151.6 (68) 120.3 (24) Pass Defense 198.25 (30) 201.9 (34) 208.6 (47) 193.2 (41) Total Defense 361.17 (45) 371.6 (64) 360.3 (54) 313.5 (25) Scoring Defense 25.75 (60) 25.2 (57) 24.8 (58) 20.3 (28) Net Punting 36.86 (55) 32.2 (114) 38.1 (43) 33.2 (93) Punt Returns 8.00 (63) 5.8 (97) 13.4 (10) 6.7 (88) Kickoff Returns 19.28 (109) 19.9 (97) 21.8 (49) 19.6 (95) Turnover Margin +.17 (T-42) -.47 (86) +.57 (25) +.15 (49) Fumbles Recovered 7 (T-91) 13 (T-21) 14 (15) 11 (38) Passes Intercepted 13 (T-32) 8 (T-99) 12 (50) 18 (15) Fumbles Lost 10 (T-52) 20 (T-119) 12 (79) 20 (118) Passes Had Intercepted 8 (T-23) 7 (T-11) 6 (11) 7 (10) Turnovers Gained 20 (T-64) 21 (T-69) 26 (29) 29 (20) Turnovers Lost 18 (T-28) 27 (T-95) 18 (28) 27 (88) Passing Efficiency 152.55 (19) 102.0 (113) 149.6 (12) 111.9 (92) Pass Efficiency Defense 124.55 (46) 129.1 (63) 136.3 (88) 117.4 (43) Fewest Penalties 4.5 (T-12) 6.2 (74) 6.0 (56) 4.9 (26) Fewest Yards Penalized 37.5 (13) 53.0 (66) 47.1 (34) 43.9 (36) Punt Return Yardage Def. 3.7 (6) 11.6 (98) 7.4 (44) 9.8 (73) Kickoff Return Yardage Def. 20.9 (50) 19.1 (11) 22.5 (83) 19.9 (40) Sacks 1.67 (79) 1.3 (T-101) 1.8 (72) 2.6 (18) Tackles for Loss 4.58 (T-99) 4.5 (T-108) 4.9 (93) 7.3 (13) Sacks Allowed 1.08 (17) 1.2 (23) .86 (5) 1.46 (30) Tackles for Loss Allowed 4.5 (18) 6.0 (70) 5.1 (32) 5.6 (53) 3rd-Down Conversion Pct. 54.88 (1) 40.44 (56) 52.3 (1) 36.7 (84) 4th-Down Conversion Pct. 52.63 (T-55) 55.00 (T-47) 55.6 (41) 42.9 (74) 3rd-Down Defense 43.83 (92) 38.95 (52) 41.04 (82) 38.1 (57) 4th-Down Defense 63.64 (T-106) 47.62 (T-44) 42.86 (38) 40.0 (28) Time of Possession 31:45 (26) 31:53 (21) 33:49 (3) 30:31 (48) First Downs 20.5 (55) 20.4 (T-50) 20.5 (43) 16.5 (103) Opponent First Downs 18.75 (T-37) 19.5 (T-60) 17.2 (22) 17.2 (34) Red Zone Offense 89.0 (T-12) 76.0 (T-98) 82.0 (56) 77.0 (82) Red Zone Defense 81.0 (T-54) 76.0 (T-22) 83.0 (75) 79.0 (37)
MOST TOTAL OFFENSE Yds Rush/Pass 768 604/164 706 NA 662 297/365 627 304/323 623 397/226
2011 GEORGIA TECH FOOTBALL
Opponent, Year Kansas, 2011 Citadel, 1948 W. Carolina, 2011 Virginia, 2000 The Citadel, 1984
ACC RECORDS BROKEN IN 2011 HIGHEST AVERAGE GAIN PER PLAY 13.5 Georgia Tech vs. Kansas Sept. 17, 2011 9.9 Florida State vs. Maryland Nov. 7, 1992 MOST RUSHING YARDS 604 Georgia Tech vs. Kansas Sept. 17, 2011 HIGHEST AVERAGE PER RUSH 12.1 Georgia Tech vs. Kansas Sept. 17, 2011 TOTAL OFFENSE 858 Florida State vs. Maryland 802 Maryland vs. Virginia 797 Florida State vs. Duke 771 Florida State vs. Clemson 768 Georgia Tech vs. Kansas
1992 1975 1995 2000 2011
RUSHING YARDS/TWO TEAMS 933 Maryland vs. Virginia 836 East Carolina vs. Virginia 755 Georgia Tech vs. Kansas
1975 1975 2011
ACC CUMULATIVE STANDINGS LAST 4 SEASONS COMBINED (2008-2011) Rk. School ACC Overall 1. Virginia Tech . . . . . . . . . . . .26-6 . . . . . .42-12 2. Georgia Tech . . . . . . . . . .21-11 . . . . . .34-18 3. Clemson . . . . . . . . . . . . . .20-12 . . . . . .32-21 Florida State . . . . . . . . . . . .20-12 . . . . . .34-18 5. Miami . . . . . . . . . . . . . . . .17-15 . . . . . .29-22 Boston College . . . . . . . . . .17-15 . . . . . .28-24 7. North Carolina . . . . . . . . . .15-17 . . . . . .31-20 NC State . . . . . . . . . . . . . .15-17 . . . . . .27-23 9. Wake Forest . . . . . . . . . . . .13-19 . . . . . .22-27 10. Maryland . . . . . . . . . . . . . .11-21 . . . . . .21-29 Virginia . . . . . . . . . . . . . . .11-21 . . . . . .20-28 12. Duke . . . . . . . . . . . . . . . . . .6-26 . . . . . .15-33 LAST 6 SEASONS COMBINED (2006-2011) Rk. School ACC Overall 1. Virginia Tech . . . . . . . . . . . .39-9 . . . . . .63-18 2. Georgia Tech . . . . . . . . . .32-16 . . . . . .50-30 3. Clemson . . . . . . . . . . . . . .30-18 . . . . . .49-30 4. Boston College . . . . . . . . . .28-20 . . . . . .49-29 5. Florida State . . . . . . . . . . . .27-21 . . . . . .48-30 6. Wake Forest . . . . . . . . . . . .24-24 . . . . . .42-34 7. Miami . . . . . . . . . . . . . . . .22-26 . . . . . .41-35 8. Virginia . . . . . . . . . . . . . . .21-27 . . . . . .34-39 9. Maryland . . . . . . . . . . . . . .19-29 . . . . . .36-40 10. North Carolina . . . . . . . . . .20-28 . . . . . .38-37 NC State . . . . . . . . . . . . . .20-28 . . . . . .35-39 12. Duke . . . . . . . . . . . . . . . . . .6-42 . . . . . .16-56 LAST 7 SEASONS COMBINED (2005-2011) Rk. School ACC Overall 1. Virginia Tech . . . . . . . . . . .46-10 . . . . . .74-20 2. Georgia Tech . . . . . . . . . .37-19 . . . . . .57-34 3. Clemson . . . . . . . . . . . . . .34-22 . . . . . .57-34 4. Boston College . . . . . . . . . .33-23 . . . . . .58-33 5. Florida State . . . . . . . . . . . .32-24 . . . . . .56-35 6. Miami . . . . . . . . . . . . . . . .28-28 . . . . . .50-38 7. Wake Forest . . . . . . . . . . . .27-29 . . . . . .46-41 8. Virginia . . . . . . . . . . . . . . .24-32 . . . . . .41-44 North Carolina . . . . . . . . . .24-32 . . . . . .43-43 10. NC State . . . . . . . . . . . . . .23-33 . . . . . .42-44 11. Maryland . . . . . . . . . . . . . .22-34 . . . . . .41-46 12. Duke . . . . . . . . . . . . . . . . . .6-50 . . . . . .17-66 LAST 8 SEASONS COMBINED (2004-2011) Rk. School ACC Overall 1. Virginia Tech . . . . . . . . . . .53-11 . . . . . .84-23 2. Georgia Tech . . . . . . . . . .41-23 . . . . . .64-39 3. Clemson . . . . . . . . . . . . . .38-26 . . . . . .63-39 Florida State . . . . . . . . . . . .38-26 . . . . . .65-38 5. +Boston College . . . . . . . . .33-23 . . . . . .67-36 6. Miami . . . . . . . . . . . . . . . .33-31 . . . . . .59-41 7. Virginia . . . . . . . . . . . . . . .29-35 . . . . . .49-48 North Carolina . . . . . . . . . .29-35 . . . . . .49-50 9. Wake Forest . . . . . . . . . . . .28-36 . . . . . .50-48 10. NC State . . . . . . . . . . . . . .26-38 . . . . . .47-50 11. Maryland . . . . . . . . . . . . . .25-39 . . . . . .46-52 12. Duke . . . . . . . . . . . . . . . . . .7-57 . . . . . .19-75 + Joined the ACC in 2005 LAST 13 SEASONS COMBINED (1999-2011) Rk. School ACC Overall 1. ^Virginia Tech . . . . . . . . . .53-11 . . . . .131-38 2. Florida State . . . . . . . . . . . .75-30 . . . . .116-52 3. Georgia Tech . . . . . . . . . .64-40 . . . . .103-63 4. Clemson . . . . . . . . . . . . . .62-42 . . . . .101-63 5. +Boston College . . . . . . . . .33-23 . . . . .107-58 6. ^Miami . . . . . . . . . . . . . . .33-31 . . . . .114-49 7. Virginia . . . . . . . . . . . . . . .52-52 . . . . . .84-76 8. Maryland . . . . . . . . . . . . . .49-55 . . . . . .87-72 9. NC State . . . . . . . . . . . . . .46-58 . . . . . .87-73 10. Wake Forest . . . . . . . . . . . .41-63 . . . . . .77-80 North Carolina . . . . . . . . . .41-63 . . . . . .71-86 12. Duke . . . . . . . . . . . . . . . . .12-92 . . . . .28-123 + Joined the ACC in 2005 ^ Joined the ACC in 2004
TECH vs. THE ACC DIVISIONS vs. Coastal Home Away vs. Atlantic Home Away Neutral TOTAL
‘05 ‘06 3-2 5-0 1-0 3-0 2-2 2-0 2-1 2-2 2-1 1-0 0-0 1-1 0-0 0-1 5-3 *7-2
‘07 ‘08 ‘09 3-2 2-3 4-1 1-1 2-1 2-0 2-1 0-2 2-1 1-2 3-0 4-0 1-1 1-0 2-0 0-1 2-0 1-0 0-0 0-0 1-0 4-4 5-3 *8-1
‘10 3-2 2-1 1-1 1-2 0-1 1-1 0-0 4-4
'11 2-3 1-1 1-2 3-0 2-0 1-0 0-0 5-3
Total 22-13 12-4 10-9 16-7 9-3 6-3 1-1 38-20
*Includes 2006 and 2009 ACC Championship Games
RAMBLINWRECK.COM
ORWIN SMITH: MR. VERSATILITY Junior A-back Orwin Smith has been highly productive this fall as a runner, receiver and kick returner: Smith averages 10.3 yards per rushing attempt. He has scored a touchdown every 5.45 carries -- 11 touchdowns, 60 carries. Smith averages 23.5 yards per reception. His 12 touchdowns (11 rushing, 1 receiving) rank tied for second in the ACC. Smith rushed for three touchdowns at NC State. Smith has more than 1,100 career rushing yards, 1,300 kickoff return yards and 3,000 all-purpose yards. He has more than 1,200 all-purpose yards this season alone. Smith’s 95-yard run on Tech’s first play of the game against Kansas was the longest run from scrimmage in Georgia Tech history. Against Kansas, Smith rushed for 157 yards and a touchdown, and had 108 yards receiving and a TD. He became the first player in Tech history to have more than 100 rushing and receiving yards in the same game. He was the first ACC player to have 100 or more yards in rushing and receiving in the same game since Mikell Simpson of Virginia vs. Maryland on Oct. 20, 2007. He was the first ACC player with 100-plus yards and a touchdown in both receiving and rushing in the same game since Thomas Jones of Virginia vs. Buffalo on Nov. 13, 1999. Smith owns three of the 19 longest rushing attempts in Tech history. GEORGIA TECH’S LONGEST RUSHING ATTEMPTS 95 (td) Orwin Smith Kansas, 2011 88 (td) Jonathan Dwyer Mississippi State, 2008 87 (td) Bob McCoy Citadel, 1948 86 (td) Gerry Bussell Georgia, 1962 85 (td) #Jonathan Dwyer North Carolina, 2008 85 (td) Morris Harrison Citadel, 1947 83 (td) Robert Lavette Navy, 1981 82 (td) Anthony Allen Clemson, 2009 82 (td) Buck Flowers Georgetown, 1920 80 (td) Eddie Lee Ivery Air Force, 1978 79 (td) Jerry Mays NC State, 1986 77 (td) Orwin Smith Western Carolina, 2011 77 (td) Bill Teas LSU, 1954 75 (td) Jimy Lincoln Furman, 1993 74 (td) Jonathan Dwyer Jacksonville State, 2009 73 (td) Orwin Smith North Carolina, 2010 73 (td) Tashard Choice Samford, 2007 73 Nate Kelsey Virginia, 1986 73 (td) Eddie Lee Ivery Air Force, 1978
IT’S JUST: GEORGIA TECH It is incorrect to call it “Georgia Tech University.” Officially, it’s The Georgia Institute of Technology. But just call us “Georgia Tech.”
MOST WINS IN A 4-YEAR SPAN
MOST WINS IN A 3-YEAR SPAN
4-Year Span 1951-1954 1950-1953 2006-2009 1953-1956 1952-1955 1998-2001 1949-1952 2008-2011 1997-2000 2007-2010 1946-1949
3-Year Span 1951-1953 1952-1954 1950-1952 2007-2009 1998-2000 1954-1956 2008-2010 1989-1991 1953-1955 1946-1948 2009-2011 1942-1944 2006-2008 1999-2001 1997-1999
W-L-T 40-5-2 37-8-2 36-18 36-7-2 36-6-2 35-14 35-9-1 34-18 34-14 33-20 33-9
W-L-T 32-2-2 29-5-1 28-6-1 27-13 27-9 27-5-1 26-14 26-9-1 26-6-2 26-6 25-14 25-8 25-15 25-12 25-11
SPECIAL TEAMS COACHING ASSIGNMENTS Coach Assignment Charles Kelly . . . . . . . . . . . . . . . . . . . . .Punt, Punt Return Andy McCollum . . . . . . . . . . . . . . . . . . . .Field Goal Block Buzz Preston . . . . . . . . . . . . . . . . . . . . . . .Kickoff Return Mike Sewak . . . . . . . . . . . . . . . . . . . . . . .PATs, Field Goal
2011 GEORGIA TECH FOOTBALL
JOHNSON IS 12-3 IN THE CLOSE ONES In his four seasons at Tech, Paul Johnson is 12-3 in games decided by five points or less. Since 2004, his teams are 25-10 in games decided by five points or less. Paul Johnson Games decided by 5 pts Games decided by 4 pts Games decided by 3 pts Games decided by 2 pts Games decided by 1 pts Total
2011 1-0 0-0 0-1 0-0 0-0 1-1
2010 0-0 1-0 0-1 0-0 0-0 1-1
2009 3-0 0-0 2-0 0-0 0-0 5-0
2008 0-0 1-0 4-1 0-0 0-0 5-1
Tech’s Nail-Biters Under Johnson Oct. 15, 2011 at Virginia Oct. 8, 2011 vs. Maryland Oct. 2, 2010 at Wake Forest Sept. 11, 2010 at Kansas Dec. 5, 2009 vs. #25 Clemson Nov. 7, 2009 vs. Wake Forest (OT) Oct. 17, 2009 vs. #4 Virginia Tech Oct. 10, 2009 at Florida State Sept. 10, 2009 vs. Clemson Nov. 29, 2008 at #13 Georgia Nov. 1, 2008 vs. #16 Florida State Oct. 18, 2008 at Clemson Oct. 11, 2008 vs. Gardner-Webb Sept. 13, 2008 at Virginia Tech Sept. 6, 2008 at Boston College
Total 4-0 2-0 6-3 0-0 0-0 12-3
L, 21-24 W, 21-16 W, 24-20 L, 25-28 W, 39-34 W, 30-27 W, 28-23 W, 49-44 W, 30-27 W, 45-42 W, 31-28 W, 21-17 W, 10-7 L, 17-20 W, 19-16
MORE ON PAUL JOHNSON Only four coaches in ACC history won more games in their first four seasons than Johnson. With a win in the bowl game, Johnson will tie Bobby Ross and Chuck Amato for the third-most wins. Johnson’s winning percentage in ACC games (.656, 21-11) is the ninth-highest in the history of the league. Tech has scored at least one rushing touchdown in 47 of 52 games under Johnson. The Yellow Jackets have won 34 games in four years under Johnson. In 12 of those 34 wins, Tech has trailed by seven points or more. MOST WINS IN FOURTH YEAR/ACC HISTORY 1. Ralph Friedgen Maryland 2001-04 2. Danny Ford Clemson 1979-82 3. Bobby Ross Maryland 1982-85 Chuck Amato NC State 2000-03 5. Paul Johnson Georgia Tech 2008-11 Lou Holtz NC State 1972-75
36-14-0 35-10-1 34-14-0 34-17-0 33-18-0 33-12-3
CAREER VICTORIES / ACTIVE FBS COACHES 1. Frank Beamer Virginia Tech 2. Mack Brown Texas 3. Chris Ault Nevada 4. Steve Spurrier South Carolina 5. Brian Kelly Notre Dame 6. Dennis Erickson Arizona State 7. Mike Price UTEP 8. Larry Blakeney Troy 9. Bill Snyder Kansas State 10. Howard Schnellenberger FAU 11. Gary Pinkel Missouri 12. Paul Pasqualoni Connecticut 13. Paul Johnson Georgia Tech 14. Nick Saban Alabama 15. Bob Stoops Oklahoma
250 226 225 196 188 180 174 163 159 157 156 146 140 139 137
ALL-TIME WINNING PERCENTAGE / ACC COACHES 1. Frank Beamer Virginia Tech 83-22-0 2. Bobby Bowden Florida State 173-53-1 3. Danny Ford Clemson 96-29-4 4. Lou Holtz NC State 33-12-3 5. Ken Hatfield Clemson 32-13-1 6. Jim Tatum Md/UNC 41-19-2 7. Larry Coker Miami 25-12-0 8. Jerry Claiborne Maryland 72-37-3 9. Paul Johnson Georgia Tech 33-18-0 10. Dick Sheridan NC State 52-29-3
.790 .764 .760 .719 .707 .677 .675 .656 .547 .637
ALL-TIME WIN PERCENTAGE / ACC GAMES 1. Frank Beamer Virginia Tech 55-12-0 2. Bobby Bowden Florida State 118-27-0 3. Jerry Claiborne Maryland 46-11-1 4. Bill Murray Duke 54-15-2 5. Danny Ford Clemson 44-14-1 6. Lou Holtz NC State 16-5-2 7. Jim Tatum Md/UNC 21-9-2 8. Frank Howard Clemson 66-30-2 9. Paul Johnson Georgia Tech 21-11-0 10. Bo Rein NC State 15-8-0
.821 .814 .802 .775 .754 .739 .687 .684 .656 .652
CAREER GAMES STARTED Player ‘08 ‘09 ‘10 ‘11 Strk TOT Roddy Jones, Sr., AB 13 13 13 12 38 51 Logan Walls, Sr., DT 0 11 12 12 15 35 Tyler Melton, Sr., WR 7 10 5 12 13 34 Steven Sylvester, Sr., LB 0 9 13 9 3 31 Jason Peters, Sr. DE 0 4 13 12 25 29 Izaan Cross, Jr., DE -2 13 12 25 27 Rashaad Reid, Sr., DB 8 6 1 12 13 27 Omoregie Uzzi, Jr., OG --- 13 12 25 25 Julian Burnett, Jr., LB -3 8 12 20 23 Stephen Hill, Jr., WR -1 9 12 12 22 Will Jackson, So., OG --9 12 14 21 Phil Smith, Jr., OT -4 8 8 6 20 Orwin Smith, Jr., AB --6 10 -16 Tevin Washington, Jr., QB --4 12 16 16 Isaiah Johnson, So., S --3 12 12 15 Jay Finch, So., C/OG --3 11 4 14 Rod Sweeting, Jr., CB ---- 12 12 12 Louis Young, So., CB ---- 12 12 12 Ray Beno, So., OT ---- 11 2 11 David Sims, So., BB ---- 11 10 11 Jeremiah Attaochu, So., LB --1 9 1 10 Embry Peeples, Sr,. AB 0 1 4 2 2 7 Quayshawn Nealy, Fr., LB ---7 6 7 Daniel Drummond, So., LB ---5 1 5 Tyler Kidney, So., OT ---5 -5 Brandon Watts, So., LB --3 1 1 4 Michael Peterson, Sr., DB 0 2 0 1 -3 T.J. Barnes, Jr., DT -2 1 --3 Nick McRae, Jr., OG --1 1 -2 Christopher Crenshaw, So. DE -- --2 1 2 Tony Zenon, Fr., AB ---1 -1 Malcolm Munroe, Jr. LB ---1 -1 Jemea Thomas, So., S ---1 -1
CAREER GAMES PLAYED Player Rashaad Reid, Sr., DB Roddy Jones, Sr., AB Steven Sylvester, Sr., LB Michael Peterson, Sr., DB Jason Peters, Sr., DE Chandler Anderson, Sr., P Embry Peeples, Sr., AB Tyler Melton, Sr., WR Logan Walls, Sr, DT T.J. Barnes, Jr., DT Rod Sweeting, Jr. CB Orwin Smith, Jr., AB Julian Burnett, Jr., LB Izaan Cross, Jr., DE Stephen Hill, Jr., WR Omoregie Uzzi, Jr., OL Phil Smith, Jr., OT Jemea Thomas, So., S Preston Lyons, Sr. BB Daniel McKayhan, Jr. WR Tyler Morgan, Jr., LS Richard Watson, Jr., BB Nick McRae, Jr., OL Malcolm Munroe, Jr., LB Isaiah Johnson, So., S B.J. Machen, Jr., LB Louis Young, So., CB Brandon Watts, So., LB Will Jackson, So., OL Jamal Paige, Jr., AB Jeremiah Attaochu, So., LB Jay Finch, So., C Tevin Washington, Jr., QB Sean Poole, So., P Emmanuel Dieke, So., DE Jon Lockhart, Jr., WR Tyler Kidney, So., OL David Sims, So., QB Ray Beno, So., C Euclid Cummings, So., DE Justin Moore, So., K Robert Godhigh, So., AB Fred Holton, So., S B.J. Bostic, So., AB David Scully, So., P Corey Dennis, Fr. Deon Hill, Fr., AB Chris Jackson, Jr., WR Quayshawn Nealy, Fr. LB Darren Waller, Fr., WR/DB Kyle Travis, Fr., LB Charles Perkins, Fr., RB Shaq Mason, Fr., OL Jeff Greene, Fr., WR Jamal Golden, Fr., DB Daniel Drummond, So., LB
‘08 13 13 12 12 10 13 8 10 3 ------------------------------------------------
‘09 14 13 14 14 13 14 13 10 14 14 14 14 13 13 13 12 13 14 13 8 11 6 4 12 -13 ---11 --1 --12 ---------------------
‘10 ‘11 Total 13 12 52 13 12 51 13 11 50 12 11 49 13 12 48 13 6 46 13 12 46 13 12 45 13 12 42 13 12 39 13 12 39 13 11 38 13 12 38 13 12 38 12 12 37 13 12 37 10 10 33 0 12 33 9 10 32 10 12 30 13 5 29 13 10 29 13 12 29 5 12 29 13 12 25 0 12 25 12 12 24 12 11 23 11 12 23 9 2 22 12 10 22 11 10 21 8 12 21 9 12 21 9 11 20 5 2 19 6 11 17 5 12 17 3 12 15 3 12 15 2 12 14 9 5 14 13 -13 12 -12 2 10 12 -- 12 12 -- 12 12 -- 12 12 -- 12 12 -- 12 12 -- 11 11 -- 11 11 -- 11 11 -- 11 11 -- 10 10 -- 10 10
RAMBLINWRECK.COM
EMORY HEALTHCARE INJURY UPDATE A look at Georgia Tech’s injury situation: Out: TBD Out for the season: B.J. Bostic, RB Fred Holton, S Jimmie Kitchen, DL Lance Richardson, S JACKETS ONE OF NATION’S YOUNGEST TEAMS Georgia Tech has just 10 scholarship seniors. Just two seniors -- A-back Roddy Jones and wide receiver Tyler Melton -- start on offense. There are no senior offensive linemen on the roster. Four seniors -- tackle Logan Walls, end Jason Peters, linebacker Steven Sylvester and safety Rashaad Reid -- start on defense. Out of Tech’s 56 touchdowns, 48 have been scored by non-seniors. Off the 46 players on the two-deep, 24 are either sophomores or freshmen. TEN FRESHMEN SEEING ACTION IN 2011 Head coach Paul Johnson always says that he will get his best players on the field, regardless of class. That held true in 2011 as 10 true freshmen have seen action in 2011, the most in one season under Johnson. TRUE FRESHMEN WHO DID NOT REDSHIRT 2008 2009 2010 2011 T. Melton J. Burnett J. Attaochu C. Dennis E. Peeples I. Cross B.J. Bostic J. Greene R. Reid S. Hill F. Holton J. Golden J. Shaw T. Morgan I. Johnson Z. Laskey S. Sylvester O. Smith J.Moore S. Mason C. Taylor R. Sweeting L. Young T. McNair M. Wright J. Thomas N. Menocal S. Tobin K. Travis D. Waller
THE “GOON SQUAD” Georgia Tech's offensive line includes no seniors and has just 98 combined career starts. The self-proclaimed "Goon Squad" is a key to Tech's prolific offense. Career Starts / Tech Offensive Line Omoregie Uzzi, Jr., G . . . . . . . . . . . .25 Will Jackson, So., G . . . . . . . . . . . . .21 Phil Smith, Jr., T . . . . . . . . . . . . . . . .20 Jay Finch, So., C . . . . . . . . . . . . . . . .14 Ray Beno, So., T . . . . . . . . . . . . . . .11 Tyler Kidney, So., T . . . . . . . . . . . . . . .5 Nick McRae, Jr., C . . . . . . . . . . . . . . . .2
KEEPING UP WITH JONES Senior Roddy Jones is just the 17th player in Yellow Jacket history to rush for 1,700 career yards. He currently has 1,826 yards, which ranks 16th in school history. Remarkably, Jones has accumulated those yards with just 238 rushing attempts for an average of 7.67 yards per carry. TOP RUSHING GAMES IN PAUL JOHNSON ERA Yards Player Opponent Date 214 Roddy Jones at Georgia Nov. 29, 2008 195 Anthony Allen vs. Virginia Oct. 9, 2010 189 Jonathan Dwyer vs. Wake Forest Nov. 7, 2009 186 Jonathan Dwyer at Vanderbilt Oct. 31, 2009
YELLOW JACKET BIRTHDAYS Dec. 11, 1989 Rashaad Reid Dec. 14, 1991 Charles Perkins Dec. 17, 1970 Brian Bohannon (Assistant Coach) Dec. 17, 1992 Andrew Chau Dec. 19, 1991 Anthony Williams Dec. 19, 1955 Todd Spender (Assistant Coach) Dec. 23, 1991 Justin Moore Dec. 26, 1990 Julian Burnett Dec. 29, 1990 Corey Alford Jan. 3, 1993 Broderick Snoddy
2011 GEORGIA TECH FOOTBALL
FOUR JACKETS GRADUATING THIS MONTH Four Yellow Jackets -- seniors Chandler Anderson, Preston Lyons and Steven Sylvester, and junior B.J. Machen -- will earn their Georgia Tech degrees Dec. 17. The commencement ceremony takes place at 2 p.m. in the Georgia Dome. Roddy Jones, Tyler Melton, Jason Peters, Michael Peterson and Logan Walls played this season as graduate students. TECH AT HISTORIC BOBBY DODD STADIUM No team in college football has won more games in its current home stadium than Georgia Tech. The Yellow Jackets are 443-184-21 all-time in Bobby Dodd Stadium.
PAUL JOHNSON’S OFFENSE FOR DUMMIES Georgia Tech’s offense is called the spread option. It is not the “triple option”. The triple option is just one play, or a series of plays, within the offense. Tech runs the triple option roughly 20 percent of the time. There are two A-Backs, or slot-backs, that line up outside and behind the tackles (there is no tight end). The A-Back is a hybrid position, part runner and part receiver. The B-Back many people call the fullback because he lines up directly behind the quarterback. There are two wide receivers, who usually receive single coverage. The quarterback is very rarely in the shotgun, but otherwise there are more similarities with the popular spread offenses than most people think.
SEVEN DAYS / MORE THAN SEVEN DAYS Since Paul Johnson’s arrival at Georgia Tech in 2008, opponents who beat Georgia Tech and play seven days later are 3-8 the week after beating the Yellow Jackets. One myth is that Tech struggles against teams that have more than seven days to prepare. The Jackets are 3-2 this season vs. teams that had more than seven days of preparation. Over the last four years, Tech has won 10 games in that situation. ESPN THURSDAY NIGHT REGULARS The Yellow Jackets played in an ESPN nationally-televised Thursday night game for the 19th consecutive season when Tech hosted Virginia Tech Nov. 10.
QUICK FACTS ABOUT EL PASO • El Paso stands on the Rio Grande, across the border from Ciudad Juárez, Chihuahua, Mexico. • The sun shines 302 days per year on average. In December, the average high temperature is 57.4 degrees, the average low 33.4. The record high was 80 degrees, the record low -5 degrees. Average December snowfall: 1.8 inches. • Nicknamed “The Sun City,” El Paso was incorporated in 1873. It’s the sixth-largest city in Texas and the 19th-largest city in the United States. In 2010 El Paso was awarded an All-America City Award. • Population: 649,211. Elevation: 3,800.
ESPN THURSDAY NIGHT GAMES Year Opponent Site 1991 #20 Virginia H 1993 #25 Virginia H 1994 #7 Arizona H 1995 #16 Maryland H 1996 Duke H 1996 Maryland A 1997 #5 North Carolina H 1998 Clemson A 1999 Maryland H 2000 NC State A 2000 Virginia H 2001 Maryland H 2001 North Carolina H 2002 Maryland A 2003 Brigham Young A 2003 Maryland H 2004 #22 Virginia Tech H 2005 NC State H 2006 Virginia H 2007 #11 Virginia Tech H 2008 #23 Miami H 2009 Clemson H 2009 #22 Miami A 2010 #20 Virginia Tech A 2011 #10 Virginia Tech H
Result W, 24-21 L, 14-35 L, 14-19 W, 31-3 W, 48-22 L, 10-13 L, 13-16 W, 24-21 W, 49-31 L, 23-30 (ot) W, 35-0 L, 20-17 (ot) W, 28-21 L, 10-34 L, 13-24 W, 7-3 L, 20-34 L, 14-17 W, 24-7 L, 3-27 W, 41-23 W, 30-27 L, 17-33 L, 21-28 L, 26-37
TECH’S OVERTIME HISTORY Georgia Tech is 4-3 all-time in overtime games. The Jackets’ last overtime game was a 30-27 win over Wake Forest on Nov. 7, 2009. GEORGIA TECH’S START WAS HISTORIC Georgia Tech started 6-0 for the first time in 45 years, since 1966, and for the 13th time in the 119-year history of the program. The Yellow Jackets were 3-0 in the ACC for the first time since 2006. Tech started 2-0 on the road for the first time since 2001.
• Home to The University of Texas at El Paso (founded in 1914 as The Texas State School of Mines and Metallurgy). • Fort Bliss, one of the largest military complexes of the United States Army, lies to the east and northeast of the city. • The Franklin Mountains nearly divide the city into two sections. • El Paso lies at the intersection of three states: Texas, New Mexico and Chihuahua(Mexico). • Only major Texas city on Mountain Time. •The 24,000-acre Franklin Mountains State Park is the largest urban park in the United States and resides entirely in El Paso. El Paso is surrounded by the Chihuahuan Desert. • El Paso is closer to four other state capitals than Austin, Texas. • More than 70 Fortune 500 companies have offices in El Paso. • El Paso is the second largest city without a major sports team. • Elvis Presley, Steve McQueen and Ali McGraw all stayed at the once luxurious El Paso International Hotel, now a Doubletree Hotel. •The Tigua Indian Reservation Ysleta del Sur Pueblo, located in El Paso County, is one of two Indian reservations in Texas. •The El Paso area has the largest pecan orchard in the world, Stahman Farms. • El Paso is the sight of the actual first Thanksgiving in April, 1598, predating the Pilgrims by 23 years. • El Paso International Airport (ELP) is a public airport located four miles northeast of the central business district. There are 15 gates for: American Airlines, American Eagle, Delta Air Lines and Delta Connection, Southwest Airlines, US Airways, US Airways Express, Continental Airlines, Continental Exoress and United Express.
MISCELLANEOUS
GEORGIA TECH SPORTS INFORMATION
With one more win, Georgia Tech (8-4) will have a three-win improvement over last year’s 6-7 record. The last time the Yellow Jackets improved by three wins from one season to the next came in 1997 (7-5) to 1998 (102). The ACC will welcome Pittsburgh and Syracuse at some point in the future. Georgia Tech is 5-2 all-time vs. Pitt, but the two teams have not met since 1976. The Yellow Jackets and Panthers played in the 1956 Sugar Bowl. Tech is 2-0 all-time vs. Syracuse, with the most recent meeting coming in the 2004 Champs Sports Bowl.
Football Contact (Assistant AD) ...........Dean Buchan E-mail ...........................dbuchan@athletics.gatech.edu Office.....................................................404.894.5445 Cell ........................................................404.295.8703 Assistant SID (Secondary FB contact)...Mike DeGeorge E-mail .......................mdegeorge@athletics.gatech.edu Office.....................................................404.894.5445 Cell ........................................................404.263.9478 Associate SID .........................................Mike Stamus Assistant SID......................................Marcus Dittmer Director of New Media ......................Dan Goldberger SID Assistant .........................................Betsy Devine
RAMBLINWRECK.COM
FEATURE STORIES NOTEBOOK HOLTON GETS ENCOURAGEMENT FROM A FALCON Georgia Tech sophomore safety Fred Holton tore his Achilles tendon in an August scrimmage and is out for the 2011 season. The news was tough to swallow for Holton, who was competing for a starting job and had worked extremely hard over the off-season. Holton, however, got some encouragement out of the blue from Atlanta Falcons wide receiver Harry Douglas. When Douglas, who overcame a serious injury of his own, heard the news about Holton, he reached out to the Yellow Jacket DB via Twitter. Douglas sent a series of four Tweets to Holton, offering encouragement and giving him his cell number. YELLOW JACKET ARTISTS Senior cornerback Michael Peterson and junior wide receiver Daniel McKayhan are both exceptional artists. The Yellow Jacket duo found an unusual spot to hone their painting skills – a multi-level homeless shelter in downtown Atlanta. Peterson earned his degree in the spring, and is playing an important role on defense this fall. His oil paintings have been featured in the Atlanta Journal-Constitution and on NCAA.com. MAGNA CARTER Several Yellow Jackets players had interesting and productive internships over the summer, but perhaps most noteworthy was junior linebacker Morgan Carter. The Rutgers transfer interned with the U.S. Supreme Court in Washington, DC.
THE DAYS FAMILY Redshirt freshman quarterback Synjyn Days is joined on the Yellow Jacket team this fall by his brother, true freshman linebacker Jabari Hunt-Days. But perhaps the most interesting story concerning the Days family is that Synjyn’s mother, Paula, was an assistant coach on his middle school team. Paula coached the offensive and defensive lines. MEDICAL CONDITION HALTS McCOY’S CAREER Defensive lineman Denzel McCoy found out before the season that a rare heart condition known as "Cardiomyopathy" may have prematurely ended his football career. McCoy redshirted last season after learning of the condition in 2010, but had hoped that he would eventually be cleared to play. McCoy will continue to receive a scholarship at Tech and is assisting the program as a student assistant. FEATURES NOTEBOOK Senior linebacker Steven Sylvester was a childhood friend of Atlanta Braves slugger Jason Heyward in McDonough, Ga. Sophomore kicker Justin Moore, earlier this year, received some individual coaching from Morten Anderson -- the former Atlanta Falcon who is the all-time leading scorer in NFL history.
FIVE GRADUATES Five Yellow Jackets are playing this fall as graduate students. Roddy Jones, Tyler Melton, Jason Peters, Michael Peterson and Logan Walls have already received their undergraduate degrees.
TECH PLAYERS IN THE NFL (24)
Baltimore Ravens Buffalo Bills Cincinnati Bengals Dallas Cowboys Denver Broncos Detroit Lions Green Bay Packers Houston Texans Indianapolis Colts Jacksonville Jaguars New England Patriots Pittsburgh Steelers Seattle Seahawks St. Louis Rams Tampa Bay Bucs Tennessee Titans Washington Redskins
Player Pos Yrs Kevin Cone WR R Michael Cox FB 4 Vance Walker DT 2 Anthony Allen RB R Joshua Nesbitt QB/DB R Michael Johnson LB 2 Keith Brooking LB 13 Mario Butler CB R Demaryius Thomas WR 1 Will Heller TE 9 Calvin Johnson WR 4 Morgan Burnett DB 1 Andrew Gardner OL 2 Philip Wheeler LB 3 Daryl Smith LB 7 Gary Guyton LB 3 Jonathan Dwyer RB 1 Anthony Hargrove DT 8 James Butler S 6 Andrew Economos LS 5 Derrick Morgan DE 1 Tashard Choice RB 3 Keyaron Fox LB 7 Dawan Landry S 6
Head Coach Arizona Cardinals
Ken Whisenhunt
Assistant Coaches Dallas Cowboys New England Patriots
Jimmy Robinson George Godsey
2011 GEORGIA TECH FOOTBALL
GENERAL Location . . . . . . . . . . . . . . . . . . . .Atlanta, GA 30332 Founded . . . . . . . . . . . . . . . . . . . . . . . . . . . . .1885 Enrollment . . . . . . . . . . . . . . . . . . . . . . . . . .19,404 Nicknames . . . . . . . .Yellow Jackets, Rambling Wreck Colors . . . . . . . . . . . . . . . . . . . . .Old Gold and White Conference . . . . . . . .Atlantic Coast (Coastal Division) President . . . . . . . . . . . . . . . .Dr. G.P. “Bud” Peterson Alma Mater . . . . . . . . . . . . . . . .Kansas State (1977) Director of Athletics . . . . . . . . . . . .Dan Radakovich Alma Mater . . . .Indiana Univ. of Pennsylvania (1980) Stadium . . . . . . . . . .Bobby Dodd Stadium/Grant Field Surface . . . . . . . . . . . . . . . . . . . . . . . .Natural Grass Capacity . . . . . . . . . . . . . . . . . . . . . . . . . . . .55,000 Basic Offense . . . . . . . . . . . . . . . . . . .Spread Option Basic Defense . . . . . . . . . . . . . . . . . . . . . . . . . .3-4 HISTORY First Year of Football . . . . . . . . . . . . . . . . . . .1892 Number of Seasons . . . . . . . . . . . . . . . . . . . . . .119 All-Time Record . . . . . . . . . . . . . . . . . . .687-460-43 All-Time W-L at Bobby Dodd Stadium .443-184-21 Bowl Appearances . . . . . . . . . . . . . . . . .39 (22-17) Consecutive Bowl Appearances . . . . . . . . . . . . .14 First Year Competed For ACC Title . . . . . . . . .1983 National Championships . . . . .4 (1990, ‘52, ‘28, ‘17) ACC Championships . . . . . . . .3 (2009, 1998, 1990) SEC Championships . . . . . . . . . . . . . . . . . . . . . . .5 Southern Conference Championships . . . . . . . . .3 2010 SUMMARY 2010 Record . . . . . . . . . . . . . . . . . . . . . . . . . . .6-7 2010 Bowl .Independence Bowl (L, 7-14 vs. Air Force) 2010 ACC Record . . . . . . . . . . . . . . . . . . . . . . .4-4 2010 Coastal Division Finish . . . . . . . . . . .(tie) 3rd COACHING STAFF Head Coach . . . . . . . . . . . . . . . . . . . . .Paul Johnson Alma Mater . . . . . . . . . . . . .Western Carolina (1979) Record at Georgia Tech . . . . . . . .34-18 (4 seasons) Record Overall . . . . . . . . . . . . .141-57 (15 seasons) Quarterbacks/B-Backs . . . . . . . . . .Brian Bohannon Defensive Coordinator . . . . . . . . . . . . . . . .Al Groh Secondary . . . . . . . . . . . . . . . . . . . . . .Charles Kelly Defensive Line/Recruiting Coord. . .Andy McCollum A-Backs . . . . . . . . . . . . . . . . . . . . . . . .Lamar Owens Wide Receivers . . . . . . . . . . . . . . .Al “Buzz” Preston Co-Offensive Line . . . . . . . . . . . . . . . . .Mike Sewak Linebackers . . . . . . . . . . . . . . . . . . . . . . .Joe Speed Co-Offensive Line . . . . . . . . . . . . . . . .Todd Spencer Graduate Assistant . . . . . . . . . . . . . . .Shane Bowen Graduate Assistant . . . . . . . . . . . . .Maurice Duncan Staff Assistant . . . . . . . . . . . . . . . .Preston Pehrson Staff Assistant . . . . . . . . . . . . . . . . . . .J.R. Dorman Staff Assistant . . . . . . . . . . . . . . .Andrew Rodrigues Player Development . . . . . . . . . . . . . . .Neal Peduzzi Sports Medicine . . . . . . . . . . . . . . . . . . . .Jay Shoop Director of Operations . . . . . . . . . . . . .Jason Snider Assistant Director of Operations . . . . . . .Mike Huff Director of Player Personnel . . . . . . . . . .Liam Klein Equipment Manager . . . . . . . . . . . . . . .Tom Conner Assistant Equipment Manager . . . . .Punt Windham Administrative Coordinator . . . . . . . . . . .Teri Anton Recruiting Assistant . . . . . . . . . . . . .Courtney Keck
IMPROBABLE DETOUR Following Hurricane Katrina, Louisiana native Tony Zenon and his family fled his home state. The Zenons packed up everything they could, got in the car and began driving with no destination in mind. They stumbled upon Albany, Ga., settled there and Tony began playing at Deerfield Windsor Academy, where he put up remarkable numbers in high school.
Team Atlanta Falcons
QUICK FACTS
50TH ANNIVERSARY OF THE RAMBLIN’ WRECK The Wreck, which celebrated it’s 50th anniversary in 2011, has led the Jackets on the field before every home game since 1961. It has occasionally made some away trips. There have only been 42 different drivers behind the wheel of the wreck over its 50 seasons.
SI: RAMBLIN’ WRECK ONE OF TOP 10 TRADITIONS IN COLLEGE FOOTBALL Sports Illustrated named the “Ramblin’ Wreck”, Georgia Tech’s 1930 Ford Model A, the 10th-best tradition in college football. Sports Illustrated Top 10 College Football Traditions: 1. Ohio State, Script Ohio 2. Auburn, War Eagle 3. Texas A&M, Midnight Yell 4. Army-Navy, March On 5. Clemson, Howard’s Rock 6. Live Mascots, From Texas’ Bevo, to Colorado’s Ralphie and more 7. Florida State, Chief Osceola 8. Wisconsin,Jump Around 9. Notre Dame, Alma Mater 10. Georgia Tech, The Ramblin’ Wreck
RAMBLINWRECK.COM
HEAD COACH PAUL JOHNSON Western Carolina (1979) / 34-18 in 4th Season at Georgia Tech / 141-57 in 15th Season Overall Paul Johnson, a two-time Atlantic Coast Conference Coach of the Year and the mastermind behind Georgia Tech’s high-production offense, is in his fourth season as head coach of the Yellow Jackets. Under Johnson, Georgia Tech was one of college football’s biggest surprise stories in 2008 and won the ACC championship in 2009. The ACC Coach of the Year in 2008 and 2009, Johnson’s teams have appeared in a bowl game each of the last three seasons. In four seasons on the Flats, Johnson has compiled a record of 34-18, including a 21-11 mark in ACC play. No coach in Tech history won more games than Johnson in their first three seasons. Over the last four seasons combined, only Virginia Tech has won more ACC games than Johnson’s Jackets. In 15 seasons overall as a head coach, Johnson owns a career record of 141-57. His career winning percentage (.712) ranks in the top 10 among active BCS head coaches. Johnson enjoyed success as the head coach at Georgia Southern (1997-2001) and Navy (2002-2007) before being named Georgia Tech’s 12th head coach on Dec. 12, 2007. What Johnson has accomplished at Georgia Tech has been remarkable: • In his first two seasons at Tech, Johnson was named the ACC Coach of the Year. He is the first coach to win the award in his first two years in the league. • In 2008, he was named National Coach of the Year by CBS Sports. • In 2009, the Yellow Jackets won the ACC title outright for the first time since 1990, defeating Clemson in the ACC Championship Game. • Tech played in a BCS bowl game for the first time in 2009. • Under Johnson, Tech has averaged nearly nine wins per season. • In each of his three previous seasons, Tech has ranked in the top five nationally in rushing offense. Last season, the Yellow Jackets led the nation in rushing (323.3 ypg).
WINNINGEST ACTIVE FBS COACHES By Percentage, min. of five full years as a head coach Rk. Coach 2011 1. Bob Stoops (Oklahoma) 9-3 2. Gary Patterson (TCU) 10-2 3. Bobby Petrino (Arkansas) 10-2 4. Mark Richt (Georgia) 10-3 5. Brian Kelly (Notre Dame) 8-4 6. Steve Spurrier (S. Carolina) 10-2 7. Paul Johnson (Georgia Tech) 8-4
Record 138-34 108-30 74-26 106-37 187-66-2 196-75-2 141-57
Pct .802 .783 .740 .741 .737 .722 .712
GEORGIA TECH COACHES BY PERCENTAGE Coach John Heisman Bobby Dodd Paul Johnson George O’Leary William Alexander Chan Gailey
Years 1904-19 1945-66 2008-** 1994-01 1920-44 2002-07
W-L-T 102-29-7 165-64-8 34-18-0 52-33-0 134-95-15 44-32-0
Pct. .779 .713 .654 .612 .580 .579
TECH’S ACC COACHES OF THE YEAR 2009 2008 2000 1998 1990 1985
. . . . . . . . . . . . . . . . . . . . . . . . . .Paul Johnson . . . . . . . . . . . . . . . . . . . . . . . . . .Paul Johnson . . . . . . . . . . . . . . . . . . . . . . . . . .George O’Leary . . . . . . . . . . . . . . . . . . . . . . . . . .George O’Leary . . . . . . . . . . . . . . . . . . . . . . . . . . . .Bobby Ross . . . . . . . . . . . . . . . . . . . . . . . . . . . . . .Bill Curry
2011 GEORGIA TECH FOOTBALL
• In 21 of Johnson’s 40 games at Georgia Tech (entering 2011), the Yellow Jackets produced more than 400 yards of total offense. Tech scored at least one rushing touchdown in 35 of 40 games under Johnson through 2010. • Over the previous three seasons, Tech has produced four 1,000-yard rushers -- Jonathan Dwyer in 2008, Dwyer and Joshua Nesbitt in 2009, and Anthony Allen in 2010. • Over the previous three years combined, the Yellow Jackets have produced 12 first team All-ACC selections. • Tech has produced two first team All-Americans under Johnson -Michael Johnson in 2008 and Derrick Morgan in 2009. • Since Johnson’s arrival, a Tech player has been named ACC Offensive Player of the Year (Dwyer in 2008) and ACC Defensive Player of the Year (Morgan in 2009). • Entering 2011, Johnson was 11-2 at Tech in games decided by five points or less, 6-4 at Tech against nationally-ranked opponents, 10-7 in road games, 23-5 when scoring at least 20 points, 16-1 when scoring more than 30 points. • In 2009, Tech won in Tallahassee (Fla.) for the first time in school history, beat a top-five ranked team at home (Virginia Tech) for the first time since 1962 and won on the road in Charlottesville (Va.) for the first time since 1990. • Also in 2009, Tech earned its highest national ranking (7th) since 1999. • In 2008, the Jackets broke a seven-year losing skid to rival Georgia, beating the 13th-ranked Bulldogs, 4542, in Athens (Ga.).
JOHNSON YEAR-BY-YEAR Year 2011 2010
School W-L Georgia Tech . . . . . . . . . . . . . . . . .8-4 Georgia Tech . . . . . . . . . . . . . . . . .6-7 Advocare V100 Independence Bowl 2009 Georgia Tech . . . . . . . . . . . . . . . .11-3 FedEx Orange Bowl (ACC Champions) 2008 Georgia Tech . . . . . . . . . . . . . . . . .9-4 Chick-fil-A Bowl 2007 Navy . . . . . . . . . . . . . . . . . . . . . .8-4 Poinsettia Bowl (did not coach in bowl) 2006 Navy . . . . . . . . . . . . . . . . . . . . . .9-4 Meineke Car Care Bowl 2005 Navy . . . . . . . . . . . . . . . . . . . . . .8-4 Poinsettia Bowl Champions 2004 Navy . . . . . . . . . . . . . . . . . . . . .10-2 Emerald Bowl Champions 2003 Navy . . . . . . . . . . . . . . . . . . . . . .8-5 EV1.net Houston Bowl 2002 Navy . . . . . . . . . . . . . . . . . . . . .2-10 2001 Georgia Southern . . . . . . . . . . . .12-2 Southern Conference Champions 2000 Georgia Southern . . . . . . . . . . . .13-2 Southern Conference Champions I-AA National Champion 1999 Georgia Southern . . . . . . . . . . . .13-2 Southern Conference Champions I-AA National Champion 1998 Georgia Southern . . . . . . . . . . . .14-1 Southern Conference Champions I-AA Runner-Up 1997 Georgia Southern . . . . . . . . . . . .10-3 Southern Conference Champions GSU Totals (5 seasons) . . . . . . . . . . . . . .62-10 Navy Totals (6 seasons) . . . . . . . . . . . . .45-29 Georgia Tech Totals (4 seasons) . . . . . . .34-18 Career (15 seasons) . . . . . . . . . . . . . . .141-57
Pct. .667 .462 .786 .692 .667 .692 .667 .833 .615 .167 .857 .867
.867
.933
.769 .861 .608 .654 .712
• Under Johnson, Georgia Tech’s Academic Progress Report (APR) scores have risen each of the last three years. In 2010, Georgia Tech earned a bowl bid for the 14th consecutive season, tying for the fourth-longest current streak in college football. The Yellow Jackets, who lost four juniors to the 2010 NFL Draft and played the final four games without injured quarterback Joshua Nesbitt, finished 4-4 in the ACC and led the nation in rushing offense for the first time in school history.
JOHNSON’S RECORD WHEN... At Tech overall . . . . . . . . . . . . . . . . . . . . . .34-18 playing at home . . . . . . . . . . . . . . . .20-6 playing on the road . . . . . . . . . . . . .13-9 playing at a neutral site . . . . . . . . . . .1-3 in bowl games . . . . . . . . . . . . . . . . . .0-3 in overtime . . . . . . . . . . . . . . . . . . . .1-0 more than 7 days to prepare . . . . . . .10-6 in August . . . . . . . . . . . . . . . . . . . . .1-0 in September . . . . . . . . . . . . . . . . . .11-4 in October . . . . . . . . . . . . . . . . . . . .14-4 in November . . . . . . . . . . . . . . . . . . .7-7 in December . . . . . . . . . . . . . . . . . . .1-1 in January . . . . . . . . . . . . . . . . . . . . .0-2 outrushing opponent . . . . . . . . . . .34-13 when rushing for 300 yards . . . . . . . .21-4 when rushing for 400 yards . . . . . . . .8-1 when rushing for 500 yards . . . . . . . . .1-0 when rushing for 600 yards . . . . . . . . .1-0 outrushed by opponent . . . . . . . . . . .0-4 when allowing 300 yards rushing . . . . .1-1 rushing yards the same . . . . . . . . . . . .0-1 outpassing opponent . . . . . . . . . . . . .7-2 when passing for 300 yards . . . . . . . .1-0 outpassed by opponent . . . . . . . . . .27-16 when allowing 300 yards passing . . . .4-1 when allowing 400 yards passing . . . .1-0 more total offense than opponent . . .27-6 when having 400+ total offense . . . .23-5 when having 500+ total offense . . . .10-1 when having 600+ total offense . . . . . .2-0 when having 700+ total offense . . . . . .1-0 less total offense than opponent . . . .7-12 when allowing 400+ total offense . . . .5-9 when allowing 500+ total offense . . . .1-2 committing fewer turnovers . . . . . . .16-2 committing more turnovers . . . . . . . .9-10 turnovers are even . . . . . . . . . . . . . . .9-6 0-30:00 of time of possession . . . . .12-13 30:01-plus of time of possession . . . .22-5 scoring first . . . . . . . . . . . . . . . . . . .23-5 opponent scores first . . . . . . . . . . .11-13 leading after the 1st quarter . . . . . . .21-4 trailing after the 1st quarter . . . . . . .6-11 tied after the 1st quarter . . . . . . . . . .7-1 leading at halftime . . . . . . . . . . . . . .26-4 trailing at halftime . . . . . . . . . . . . . .6-14 tied at halftime . . . . . . . . . . . . . . . . .2-0 leading after the 3rd quarter . . . . . . .29-2 trailing after the 3rd quarter . . . . . . .3-16 tied after the 3rd quarter . . . . . . . . . .2-0 scoring 0-10 points . . . . . . . . . . . . . .1-4 scoring 11-20 points . . . . . . . . . . . . .1-7 scoring 21-30 points . . . . . . . . . . . . .9-6 scoring 31-40 points . . . . . . . . . . . . .9-1 scoring 41-plus points . . . . . . . . . . .13-0 opponent scores 0-10 points . . . . . . . .7-0 opponent scores 11-20 points . . . . . .10-2 opponent scores 21-30 points . . . . . .11-9 opponent scores 31-40 points . . . . . . .5-5 opponent scores 41-plus points . . . . . .2-2 individual 100-yard rusher . . . . . . . . .20-7 with two 100-yard rushers . . . . . . . . .7-0 opponent 100-yard rusher . . . . . . . . .11-8 opponent with 2 100-yard rushers . . . .0-1
*Total . . .79-47 . . .40-18 . . .29-20 . . . .10-9 . . . . .2-5 . . . . .3-2 . . .28-14 . . . . .4-0 . . .23-14 . . .23-16 . . .18-13 . . . . .9-3 . . . . .0-2 . . .79-32 . . .55-13 . . . .19-2 . . . . .1-0 . . . . .1-0 . . . .0-14 . . . . .1-2 . . . . .0-1 . . . .12-6 . . . . .1-1 . . .66-41 . . . . .9-6 . . . . .4-2 . . .66-15 . . .52-14 . . . .21-4 . . . . .2-0 . . . . .1-0 . . .13-32 . . .14-30 . . . .5-10 . . . .41-6 . . .21-32 . . . .17-9 . . .41-31 . . .38-16 . . .48-14 . . .29-32 . . .47-11 . . .16-25 . . . .16-9 . . . .57-7 . . .13-35 . . . . .9-5 . . . .68-6 . . . .8-38 . . . . .3-3 . . . .1-11 . . . .2-13 . . .23-18 . . . .30-4 . . . .28-1 . . . .17-0 . . . .24-4 . . .23-17 . . . .7-11 . . . .6-15 . . .54-17 . . . .18-2 . . .22-22 . . . . .0-1
*Total includes Johnson’s six seasons at Navy and first four seasons at Georgia Tech
RAMBLINWRECK.COM
OFFENSE THUMBNAILS QUARTERBACK
13
Tevin Washington (r-Jr./6-0/205)
10
Synjyn Days (r-Fr./6-1/212)
7
David Sims (r-So./6-0/218)
27
Preston Lyons (Sr./6-0/211)
50
Jay Finch (r-So./6-3/283)
76
Nick McRae (r-Jr./6-3/291)
64
Ray Beno (r-So./6-2/290)
His 890 rushing yards and 14 rushing TDs are the 2nd-most ever by a Tech quarterback His pass efficiency (153.5) is the 2nd-highest in Georgia Tech history vs. Clemson he rushed for 176 yards -- the most ever by a Tech QB -- and 1 touchdown Ranks 6th in the ACC in rushing, 5th in scoring, 9th in total offense
Pronounced: Sin-jin Came off the bench in the season finale vs. Georgia: 6 carries for 17 yards; 3-of-5 passing for 78 yards A solid back-up who has seen more than just mop-up duty Averages 4.9 yards per carry and has rushed for 4 TDs
A-BACK
17
Orwin Smith (Jr./6-0/202)
24
Embry Peeples (Sr./5-10/185)
B-BACK Ranks 2nd on the team in rushing (58.2) Rushed 13 times for 36 yards and a TD in the regular season finale vs. Georgia Has rushed for at least 70 yards five times Has 4 carries for longer than 20 yards Played quarterback as a freshman and made the move to B-back in the spring; would be Tech’s “emergency” quarterback
A good blocker and a hard-nosed runner who takes care of the ball Had one carry in the Nov. 26 game vs. UGA Averaging 5.2 yards per carry and has no rushing attempts for negative yardage Rushed for a TD in the season opener Transferred to Georgia Tech from Colgate
Generally plays a series or two every game Made his 2nd career start -- his 1st at center -- vs. Clemson when Finch was injured Gives Tech some veteran depth on the O-line -- in his fourth season with the offense Can play guard or center Was heavily recruited out of Dublin (Ga.) High School
5
57
Catlin Alford (r-Fr./6-3/295) A promising young player who has emerged as a solid back-up Has played in five games this season Was a standout tight end and nose guard in high school Enjoys hunting and fishing
2011 GEORGIA TECH FOOTBALL
Stephen Hill (Jr./6-5/206) Averaging 30.2 yards per reception, which ranks 1st nationally Had 3 receptions for 78 yards Nov. 26 vs. UGA Has 9 receptions of 40 yards or longer Has 3 100-yard receiving games in 2011 Has 1,213 career receiving yards Had a HS long jump of 25 feet, 8 3/4 inches
80
Daniel McKayhan (r-Jr./6-0/198)
52
Will Jackson (r-So./6-3/285)
9
Tony Zenon (r-Fr./5-8/182)
84
Tyler Melton (Sr./6-0/206)
70
Shaquille Mason (Fr./6-1/295)
61
Phil Smith (r-Jr./6-5/292)
Has slowly climbed his way up the depth chart in his four years in the program Still looking for his first reception of 2011 Was recruited to play at Navy when Paul Johnson was head coach of the Midshipmen An outstanding painter Born in the SID’s hometown of Southern Pines, NC
81
Jeff Greene (Fr./6-4/200)
77
Omoregie Uzzi (r-Jr./6-3/300)
Has started every game in 2011 and owns 21 career starts Was a first team Freshmen All-American last season (FWAA, Phil Steele) Named to the 2010 ACC All-Academic Team Was born -- of all places -- in Athens, Ga. Grew up in Knoxville, Tenn., not far from the University of Tennessee campus
The impressive true freshman has played in nine games Was arguably Tech’s top performer on the Oline vs. Clemson Has a very bright future on the O-line Full name is Shaquille Olajuwon Mason (not kidding)
71
J.C. Lanier (r-So./6-4/298)
86
Justin Moore (So./5-10/171)
82
Sean Poole (r-So./6-1/161)
69
55
Sean Tobin (Fr./6-3/220)
Has 34 career starts Had 7 receptions for 122 yards in a 3-game November stretch before being shutout vs. UGA Has 14 receptions for an average of 17.4 yards per catch Has really excelled as a blocker on the perimeter Hobby is restoring old cars
A talented true freshman with a great deal of potential Has size and athleticism to be a future star Looking for first career reception High school teammate of fellow Tech freshman Zach Laskey Has eight siblings: Qulyana, Jasmine, Jeffery, Jada, Kobe, Jalen, Brandon and Justin
Pronounced: a-more-gay ooze-E A 1st team All-ACC selection Two-time ACC Offensive Lineman of the Week Was on the Outland Trophy watch list The leader of the O-line in terms of experience (25 career starts) Was named 2nd team All-ACC in 2010
Came to Georgia Tech as a defensive lineman and didn’t move to the offensive line until the spring Began this season on the injury list, allowing a stress fracture to heal Saw first action of the season at NC State Full name is Jerry Carnell Lanier
KICKER Averaging 6.7 points per game Has made his last 5 field goal attempts Is 53-of-53 on PATs this season
HOLDER
Tyler Kidney (r-So./6-2/262) Has started five of 12 games and has played in 11 games in 2011 Came to Tech as a walk-on, but was awarded a scholarship in the summer by Paul Johnson Was born in Oak Harbor (Wash.), and has lived in Shaker Heights (Ohio), Memphis and Dallas.
Pronounced: Zen-In Has 3 carries for 30 yards, 3 receptions for 104 yards and a TD If Embry Peeples is the fastest player on the roster, Zenon is the quickest Had a 73-yard TD reception on Tech’s first offensive play at MTSU
RIGHT GUARD
RIGHT TACKLE One of Tech’s most experienced offensive linemen: 33 games played, 20 starts Was a solid contributor on Tech’s 2009 ACC title team, and actually suffered a season-ending injury in the ACC championship game Was suspended for the first 2 games of 2011 Father, Mark, played football at Nicholls State Phil is a huge fan of all Tampa pro sports
Has started more games (51) than any player in Georgia Tech history; 38 consecutive starts One of three team captains Graduated in ‘10 and is now pursuing an MBA Ranks 13th in Tech history with 1,826 career rushing yards Brother, Darius, plays at Air Force Drafted by the White Sox out of high school
WIDE RECEIVER
LEFT GUARD
LEFT TACKLE Has played in all 12 games with 11 starts Played a few snaps at center Oct. 22 at Miami Has played every position on the offensive line since his arrival at Tech Was born in Jacksonville and later lived in Norfolk and Tampa Can play the guitar
Enters the bowl game 24 yards shy of 1,000 career rushing yards Averages 11.1 yards per carry, 17.0 yards per reception, 18.2 yards per kick return Arguably the fastest player on the roster. Equally skilled at rushing and receiving, ideal for the hybrid position of A-back Rushed for 110 yards and a TD vs. Kansas
20
WIDE RECEIVER
CENTER Has emerged as a leader on the O-line Was injured on Tech’s 1st offensive play at Miami (Oct. 22) and missed the Clemson game Replaced now-graduated Sean Bedford, who was a two-time first team All-ACC selection The primary instigator of the “Goon Squad” -the nickname of Tech’s offensive line His father, John, attended Georgia Tech
Averaging 10.3 yards per carry Has 11 rushing TDs on 60 carries His 12 TDs overall rank tied for 2nd in ACC Has more than 1,100 career rushing yards, 1,300 kick return yards, 3,000 all-purpose yards Has produced 12 plays of 20-plus yards in 2011 Referred to as the “Big O”
A-BACK Roddy Jones (r-Sr./5-9/202)
Escaped Tallahassee (Fla.) to come to Tech Played on the GT baseball team in 2010
SNAPPER Replaced injured Tyler Morgan Oct. 1 Team special teams player of the week for the NC State game
RAMBLINWRECK.COM
DEFENSE THUMBNAILS END
92
Jason Peters (r-Sr./6-4/270)
93
Emmanuel Dieke (r-So./6-6/264)
Lindy’s named his preseason second team All-ACC Had 4 tackles vs. UGA in his final home game Has 29 career starts (25 consecutive) and has played in 48 career games Has 50 tackles, 2.5 sacks, 1 FR, 2 PBU Extremely active in the Tech and Atlanta community
Pronounced: D-ay-K Has emerged as a dependable back-up Had 2 tackles in the regular season finale Has 18 tackles (11 solos) and 2.0 sacks Nickname is “Too Tall” Of Nigerian descent Began playing football at age 15
TACKLE
96
Logan Walls (r-Sr./6-2/299)
90
T.J. Barnes (r-Jr./6-7/347)
OUTSIDE LINEBACKER
45
Jeremiah Attaochu (So./6-3/235)
42
Malcolm Munroe (r-Jr./6-3/225)
Pronounced: ah-Towl-choo Named honorable mention All-ACC Had a sack and 3 tackles Nov. 26 vs. Georgia Recorded a career-high 10 tackles and added 2.5 TFLs and a sack Nov. 10 vs. VT Ranks 4th in the ACC in sacks (6.0) Had 1st career interception at Miami FWAA National Player of the Week Sept. 27
Made his 1st career start vs. Maryland Has played in 28 career games Has 8 tackles (all solos) and a sack in 2011 Given name is Malcolm Shakajamal Munroe Brother, Dorian, played safety at Florida Father, Norman, captained his collegiate cricket team in England
54
30
Daniel Drummond (r-So./6-3/248)
Made 7th career start Nov. 19 at Duke; had 7 tackles, 1.0 TFL, 1 QBH Has 47 tackles, 3.0 TFLs, 1 INT, 2 PBU, 1 FR Led team in tackles (10), had a half-tackle for loss; nominated for ACC Rookie of the Week Oct. 15 at UVA Recorded his 1st career interception vs. Maryland
Made his 5th career start Nov. 26 vs. Georgia; had 5 tackles against the Bulldogs Missed 2 games with an injury Has 32 tackles, 1 pass break-up, 1 forced fumble, 1 blocked kick Had a career-high 8 tackles at NC State Moved from B-back to LB in the spring High school teammate of Izaan Cross
34
Steven Sylvester (Sr./6-2/240)
11
Brandon Watts (r-So./6-2/234)
1
16
Tied for 7th in the ACC for interceptions (3) Ranks 2nd on the team in tackles with 69 (44 solo); has 3 INTs, 3 PBU, 2 fumble recoveries Had 8 tackles in the regular season finale Team defensive player of the game for the Middle Tennessee State game Played last season as a true freshman From same high school as Calvin Johnson
Corey Dennis (Fr./6-2/206) The true freshman has played mostly on special teams to this point Has played in all 12 games, has 7 tackles, 5 solo tackles A fundamentally sound player who began the fall at wide receiver Father, Steve, is the athletic director at Troy University
2011 GEORGIA TECH FOOTBALL
99
Euclid Cummings (r-So./6-4/270)
One of three team captains Had 7 tackles, 1 TFL Nov. 10 vs. Va Tech Has made 31 career starts Team defensive player of the game for the Kansas game Has 38 tackles, 4.0 tackles for loss, 1.0 sack, 1 forced fumble and 1 pass break-up Childhood friend of the Braves’ Jason Heyward
Named team defensive MVP for his effort in the Duke game Nov. 19 Has played in 22 career games with 4 starts Has 15 tackles, 3.0 TFLs, 3.0 sacks, 1 PBU and 1 forced fumble Made 1st start of the season, 4th career start at UVA Missed the Maryland game with an injury
6
Rod Sweeting (Jr./6-0/184)
36
Jamal Golden (Fr./6-0/185)
28
Rashaad Reid (Sr./5-10/191)
Named honorable mention All-ACC Had 5 tackles, forced a fumble and broke up a pass in the regular season finale vs. UGA Named the ACC D-Back of the Week Oct. 17 Had a 32-yard INT return for a TD at UVA -his 1st career pick-six Ranks 3rd on the team in tackles (55), has 36 solo tackles, 3.0 TFLS, 3 INTs, 9 PBUs
A talented and athletic true freshman with a bright future Has played in 10 games with 7 tackles (5 solo tackles) and 1 pass break-up Active on special teams
14
Julian Burnett (Jr./5-10/220)
58
B.J. Machen (r-Jr./6-1/232)
Ranks 5th in ACC, 32nd nationally in tackles (113); has 44 more tackles than any GT player Named 2nd team All-ACC Had a team-high 13 tackles, 1.5 TFLs and a forced fumble Nov. 10 vs. Virginia Tech Will lead Tech in tackles for the second straight year One of three team captains
Pronounced: May-chin A much-improved player who did not see game action in 2010 Recorded 1st career interception in the season opener vs. Western Carolina Had a career-high 5 tackles at NC State Given name is Bijan Christian-Joseph Father, Ron, played football at Stanford
RIGHT CORNERBACK
8
Louis Young (So./6-1/201) Recorded 1st career interception Nov. 26 vs. Georgia Had a career-high 7 tackles and a QB hurry the previous week at Duke Ranks tied for 4th on the team in tackles (52), 3.0 tackles for loss, 5 PBUs, 1 INT and 1 forced fumble Was a late commitment to the 2010 class
35
Michael Peterson (r-Sr./5-11/190)
82
Sean Poole (r-So./6-1/161)
14
Jemea Thomas (r-So./5-10/190)
24
Embry Peeples (Sr./5-10/185)
A valuable reserve, nickel back and special teams player The only senior in the secondary Has played in 49 career games Has 8 tackles and a half-tackle for loss in ‘11 A remarkable painter One of several former and current Tech players to come from Tampa’s Jesuit High School
PUNTER Averaging 38.7, 5 inside the 20, long of 55 Ranks 8th in the ACC in punting Father, Van, was a Florida state senator
PUNT RETURNER
Jemea Thomas (r-So./5-10/190) Technically, not a starter but may be one of the top DBs in the ACC His 4th-quarter INT Nov. 19 vs. Duke sealed Tech’s win; 3 INTs over last 4 games Named the ACC Defensive Back of the Week (Oct. 31) following the Clemson game: 1st career start, 2 INTs, 1 TFL, forced fumble, 2 PBU and 1st career punt return
1 of the most improved players on the team Has remarkable speed for a player his size Had 3 tackles, a half-tackle for loss in the regular season finale vs. Georgia Had a big game at Miami Oct. 22: 4 solo tackles and a tackle for loss Has 21 tackles, 2.0 tackles for loss and a pass break-up
40
RIGHT SAFETY Will play in his 53rd career game in the bowl game, tying the Tech record for career games played; has 26 career starts A versatile player who has played every position in the secondary during his career Had 6 tackles and a PBU Nov. 26 vs. Georgia Has 50 tackles, 1.5 TFL, 2 PBU and 1 forced fumble in 2011
Pronounced: I-zjahn Was on the Ted Hendricks Award watch list Had a pair of tackles Nov. 26 vs. Georgia Has 27 career starts including 25 consecutive Has 30 tackles, 1.0 TFLs, 4 PBU, 1 forced fumble Flowery Branch High School teammate was Daniel Drummond, Tech’s inside linebacker
INSIDE LINEBACKER
LEFT CORNERBACK
LEFT SAFETY Isaiah Johnson (So./6-2/205)
The largest human on the Tech roster Has played in 39 career games Had a big game vs. Clemson: 1.5 TFLs, 1.0 sacks, 2 tackles; big lift to Tech’s pass rush Has 11 tackles, 1.5 TFLs, 1.0 sacks T.J. is short for Tarence Jariviz Father, Terry Jones, played football at Auburn Brother, Beau Reliford, plays at Florida State
94
OUTSIDE LINEBACKER
INSIDE LINEBACKER Quayshawn Nealy (r-Fr./6-1/223)
Has 35 career starts under his belt Has 37 tackles, 2.0 TFLs on the season Had 3 tackles, 1 TFL Nov. 19 at Duke Was the team defensive player of the week following the season opener Overcame heart surgery in 2008 Brothers Lance, Levi also played at Tech
END Izaan Cross (Jr./6-4/292)
Made 1st career punt return vs. Clemson on Oct. 29 Last return was for 14 yards at Duke Nov. 19
KICK RETURNER Averaging 18.2 yards on 6 returns His last return was for 29 yards vs. Georgia
RAMBLINWRECK.COM
RECORD BOOK UPDATE INDIVIDUAL/CAREER RUSHING YARDS 1. Robert Lavette 2. Jerry Mays 3. Eddie Lee Ivery 4. Tashard Choice 5. P.J. Daniels 6. Jonathan Dwyer 7. Joshua Nesbitt 8. Joe Burns 9. C.J. Williams 10. David Sims 11. William Bell 12. Anthony Allen 13. Roddy Jones 14. Leon Hardeman 15. Ronny Cone 16. Joe Hamilton 17. Lenny Snow 18. Bill Teas 19. Jimy Lincoln 20. Cory Collier 21. Malcolm King 22. Bobby North 23. Reggie Ball 24. Brent Cunningham 25. Tevin Washington 26. Charles Wiley 27. Greg Horne 28. Glenn Turner 29. Sean Gregory 30. Charlie Rogers 31. Phillip Rogers 32. Rodney Lee 33. Adrian Rucker Bucky Shamburger 35. Orwin Smith 36. Michael Smith 37. Dorsey Levens 38. Pat Moriarty nr. Embry Peeples
Years 1981-84 1985-89 1975-78 2005-07 2002-05 2007-09 2007-10 1998-01 1994-96 1974-76 1989-93 2009-10 20081951-53 1979-83 1996-99 1965-67 1951-54 1991-94 1983-86 1984-87 1947-50 2003-06 1969-71 20091995-98 1971-73 1951-53 1998-01 1995-98 1995-99 1977-79 1974-77 1975-78 20091991-94 1992-93 1973-77 2008-
Yards 4,066 3,699 3,517 3,365 3,346 3,226 2,806 2,634 2,365 2,274 2,026 1,934 1,826 1,794 1,777 1,758 1,743 1,689 1,601 1,590 1,576 1,505 1,451 1,446 1,444 1,431 1,425 1,329 1,290 1,287 1,264 1,250 1,162 1,162 1,158 1,083 1,036 1,007 976
RUSHING TOUCHDOWNS 1. Robert Lavette 2. Joshua Nesbitt Jonathan Dwyer 4. Joe Burns 5. Tashard Choice 6. P.J Daniels 7. Eddie Lee Ivery Leon Hardeman 9. David Sims 10. C.J. Williams 11. Shawn Jones Charles Wiley 13. Tevin Washington Joe Hamilton Jerry Mays Lenny Snow 17. Malcolm King 18. Sean Gregory nr. Orwin Smith Roddy Jones
Years 1981-84 1981-84 2007-09 1998-01 2005-07 2002-05 1975-78 1951-53 1974-76 1994-96 1989-92 1995-98 20091996-99 1985-89 1965-67 1984-87 1998-01 20092008-
TDs 45 35 35 31 28 23 22 22 21 20 19 19 18 18 18 18 17 16 15 14
RUSHING YARDS BY A QUARTERBACK 1. Joshua Nesbitt 2007-10 2,806 2. Joe Hamilton 1996-99 1,758 3. Reggie Ball 2003-06 1,451 4. Tevin Washington 20091,444 5. Danny Myers 1973-75 921 6. Shawn Jones 1989-92 855 7. Donnie Davis 1992-95 749 8. Billy Lothridge 1961-63 746 9. John Dewberry 1983-85 630 10. Kim King 1964-66 506 RUSHING TDs BY A QUARTERBACK 1. Joshua Nesbitt 2007-10 2. Shawn Jones 1989-92 3. Tevin Washington 2009Joe Hamilton 1996-99 5. Billy Lothridge 1961-63 6. Danny Myers 1973-75 7. Toppy Vann 1956-57 Reggie Ball 2003-06 9. John Dewberry 1983-85 10. Gary Lanier 1976-79 PASSING YARDS 1. Joe Hamilton 2. Shawn Jones 3. Reggie Ball 4. George Godsey 5. Mike Kelley 6. John Dewberry 7. Eddie McAshan
Years 1996-99 1989-92 2003-06 1998-01 1978-81 1983-85 1970-72
TD 35 19 18 18 15 14 11 11 9 8 Yards 8,882 8,441 8,128 6,137 5,249 4,193 4,080
2011 GEORGIA TECH FOOTBALL
8. 9. 10. 11. 12. 13. 14. 15. 16. 17. 18. 19. 20.
Joshua Nesbitt Donnie Davis Taylor Bennett Kim King A.J. Suggs Billy Lothridge Rick Strom Jim Bob Taylor Tommy Luginbill Larry Good Jimmy Southard Darrell Crawford Tevin Washington
2007-10 1992-95 2005-07 1965-67 2002-03 1961-63 1983-87 1981-82 1994 1966-68 1946-49 1949-51 2009-
3,276 3,261 2,804 2,763 2,422 2,394 2,199 2,136 2,128 2,052 1,994 1,967 1,953
TOUCHDOWN PASSES 1. Joe Hamilton 2. Reggie Ball 3. Shawn Jones 4. George Godsey 5. Eddie McAshan 6. John Dewberry 7. Mike Kelley 8. Donnie Davis 9. Frank Broyles 10. Joshua Nesbitt 11. Billy Lothridge 12. Darrell Crawford 13. Bill Brigman 14. Tommy Luginbill Kim King A.J. Suggs nr. Tevin Washington
Years 1996-99 2003-06 1989-92 1998-01 1970-72 1983-85 1978-81 1992-95 1943-46 2007-10 1961-63 1949-51 1952-54 1994 1965-67 2002-03 2009-
TD 65 57 51 41 32 27 23 22 21 20 18 17 16 14 14 14 12
PASS EFFICIENCY Minimum 100 attempts 1. Joe Hamilton 2. George Godsey 3. Tevin Washington 4. Toppy Vann 5. Jimmy Southard 6. Shawn Jones 7. John Dewberry 8. Donnie Davis 9. Joshua Nesbitt 10. Pepper Rodgers
Years 1996-99 1998-01 20091953-56 1947-49 1989-92 1983-85 1992-95 2007-10 1951-53
148.2 143.6 137.4 134.6 129.2 125.6 125.5 121.4 119.7 118.6
RECEIVING YARDS 1. Calvin Johnson 2. Kelly Campbell 3. Kerry Watkins 4. Demaryius Thomas 5. Harvey Middleton 6. Jonathan Smith 7. Dez White 8. John Sias 9. Bobby Rodriguez 10. Derrick Steagall 11. Jimmy Robinson Greg Lester 13. Will Glover 14. Gary Lee 15. Ken Whisenhunt 16. James Johnson 17. Stephen Hill 18. Nate Curry
Years 2004-06 1998-01 1999-02 2007-09 1994-96 2000-03 1997-99 1966-68 1989-92 1993-97 1972-74 1987-91 1999-02 1983-86 1980-84 2005-07 20092000-04
Yards 2,927 2,907 2,680 2,339 2,291 2,238 1,833 1,727 1,681 1,639 1,633 1,633 1,316 1,299 1,264 1,240 1,213 1,185
YARDS PER RECEPTION Years Minimum 50 Receptions 1. #Stephen Hill 20092. Dez White 1997-99 3. Demaryius Thomas 2007-09 4. Gary Lee 1983-86 5. Drew Hill 1975-78 6. Jason McGill 1990-92 7. Greg Lester 1987-91 8. Derrick Steagall 1993-97 9. Calvin Johnson 2004-06 10. Marlon Heggs 1979-80 # Hill has 47 career receptions
Avg
Rtg
25.8 20.4 19.5 19.4 19.3 19.2 17.6 16.6 16.4 16.3
RECEIVING TOUCHDOWNS 1. Calvin Johnson 2004-06 2. Kelly Campbell 1998-01 3. Kerry Watkins 1999-02 4. Demaryius Thomas 2007-09 5. Dez White 1997-99 Buck Martin 1950-52 Gary Lee 1983-86 8. Harvey Middleton 1994-97 Jimmy Robinson 1972-74 Greg Lester 1987-91 11. Jonathan Smith 2000-03 12. Jerry Mays 1985-89 John Sias 1966-68 nr. Stephen Hill 2009-
TD 28 24 22 15 14 14 14 13 13 13 12 10 10 8
100-YARD RECEIVING GAMES 1. Calvin Johnson 2004-06
No. 13
2.
1994-97 1998-00 1997-99 2000-03 1966-69 2007-09 1999-02 1993-97 1972-74 2009-
10 10 8 7 7 6 5 4 4 3
TOTAL OFFENSE 1. Joe Hamilton, QB 2. Reggie Ball, QB 3. Shawn Jones, QB 4. George Godsey, QB 5. Joshua Nesbitt, QB 6. Mike Kelley, QB 7. John Dewberry, QB 8. Eddie McAshan, QB 9. Robert Lavette, RB 10. Donnie Davis, QB 11. Jerry Mays, RB 12. Eddie Lee Ivery, RB 13. Tevin Washington 14. Tashard Choice, RB 15. P.J. Daniels, RB 16. Kim King, QB 17. Jonathan Dwyer, RB 18. Billy Lothridge, QB 19. Taylor Bennett, QB 20. Larry Good, QB
Years 1996-99 2003-06 1989-92 1998-01 2007-10 1978-81 1983-85 1970-72 1981-84 1992-95 1985-89 1975-78 20092005-07 2002-05 1965-67 2007-09 1961-63 2005-07 1966-68
Yards 10,640 9,579 9,296 6,125 6,082 5,198 4,823 4,262 4,093 4,010 3,757 3,570 3,397 3,382 3,359 3,269 3,226 3,140 2,777 2,675
ALL-PURPOSE YARDS 1. Robert Lavette 2. Jerry Mays 3. Kelly Campbell 4. Eddie Lee Ivery 5. Jonathan Dwyer 6. P.J. Daniels 7. Drew Hill 8. Charlie Rogers 9. Tashard Choice 10. Dez White 11. Joe Burns 12. Kerry Watkins 13. Orwin Smith 14. Calvin Johnson 15. Jonathan Smith 16. Harvey Middleton 17. C.J. Williams 18. Joshua Nesbitt 19. Billy Teas 20. Cory Collier
Years 1981-84 1985-89 1998-01 1975-78 2007-09 2002-05 1975-78 1995-98 2005-07 1997-99 1998-01 1999-02 20092004-06 2000-03 1994-97 1994-96 2007-10 1951-54 1983-86
Yards 5,393 4,743 4,472 4,324 3,966 3,949 3,815 3,693 3,646 3,601 3,509 3,343 3,042 2,967 2,931 2,879 2,860 2,806 2,640 2,514
SCORING 1. Luke Manget, K 2. Travis Bell, K 3. Scott Sisson, K 4. Robert Lavette, RB 5. Scott Blair, K 6. Jonathan Dwyer, RB 7. Joshua Nesbitt, QB 8. Joe Burns, RB 9. Billy Lothridge, QB-K 10. Calvin Johnson, WR 11. David Bell, K 12. Tashard Choice, RB Jerry Mays, RB 14. Kelly Campbell, WR 15. Johnny Smith, K 16. Eddie Lee Ivery, RB Brad Chambers, K 18. P.J. Daniels, RB 19. Ron Rice, K 20. C.J. Williams, RB 21. Thomas Palmer, K Kerry Watkins, WR 23. Leon Hardeman, RB 24. Pepper Rodgers, QB-K nr. Roddy Jones, RB Tevin Washington
Years 1999-02 2004-07 1989-92 1981-84 2007-10 2007-09 2007-10 1998-01 1961-63 2004-06 1983-86 2005-07 1985-89 1998-01 1977-80 1975-78 1995-98 2002-04 1980-83 1994-96 1985-88 1999-02 1951-53 1951-53 20082009-
Pts 322 321 299 276 239 218 212 206 204 174 172 168 168 162 159 158 158 156 150 144 138 138 132 128 114 108
TOUCHDOWNS 1. Robert Lavette 2. Jonathan Dwyer 3. Joshua Nesbitt 4. Joe Burns 5. Calvin Johnson 6. Tashard Choice Jerry Mays 8. Kelly Campbell 9. Eddie Lee Ivery P.J. Daniels 11. C.J. Williams 12. Leon Hardeman Kerry Watkins 14. David Sims
Years 1981-84 2007-09 2007-10 1998-01 2004-06 2005-07 1985-89 1998-01 1975-78 2002-05 1994-96 1951-53 1999-00 1974-76
TD 46 36 35 34 29 28 28 27 26 26 24 22 22 21
4. 5. 7. 8. 9. 11.
Harvey Middleton Kelly Campbell Dez White Jonathan Smith John Sias Demaryius Thomas Kerry Watkins Derrick Steagall Jimmy Robinson Stephen Hill
15.
20081995-98 1989-92 1965-67 20091996-99 1984-87
19 19 19 19 18 18 18
TOUCHDOWNS RESPONSIBLE FOR 1. Joe Hamilton 1996-99 2. Shawn Jones 1989-92 3. Reggie Ball 2003-06 4. Joshua Nesbitt 2007-10 5. George Godsey 1998-01 6. Robert Lavette 1981-84 7. Jonathan Dwyer 2007-09 8. John Dewberry 1983-85 9. Eddie McAshan 1970-72 10. Billy Lothridge 1961-63 11. Joe Burnes 1998-01 12. Tevin Washington 2009Darrell Crawford 1949-51
TD 83 70 68 55 47 46 37 36 35 33 31 30 30
19.
Roddy Jones Charles Wiley Shawn Jones Lenny Snow Tevin Washington Joe Hamilton Malcolm King
KICK RETURN AVERAGE Minimum of 25 returns 1. Drew Hill 2. Dez White 3. Derrick Steagall 4. Kelly Campbell 5. T.J. Edwards 6. Randy Rhino 7. Cory Collier 8. Kevin Tisdel 9. Ken Swilling 10. Levon Thomas 11. Orwin Smith 12. Lethon Flowers Charlie Rogers
Years
Avg
1975-78 1997-99 1993-97 1998-01 1988-90 1972-74 1983-86 1989-92 1988-91 2001-04 20091991-94 1995-98
25.4 24.7 24.5 24.0 23.7 23.5 23.2 22.4 22.3 22.1 21.9 21.8 21.8
KICKOFF RETURNS 1. Drew Hill 2. Dez White 3. Kevin Tisdel 4. Orwin Smith 5. Kelly Campbell 6. Charlie Rogers 7. Jamaal Evans 8. Lethon Flowers 9. Gary Lee 10. Randy Rhino
Years 1975-78 1997-99 1989-92 20091998-01 1995-98 2006-07 1991-94 1983-86 1972-74
No. 94 69 68 62 59 56 45 43 42 37
KICKOFF RETURN YARDS 1. Drew Hill 2. Dez White 3. Kevin Tisdel 4. Kelly Campbell 5. Orwin Smith 6. Charlie Rogers 7. Jamaal Evans 8. Lethon Flowers 9. Gary Lee 10. Randy Rhino
Years 1975-78 1997-99 1989-92 1998-01 20091995-98 2006-07 1991-94 1983-86 1972-74
Yards 2,357 1,701 1,526 1,415 1,357 1,264 975 938 874 870
POINTS-BY-KICKING 1. Luke Manget 2. Travis Bell 3. Scott Sisson 4. Scott Blair 5. David Bell 6. Johnny Smith 7. Brad Chambers 8. Ron Rice 9. Thomas Palmer 10. Dave Frakes 11. Billy Lothridge 12. Bunky Henry 13. Cam Bonifay 14. Danny Smith Pepper Rodgers 16. Dan Burnett 17. Justin Moore 18. Tommy Wells 19. Bobby Thigpen
Years 1999-02 2004-07 1989-92 2007-10 1983-86 1977-80 1995-98 1980-83 1985-88 1994-97 1961-63 1964-66 1971-73 1974-76 1951-53 2000-03 20101958-60 1970-72
Pts 322 321 299 239 172 159 158 150 138 127 114 103 93 92 92 87 80 74 65
PATs 1. 2. 3. 4. 5. 6. 7. 8. 9. 10. 11.
Years 1999-00 2004-07 1989-92 2007-10 1995-98 1983-86 1977-80 1964-66 1951-53 1980-83 1974-76 1970-72 2010-
PATs 160 138 119 116 77 76 75 73 68 63 56 56 53
nr.
Luke Manget Travis Bell Scott Sisson Scott Blair Brad Chambers David Bell Johnny Smith Bunky Henry Pepper Rodgers Ron Rice Danny Smith Bobby Thigpen Justin Moore
RAMBLINWRECK.COM
RECORD BOOK UPDATE nr.
INDIVIDUAL/SEASON RUSHING YARDS 1. Eddie Lee Ivery 2. Tashard Choice 3. P.J. Daniels 4. Jonathan Dwyer Jonathan Dwyer 6. Tashard Choice 7. Jerry Mays 8. Anthony Allen 9. Robert Lavette 10. Robert Lavette 11. Joe Burns 12. C.J. Williams 13. Joshua Nesbitt 14. Jerry Mays 15. P.J. Daniels 16. Jimy Lincoln 17. Joe Burns 18. Eddie Lee Ivery 19. William Bell 20. Tevin Washington 21. David Sims 22. Robert Lavette 23. Jerry Mays 24. Sean Gregory 25. Dorsey Levens nr. David Sims
Year 1978 2006 2003 2009 2008 2007 1989 2010 1982 1984 2001 1995 1,037 1988 2005 1991 2000 1977 1990 2011 1974 1981 1986 1999 1993 2011
Yards 1,562 1,473 1,447 1,395 1,395 1,379 1,349 1,316 1,208 1,189 1,165 1,138 2009 942 930 913 908 900 891 890 881 866 842 837 823 698
RUSHING ATTEMPTS 1. Tashard Choice 2. P.J. Daniels 3. Joe Burns 4. Robert Lavette 5. Joshua Nesbitt 6. Eddie Lee Ivery 7. Tashard Choice 8. Robert Lavette 9. Jerry Mays 10. C.J. Williams 11. Anthony Allen 12. Jonathan Dwyer 13. Tevin Washington 14. Joe Burns 15. Lenny Snow
Year 2006 2003 2001 1982 2009 1978 2007 1984 1989 1995 2010 2009 2011 2000 1966
Atts 297 283 282 280 279 267 261 260 249 245 240 235 222 220 202
RUSHING TOUCHDOWNS 1. Robert Lavette 2. Joshua Nesbitt 3. Tevin Washington Jonathan Dwyer Robert Lavette Joe Burns 7. Sean Gregory 8. Jonathan Dwyer Tashard Choice Joe Burns C.J. Williams Lenny Snow 13. Orwin Smith Tony Hollings 15. Joshua Nesbitt P.J. Daniels Tashard Choice
Year 1982 2009 2011 2009 1984 2001 1999 2008 2006 2000 1995 1966 2011 2002 2010 2003 2007
TD 19 18 14 14 14 14 13 12 12 12 12 12 11 11 10 10 10
RUSHING YARDS BY A QUARTERBACK Yds 1. Joshua Nesbitt 2009 1,037 2. Tevin Washington 2011 890 3. Joshua Nesbitt 2010 737 4. Joe Hamilton 1999 734 5. Joshua Nesbitt 2008 693 6. Tevin Washington 2010 514 7. Danny Myers 1974 489 8. Joe Hamilton 1997 478 Billy Lothridge 1962 478 10. Danny Myers 1975 432 11. Gary Hardie 1977 429 12. Donnie Davis 1995 390 13. Reggie Ball 2003 384 14. Reggie Ball 2005 381 15. Shawn Jones 1991 361 nr. Synjyn Days 2011 237 RUSHING TDs BY A QUARTERBACK 1. Joshua Nesbitt 2009 2. Tevin Washington 2011 3. Joshua Nesbitt 2010 4. Billy Lothridge 1962 5. Joshua Nesbitt 2008 Shawn Jones 1991 Danny Myers 1974 Danny Myers 1975 9. Shawn Jones 1990 Joe Hamilton 1999
TD 18 14 10 9 7 7 7 7 6 6
2011 GEORGIA TECH FOOTBALL
Synjyn Days
2011
4
TOUCHDOWN PASSES 1. Joe Hamilton 2. George Godsey 3. Reggie Ball 4. George Godsey 5. Joe Hamilton 6. Eddie McAshan Reggie Ball 8. Shawn Jones Frank Broyles 10. Tommy Luginbill 11. Shawn Jones 12. Joe Hamilton Donnie Davis Shawn Jones Darrell Crawford A.J. Suggs nr. Tevin Washington
Year 1999 2000 2006 2001 1998 1972 2004 1992 1944 1994 1990 1997 1993 1989 1951 2002 2011
TD 29 23 20 18 17 16 16 15 15 14 13 12 12 12 12 12 10
PASS EFFICIENCY Minimum 50 attempts 1. Joe Hamilton 2. Tevin Washington 3. George Godsey 4. Joshua Nesbitt 5. Joe Hamilton 6. John Dewberry 7. Jimmy Southard 8. George Godsey 9. Joe Hamilton 10. Pepper Rodgers
Year
Rtg
1999 2011 2000 2009 1997 1984 1948 2001 1998 1953
175.0 153.5 151.9 148.7 146.6 144.4 143.0 142.1 141.7 141.3
RECEIVING YARDS 1. Calvin Johnson 2. Demaryius Thomas 3. Jonathan Smith 4. Kelly Campbell 5. Kerry Watkins 6. Dez White 7. Kelly Campbell 8. John Sias 9. Calvin Johnson 10. Dez White 11. Harvey Middleton 12. Calvin Johnson 13. Jimmy Robinson 14. Harvey Middleton 15. Stephen Hill 16. Drew Hill Kelly Campbell
Year 2006 2009 2003 1999 2002 1998 2000 1968 2005 1999 1997 2004 1972 1996 2011 1978 2001
Yds 1,202 1,154 1,138 1,105 1,050 973 963 902 888 860 839 837 812 804 785 708 708
YARDS PER RECEPTION Minimum 25 Receptions 1. # Stephen Hill 2. Demaryius Thomas 3. Gary Lee 4. Dez White 5. Kris Kentera 6. Drew Hill 7. Dez White Derrick Steagall 9. Greg Lester 10. Jason McGill Ken Whisenhunt 12. Kerry Watkins
Year
Avg
2011 2009 1985 1998 1979 1978 1999 1997 1991 1992 1984 2000
30.2 25.1 22.2 21.2 21.0 19.6 19.5 19.5 19.3 19.1 19.1 18.5
RECEIVING TOUCHDOWNS 1. Calvin Johnson 2. Kelly Campbell Kelly Campbell 4. Dez White Jimmy Robinson 6. Demaryius Thomas Buck Martin 8. Harvey Middleton Craig Baynham Calvin Johnson nr. Stephen Hill
Year 2006 1999 2000 1998 1972 2009 1951 1997 1965 2004 2011
TD 15 10 10 9 9 8 8 7 7 7 4
100-YARD RECEIVING GAMES 1. Calvin Johnson 2006 2. Jonathan Smith 2003 Harvey Middleton 1997 4. John Sias 1968 5. Demaryius Thomas 2009 Kelly Campbell 1999 Dez White 1998 Dez White 1999 9. Stephen Hill 2011
No. 7 6 6 5 4 4 4 4 3
PATs 1. Justin Moore Luke Manget 3. Brad Chambers 4. Scott Blair 5. Travis Bell 6. Luke Manget 7. Scott Sisson Pepper Rodgers 9. Luke Manget 10. Scott Blair Travis Bell
Year 2011 1999 1998 2009 2006 2001 1990 1952 2000 2010 2007
No. 53 53 46 45 43 40 39 39 38 37 37
TOTAL OFFENSE 1. Joe Hamilton 2. George Godsey 3. George Godsey 4. Joe Hamilton 5. Joshua Nesbitt 6. Shawn Jones 7. Reggie Ball 8. Reggie Ball 9. Joe Hamilton 10. Tevin Washington 11. Reggie Ball
Year 1999 2001 2000 1997 2009 1991 2005 2004 1998 2011 2003
Yards 3,794 3,040 2,945 2,792 2,738 2,649 2,546 2,479 2,464 2,405 2,380
ALL-PURPOSE YARDS 1. Eddie Lee Ivery 2. Jonathan Dwyer 3. Kelly Campbell 4. Dez White 5. Jerry Mays 6. Dez White 7. Tashard Choice 8. Robert Lavette Kerry Watkins nr. Orwin Smith
Year 1978 2008 2000 1998 1989 1999 2006 1982 2002 2011
Yards 1,879 1,775 1,682 1,655 1,624 1,616 1,571 1,570 1,570 1,274
TOUCHDOWNS RESPONSIBLE FOR 1. Joe Hamilton 1999 2. Joshua Nesbitt 2009 3. George Godsey 2000 4. Tevin Washington 2011 5. Reggie Ball 2006 George Godsey 2001 7. Joe Hamilton 1998 8. Robert Lavette 1982 Shawn Jones 1990 10. Shawn Jones 1991 Shawn Jones 1992 Reggie Ball 2004 13. Three players
TD 35 28 25 24 22 22 21 19 19 18 18 18 17
TOUCHDOWNS 1. Robert Lavette 2. Joshua Nesbitt 3. Calvin Johnson Joe Burns 5. Tevin Washington Jonathan Dwyer Robert Lavette 8. Jonathan Dwyer Joe Burns Sean Gregory C.J. Williams 12. Orwin Smith Tashard Choice Kelly Campbell Jerry Mays Lenny Snow 17. Kelly Campbell Eddie Lee Ivery Tony Hollings P.J. Daniels
Year 1982 2009 2006 2001 2011 2009 1984 2008 2000 1999 1995 2011 2006 2000 1989 1966 1999 1978 2002 2003
TD 19 18 15 15 14 14 14 13 13 13 13 12 12 12 12 12 11 11 11 11
POINTS 1. Robert Lavette 2. Joshua Nesbitt 3. Travis Bell 4. Luke Manget 5. Joe Burns 6. Calvin Johnson 7. Billy Lothridge 8. Scott Blair 9. Luke Manget 10. Tevin Washington Jonathan Dwyer Robert Lavette Scott Sisson 14. Scott Blair Brad Chambers 16. Justin Moore Jonathan Dwyer 18. Dan Burnett Travis Bell 20. Joe Burns
Year 1982 2009 2007 2001 2001 2006 1962 2009 1999 2011 2009 1984 1990 2010 1998 2011 2008 2003 2006 2000
Pts 114 108 106 97 92 90 89 87 86 84 84 84 84 82 82 80 80 79 79 78
1999 1995 1992 2004 2011
78 78 77 76 72
POINTS BY KICKING 1. Travis Bell 2. Luke Manget 3. Scott Blair 4. Luke Manget 5. Scott Sisson 6. Scott Blair Brad Chambers 8. Justin Moore 9. Dan Burnett 10. Scott Sisson 11. Travis Bell 12. Scott Sisson 13. Luke Manget
Year 2007 2001 2009 1999 1990 2010 1998 2011 2003 1992 2004 1989 2000
Pts 106 97 87 86 84 82 82 80 79 77 76 75 74
TACKLES BY LINEBACKERS 1. Joe Harris 2. Duane Wood 3. Eric Thomas 4. Keyaron Fox 5. Rob Horton 6. Keith Brooking 7. Keith Brooking Jamal Cox 9. Ron Rogers Jerelle Williams Jerelle Williams 12. Calvin Tiggle 13. Buck Shiver 14. Keith Brooking 15. Rob Horton nr. Julian Burnett
Year 1974 1980 1989 2003 1981 1996 1995 1994 1995 1990 1989 1990 1968 1997 1983 2011
Total 188 171 159 155 150 147 146 146 145 145 145 134 133 131 129 101
23. 24. nr.
Sean Gregory C.J. Williams Scott Sisson Travis Bell Orwin Smith
TEAM/SEASON TOTAL OFFENSE Year G 1999 11 2011 12 2000 11 2009 14 2001 12 1984 11 2010 13 1993 11 1990 11 1998 11
Yards 5,599 5,515 4,789 5,910 5,015 4,556 5,294 4,398 4,334 4,276
PG 509.0 459.6 435.4 422.1 417.9 414.3 407.2 399.8 394.0 388.7
RUSHING OFFENSE Year G 1975 11 2010 13 2011 12 2009 14 1974 11 1977 11 2008 13 1976 11 1952 12 1984 11
Yards 3,637 4,203 3,802 4,136 3,162 3,153 3,552 2,689 2,848 2,585
PG 329.7 323.3 316.8 295.4 287.5 286.8 273.2 244.5 237.3 235.0
SCORING OFFENSE Year G 1918 7 1917 9 1916 9 1999 11 1921 9 1998 11 2011 12 1920 9 2009 14 2000 11
Pts 462 491 421 448 360 391 419 312 473 372
PG 66.0 54.5 46.8 40.7 40.0 35.5 34.9 34.7 33.8 33.8
RAMBLINWRECK.COM
2011 GEORGIA TECH DEPTH CHART OFFENSE
End of regular season
DEFENSE
QB
13 10
Tevin Washington Synjyn Days
r-Jr. r-Fr.
6-0 6-1
205 212
DE
92 93
Jason Peters Emmanuel Dieke
r-Sr. r-So.
6-4 6-6
270 264
BB
7 27 21
David Sims Preston Lyons or Charles Perkins
r-So. r-Sr. r-Fr.
6-0 6-0 6-0
218 211 219
DT
96 90
Logan Walls T.J. Barnes
r-Sr. r-Jr.
6-2 6-7
299 347
DE AB
17 24
Orwin Smith Embry Peeples
Jr. Sr.
6-0 5-10
202 185
94 99
Izaan Cross Euclid Cummings
Jr. r-So.
6-4 6-4
292 270
OLB AB
20 9
Roddy Jones Tony Zenon
r-Sr. r-Fr.
5-9 5-8
202 182
45 42
Jeremiah Attaochu Malcolm Munroe
So. r-Jr.
6-3 6-3
223 232
ILB WR
84 81
Tyler Melton Jeff Greene
Sr. Fr.
6-0 6-4
206 200
40 54
Julian Burnett Quayshawn Nealy
Jr. r-Fr.
5-10 6-1
220 220
WR
5 80
Stephen Hill Daniel McKayhan
Jr. r-Jr.
6-5 6-0
206 198
ILB
54 30
Quayshawn Nealy or Daniel Drummond
r-Fr. r-So.
6-1 6-3
220 248
LT
64 57
Ray Beno Catlin Alford
r-So. r-Fr.
6-2 6-3
290 295
OLB
34 11
Steven Sylvester Brandon Watts
Sr. r-So.
6-2 6-2
238 234
LG
52 70
Will Jackson Shaq Mason
r-So. Fr.
6-3 6-1
285 295
LCB
6 36
Rod Sweeting Jamal Golden
Jr. Fr.
6-0 6-0
184 185
C
50 76
Jay Finch Nick McRae
r-So. r-Jr.
6-3 6-3
283 291
LS
1 16
Isaiah Johnson Corey Dennis
So. Fr.
6-2 6-2
205 205
RG
77 71
Omoregie Uzzi J.C. Lanier
r-Jr. r-So.
6-3 6-4
300 298
RS
28 14
Rashaad Reid Jemea Thomas
Sr. r-So.
5-10 5-10
191 190
RT
61 69
Phil Smith or Tyler Kidney
r-Jr. r-So.
6-5 6-2
292 262
RCB
8 35
Louis Young Michael Peterson
So. r-Sr.
6-1 5-11
201 190
So. So. Fr. r-So.
5-11 6-1 6-3 6-2
171 209 270 206
OUT FOR THE SEASON
SPECIAL TEAMS K
86 44
Justin Moore David Scully
So. r-So.
5-10 6-2
171 201
P
82 85
Sean Poole Chandler Anderson
r-So. r-Sr.
6-1 6-0
161 180
H
82
Sean Poole
r-So.
6-1
161
LS
55 63
Sean Tobin Tyler Morgan
Fr. Jr.
6-3 6-3
220 211
KO
44 86
David Scully Justin Moore
r-So. So.
6-2 5-10
201 171
KR
17 9 20
Orwin Smith Tony Zenon or Roddy Jones
Jr. r-Fr. r-Sr.
6-0 5-8 5-9
202 182 202
PR
14 37 9
Jemea Thomas Zach Laskey Tony Zenon
r-So. Fr. r-Fr.
5-10 6-1 5-8
190 201 182
AB S DE S
4 15 98 26
B.J. Bostic Fred Holton Jimmie Kitchen Lance Richardson
HOW TO SAY IT Players Marty Alcala . . . . . . . . . . . . . . . . . . . . . . . . . . .Al-K-la Jeremiah Attaochu . . . . . . . . . . . . . . . . .Ah-towl-choo Ray Beno . . . . . . . . . . . . . . . . . . . . . . . . . . . .Bean-O Izaan Cross . . . . . . . . . . . . . . . . . . . . . . . . . . .I-zjahn Emmanuel Dieke . . . . . . . . . . . . . . . . . . . . . . .D-ay-K B.J. Machen . . . . . . . . . . . . . . . . . . . . . . . . .may-chin Jemea Thomas . . . . . . . . . . . . . . . . . . . . . . .Ja-ME-a Omoregie Uzzi . . . . . . . . . . . . . . . .a-more-gay ooze-E Tony Zenon . . . . . . . . . . . . . . . . . . . . . . . . . . .Zen-IN Assistant Coaches Mike Sewak . . . . . . . . . . . . . . . . . . . . . . . . . .C-wahk Director of Athletics Dan Radakovich . . . . . . . . . . . . . . . . . .rad-uh-CO-vich
2011 GEORGIA TECH FOOTBALL
RAMBLINWRECK.COM
2011 GEORGIA TECH ALPHABETICAL ROSTER No. +87 57 +65 +89 +85 45 72 90 +(d)69 64 4 %78 40 +(d)29 +(d)91 +#91 53 +(d)8 39 +(d)33 95 94 99 10 16 +(d)11 93 30 +47 50 +(d)15 +(d)79 25 36 97 81 51 +(d)57 31 5 68 15 41 +(d)55 33 52 +(d)47 75 1 20 +67 +62 69 98 71 37 2 +73 29 +(d)22 27 58 +38 59 70 +(d)3 80 46 +(d)43 76 84 48 18 83 86 63 42 54 23 +(d)82 +(d)31 +49 24 21 92 35 +82 +6(d) 28 26 +(d)50 +(d)14 +(d)53 +44 +74
Name Pos. Marty Alcala WR Catlin Alford OL Corey Alford LB Jamie Alvarez WR Chandler Anderson K/P Jeremiah Attaochu LB Morgan Bailey OL T.J. Barnes DT John Barnett OL Ray Beno OL B.J. Bostic AB Trey Braun OL Julian Burnett LB Coray Carlson DB Joey Carman DL Morgan Carter LB Bryan Chamberlain OL Andrew Chau K/P Chaz Cheeks LB Matt Connors BB Chris Crenshaw DE Izaan Cross DE Euclid Cummings DE Synjyn Days QB Corey Dennis DB Darryl Dickey QB Emmanuel Dieke DE Daniel Drummond LB Andy Elakman K Jay Finch OL Deonte Fletcher QB Adrian Gardner DE Robert Godhigh AB Jamal Golden DB Shawn Green DL Jeff Greene WR Anthony Harrell LB Blake Hembree LB Deon Hill AB Stephen Hill WR Robert Hogan III LB Fred Holton S Jabari Hunt-Days LB Adam Hyman LB/LS Chris Jackson WR Will Jackson OL Jerredith Jiles DB Errin Joe OL Isaiah Johnson S Roddy Jones AB Ben Keith DT Tyler Kelly OLB Tyler Kidney OL Jimmie Kitchen DE J.C. Lanier OL Zach Laskey RB Vad Lee QB Xavier Lewis DL Jon Lockhart WR Nick Luly DB Preston Lyons BB B.J. Machen LB Stephen Mann S Tyler Marcordes LB Shaquille Mason OL Michael McDonald P Daniel McKayhan WR Tremayne McNair LB Sam McNearney AB Nick McRae OL Tyler Melton WR Nick Menocal LB Chris Milton RB Jeremy Moore WR Justin Moore K Tyler Morgan LS Malcolm Munroe OLB Quayshawn Nealy LB Domonique Noble DB Brandon Oliver WR Denis Onwuala AB/CB Jamal Paige AB Embry Peeples AB Charles Perkins RB Jason Peters DE Michael Peterson CB Sean Poole P Ty Rawlings K Rashaad Reid DB Lance Richardson S Joshua Rogers LB Scott Schroer AB Rusty Scott LB David Scully K Tim Seager OL
Ht. 6-5 6-3 5-11 6-1 6-0 6-3 6-4 6-7 6-3 6-2 5-11 6-5 5-10 6-0 6-2 6-4 6-4 5-10 6-4 6-0 6-3 6-4 6-4 6-1 6-2 5-10 6-6 6-3 6-0 6-3 5-10 6-2 5-7 6-0 6-0 6-4 6-2 6-0 6-0 6-5 6-0 6-1 6-3 6-1 6-1 6-3 5-8 6-3 6-2 5-9 6-1 6-7 6-2 6-3 6-4 6-1 6-1 6-2 6-0 6-1 6-0 6-1 6-0 6-4 6-1 6-2 6-0 6-2 5-6 6-3 6-0 6-3 5-11 6-3 5-10 6-3 6-3 6-1 6-2 5-11 5-8 5-9 5-10 6-0 6-4 5-11 6-1 5-10 5-10 6-2 5-9 5-9 6-3 6-2 6-2
Wt. 215 295 228 200 187 235 298 347 230 290 171 295 220 175 270 238 297 165 223 200 264 292 270 212 205 203 264 248 181 283 204 245 187 185 287 200 235 205 205 206 217 209 244 215 205 285 190 295 205 202 250 225 262 270 298 201 206 275 190 192 211 232 230 234 295 210 198 225 165 291 206 240 180 180 171 211 225 223 191 195 170 180 185 219 270 190 161 157 191 206 207 185 212 201 295
Cl. VL Hometown High School r-Fr. 0 Alpharetta, Ga. Milton r-Fr. 0 Adairsville, Ga. Adairsville r-So. 0 Conyers, Ga. Heritage r-Fr. 0 Ft. Myers, Fla. Bishop Verot r-Sr. 3 Columbus, Ga. Shaw So. 1 Washington, D.C. Archbishop Carroll r-Fr. 0 Loganville, Ga. Loganville r-Jr. 2 Enterprise, Ala. Enterprise Mt. Vernon Presbyterian So. 0 Atlanta, Ga. r-So. 1 Newnan, Ga. Newnan So. 1 Louisville, Ga. Jefferson County Fr. 0 Tallahassee, Fla. Leon Jr. 2 Macon, Ga. Westside r-Fr. 0 Marietta, Ga. Lassiter So. 0 Ola r-Jr. 0 Woodbridge, Va. CD Hylton Fr. 0 Albany, Ga. Monroe Fr. 0 Griffin, Ga. Pike County Fr. 0 Gainesville, Ga. East Hall r-Fr. 0 Alpharetta, Ga. Marist School r-So. 0 Louisville, Ga. Jefferson County Jr. 2 Flowery Branch, Ga. Flowery Branch r-So. 0 Atlanta, Ga. Centennial r-Fr. 0 Powder Springs, Ga. Hillgrove Fr. 0 Troy, Ala. Charles Henderson r-Fr. 0 Locust Grove, Ga. Ola r-So. 1 Riverdale, Ga. North Clayton r-So. 0 Flowery Branch, Ga. Flowery Branch r-Jr. 0 Calhoun, Ga. Calhoun r-So. 1 Acworth, Ga. Kennesaw Mountain Jr. 0 Harlem, N.Y. Salem (Ga.) Fr. 0 Dawson, Ga. Terrell County r-So. 1 Acworth, Ga. Harrison Fr. 0 Wetumpka, Ala. Wetumpka r-Fr. 0 Grayson, Ga. Grayson Fr. 0 Peachtree City, Ga. Starr’s Mill Fr. 0 Tampa, Fla. Jesuit Fr. 0 Canton, Ga. The King’s Academy r-Fr. 0 Phenix City, Ala. Central Jr. 2 Lithonia, Ga. Miller Grove r-Jr. 0 Newnan, Ga. Newnan Christian So. 1 Thomasville, Ga. Thomasville Fr. 0 Marietta, Ga. Hillgrove Fr. 0 Tarboro, N.C. SW Edgecombe r-Jr. 0 McDonough, Ga. Henry County r-So. 1 Knoxville, Tenn. Farragut Fr. 0 Jackson, Miss. Murrah Fr. 0 Lakeland, Fla. Lake Gibson So. 1 Tyrone, Ga. Sandy Creek r-Sr. 3 Stone Mountain, Ga. Chamblee r-So. 0 Gainesville, Fla. Buchholz r-So. 0 Conyers, Ga. Rockdale r-So. 1 Alpharetta, Ga. Northview Fr. 0 Lithonia, Ga. Lithonia r-So. 0 Stillmore, Ga. Emanuel County Inst. Fr. 0 Peachtree City, Ga. Starr’s Mill Fr. 0 Durham, N.C. Hillside Jr. 0 Stone Mountain, Ga. Stephenson r-Jr. 2 Blountstown, Fla. Blountstown Fr. 0 Alpharetta, Ga. Creekview r-Sr. 2 Atlanta, Ga. Marist School r-Jr. 1 Hilliard, Ohio Hilliard Darby r-Jr. 0 Malabar, Fla. Palm Bay Normal Community West Fr. 0 Normal, Ill. Fr. 0 Columbia, Tenn. Columbia Central r-Fr. 0 Atlanta, Ga. Woodward Academy r-Jr. 2 Decatur, Ga. Martin Luther King, Jr. Fr. 0 Jacksonville, N.C. White Oak r-Fr. 0 Atlanta, Ga. Marist School r-Jr. 2 Dublin, Ga. Dublin Sr. 3 Houston, Texas Langham Creek Fr. 0 Miami, Fla. Belen Jesuit Prep Fr. 0 Folkston, Ga. Charlton County r-So. 0 Austin, Texas Lyndon B. Johnson So. 0 Atlanta, Ga. Marist School Jr. 2 Fayetteville, Ga. Whitewater r-Jr. 2 Miami, Fla. Coral Reef r-Fr. 0 Lakeland, Fla. Lakeland Fr. 0 Mount Ulla, N.C. West Rowan Fr. 0 Douglasville, Ga. Lithia Springs Fr. 0 Alpharetta, Ga. Northview r-Jr. 2 Atlanta, Ga. Woodward Academy Sr. 3 Orlando, Fla. Dr. Phillips r-Fr. 0 Lawrenceville, Ga. Collins Hill r-Sr. 3 Baton Rouge, La. Catholic r-Sr. 3 Tampa,Fla. Jesuit r-So. 1 Tallahassee, Fla. Chiles r-Sr. 0 Griffin, Ga. Spalding Sr. 3 St. Augustine, Fla. St. Augustine r-So. 0 Ware Shoals, S.C. Ware Shoals r-Fr. 0 Canton, Ga. Sequoyah So. 0 Dunwoody, Ga. Wesleyan Fr. 0 Lincolnton, Ga. Lincoln County r-So. 0 Dawsonville, Ga. Dawson County Fr. 0 Blacksburg, Va. Blacksburg
2011 GEORGIA TECH FOOTBALL
No. 66 7 12 17 61 22 +60 +79 6 34 +(d)17 14 55 43 +(d)49 77 88 96 13 32 11 56 8 9
Name Pos. Matt Serpico LB David Sims BB Demond Smith QB/DB Orwin Smith AB Phil Smith OT Broderick Snoddy RB Ryan Sparlin LB Bryce Sweeney OL Rod Sweeting CB Steven Sylvester LB Chris Tanner K/P Jemea Thomas DB Sean Tobin SN/LB Kyle Travis LB Cole Turner DB Omoregie Uzzi OG Darren Waller WR/DB Logan Walls DT Tevin Washington QB Richard Watson BB Brandon Watts LB Anthony Williams DE Louis Young CB Tony Zenon AB
Medically Inactive Denzel McCoy
DL
Ht. 6-4 6-0 6-0 6-0 6-5 5-9 6-0 6-5 6-0 6-2 6-0 5-10 6-3 6-3 6-3 6-3 6-5 6-2 6-0 6-1 6-2 6-4 6-1 5-8
Wt. 231 218 185 202 292 190 237 255 184 240 178 190 220 235 200 300 220 299 205 237 234 252 201 182
6-3
283
Cl. VL Hometown Fr. 0 Fayetteville, Ga. r-So. 0 St. Matthews, S.C. Fr. 0 Monroe, Ga. Jr. 2 Phenix City, Ala. r-Jr. 2 Tampa, Fla. Fr. 0 Carrollton, Ga. r-Fr. 0 Kennesaw, Ga. Fr. 0 Kingsland, Ga. Jr. 2 Locust Grove, Ga. Sr. 3 McDonough, Ga. r-Jr. 1 Norcross, Ga. r-So. 1 Fitzgerald, Ga. Fr. 0 Holmdel, N.J. Fr. 0 Cumming, Ga. Fr. 0 Augusta, Ga. r-Jr. 2 Lithonia, Ga. Fr. 0 Acworth, Ga. r-Sr. 3 Dawsonville, Ga. r-Jr. 1 Wetumpka, Ala. r-Jr. 2 Tallahassee, Fla. r-So. 1 Tennille, Ga. r-Fr. 0 McDonough, Ga. So. 1 Washington, DC r-Fr. 0 Albany, Ga.
r-Fr.
0
Lawrenceville, Ga.
High School Whitewater Calhoun County Monroe Area Central Jesuit Carrollton Harrison Camden County Luella Union Grove Norcross Fitzgerald Saint John Vianney South Forsyth Augusta Christian Chamblee North Cobb Dawson County Wetumpka FAMU HS Washington County Union Grove Good Counsel Deerfield Windsor Acad.
Northview
+ Denotes non-scholarship player Jersey numbers are very tentative % Enrolled at Georgia Tech in January, 2011 # Transfer, eligible in 2011 (d) Denotes duplicate number Weights are from May, 2011
RAMBLINWRECK.COM
2011 GEORGIA TECH NUMERICAL ROSTER No. 1 2 4 5 6 7 8 9 10 11 12 13 14 15 16 17 18 20 21 22 23 24 25 26 27 28 29 30 31 32 33 34 35 36 37 +38 39 40 41 42 43 +44 45 46 +47 48 +49 50 51 52 53 54 55 56 57 58 59 +60 61 +62 63 64 +65 66 +67 68 69 70 71 72 +73 +74 75 76 77 %78 +79 80 81 +82 83 84 +85 86 +87 88 +89 90 +#91 92 93 94 95 96 97
Name Pos. Isaiah Johnson S Vad Lee QB B.J. Bostic AB Stephen Hill WR Rod Sweeting CB David Sims BB Louis Young CB Tony Zenon AB Synjyn Days QB Brandon Watts LB Demond Smith QB/DB Tevin Washington QB Jemea Thomas DB Fred Holton S Corey Dennis DB Orwin Smith AB Chris Milton RB Roddy Jones AB Charles Perkins RB Broderick Snoddy RB Domonique Noble DB Embry Peeples AB Robert Godhigh AB Lance Richardson S Preston Lyons BB Rashaad Reid DB Jon Lockhart WR Daniel Drummond LB Deon Hill AB Richard Watson BB Chris Jackson WR Steven Sylvester LB Michael Peterson CB Jamal Golden DB Zach Laskey RB Stephen Mann S Chaz Cheeks LB Julian Burnett LB Jabari Hunt-Days LB Malcolm Munroe OLB Kyle Travis LB David Scully K Jeremiah Attaochu LB Tremayne McNair LB Andy Elakman K Nick Menocal LB Jamal Paige AB Jay Finch OL Anthony Harrell LB Will Jackson OL Bryan Chamberlain OL Quayshawn Nealy LB Sean Tobin SN/LB Anthony Williams DE Catlin Alford OL B.J. Machen LB Tyler Marcordes LB Ryan Sparlin LB Phil Smith OT Tyler Kelly OLB Tyler Morgan LS/WR Ray Beno OL Corey Alford LB Matt Serpico LB Ben Keith DT Robert Hogan III LB Tyler Kidney OL Shaquille Mason OL J.C. Lanier OL Morgan Bailey OL Xavier Lewis DL Tim Seager OL Errin Joe OL Nick McRae OL Omoregie Uzzi OG Trey Braun OL Bryce Sweeney OL Daniel McKayhan WR Jeff Greene WR Sean Poole P Jeremy Moore WR Tyler Melton WR Chandler Anderson K/P Justin Moore K Marty Alcala WR Darren Waller WR/DB Jamie Alvarez WR T.J. Barnes DT Morgan Carter LB Jason Peters DE Emmanuel Dieke DE Izaan Cross DE Chris Crenshaw DE Logan Walls DT Shawn Green DL
Ht. 6-2 6-1 5-11 6-5 6-0 6-0 6-1 5-8 6-1 6-2 6-0 6-0 5-10 6-1 6-2 6-0 5-11 5-9 6-0 5-9 6-2 5-10 5-7 6-2 6-0 5-10 6-0 6-3 6-0 6-1 6-1 6-2 5-11 6-0 6-1 6-0 6-4 5-10 6-3 6-3 6-3 6-2 6-3 6-2 6-0 6-3 5-9 6-3 6-2 6-3 6-4 6-1 6-3 6-4 6-3 6-1 6-4 6-0 6-5 6-7 6-3 6-2 5-11 6-4 6-1 6-0 6-2 6-1 6-4 6-4 6-2 6-2 6-3 6-3 6-3 6-5 6-5 6-0 6-4 6-1 6-3 6-0 6-0 5-10 6-5 6-5 6-1 6-7 6-4 6-4 6-6 6-4 6-3 6-2 6-0
Wt. 205 206 171 206 184 218 201 182 212 234 185 205 190 209 205 202 180 202 219 190 191 185 187 206 211 191 190 248 205 237 205 240 190 185 201 230 223 220 244 225 235 201 235 225 181 240 180 283 235 285 297 223 220 252 295 232 234 237 292 225 211 290 228 231 250 217 262 295 298 298 275 295 295 291 300 295 255 198 200 161 180 206 187 171 215 220 200 347 238 270 264 292 264 299 287
Cl. VL Hometown So. 1 Tyrone, Ga. Fr. 0 Durham, N.C. So. 1 Louisville, Ga. Jr. 2 Lithonia, Ga. Jr. 2 Locust Grove, Ga. r-So. 0 St. Matthews, S.C. So. 1 Washington, DC r-Fr. 0 Albany, Ga. r-Fr. 0 Powder Springs, Ga. r-So. 1 Tennille, Ga. Fr. 0 Monroe, Ga. r-Jr. 1 Wetumpka, Ala. r-So. 1 Fitzgerald, Ga. So. 1 Thomasville, Ga. Fr. 0 Troy, Ala. Jr. 2 Phenix City, Ala. Fr. 0 Folkston, Ga. r-Sr. 3 Stone Mountain, Ga. r-Fr. 0 Lawrenceville, Ga. Fr. 0 Carrollton, Ga. Fr. 0 Mount Ulla, N.C. Sr. 3 Orlando, Fla. r-So. 1 Acworth, Ga. r-So. 0 Ware Shoals, S.C. r-Sr. 2 Atlanta, Ga. Sr. 3 St. Augustine, Fla. r-Jr. 2 Blountstown, Fla. r-So. 0 Flowery Branch, Ga. r-Fr. 0 Phenix City, Ala. r-Jr. 2 Tallahassee, Fla. r-Jr. 0 McDonough, Ga. Sr. 3 McDonough, Ga. r-Sr. 3 Tampa,Fla. Fr. 0 Wetumpka, Ala. Fr. 0 Peachtree City, Ga. r-Jr. 0 Malabar, Fla. Fr. 0 Gainesville, Ga. Jr. 2 Macon, Ga. Fr. 0 Marietta, Ga. r-Jr. 2 Miami, Fla. Fr. 0 Cumming, Ga. r-So. 0 Dawsonville, Ga. So. 1 Washington, D.C. Fr. 0 Jacksonville, N.C. r-Jr. 0 Calhoun, Ga. Fr. 0 Miami, Fla. r-Jr. 2 Atlanta, Ga. r-So. 1 Acworth, Ga. Fr. 0 Tampa, Fla. r-So. 1 Knoxville, Tenn. Fr. 0 Albany, Ga. r-Fr. 0 Lakeland, Fla. Fr. 0 Holmdel, N.J. r-Fr. 0 McDonough, Ga. r-Fr. 0 Adairsville, Ga. r-Jr. 1 Hilliard, Ohio Fr. 0 Normal, Ill. r-Fr. 0 Kennesaw, Ga. r-Jr. 2 Tampa, Fla. r-So. 0 Conyers, Ga. Jr. 2 Fayetteville, Ga. r-So. 1 Newnan, Ga. r-So. 0 Conyers, Ga. Fr. 0 Fayetteville, Ga. r-So. 0 Gainesville, Fla. r-Jr. 0 Newnan, Ga. r-So. 1 Alpharetta, Ga. Fr. 0 Columbia, Tenn. r-So. 0 Stillmore, Ga. r-Fr. 0 Loganville, Ga. Jr. 0 Stone Mountain, Ga. Fr. 0 Blacksburg, Va. Fr. 0 Lakeland, Fla. r-Jr. 2 Dublin, Ga. r-Jr. 2 Lithonia, Ga. Fr. 0 Tallahassee, Fla. Fr. 0 Kingsland, Ga. r-Jr. 2 Decatur, Ga. Fr. 0 Peachtree City, Ga. r-So. 1 Tallahassee, Fla. r-So. 0 Austin, Texas Sr. 3 Houston, Texas r-Sr. 3 Columbus, Ga. So. 0 Atlanta, Ga. r-Fr. 0 Alpharetta, Ga. Fr. 0 Acworth, Ga. r-Fr. 0 Ft. Myers, Fla. r-Jr. 2 Enterprise, Ala. r-Jr. 0 Woodbridge, Va. r-Sr. 3 Baton Rouge, La. r-So. 1 Riverdale, Ga. Jr. 2 Flowery Branch, Ga. r-So. 0 Louisville, Ga. r-Sr. 3 Dawsonville, Ga. r-Fr. 0 Grayson, Ga.
2011 GEORGIA TECH FOOTBALL
High School Sandy Creek Hillside Jefferson County Miller Grove Luella Calhoun County Good Counsel Deerfield Windsor Acad.
Hillgrove Washington County Monroe Area Wetumpka Fitzgerald Thomasville Charles Henderson Central Charlton County Chamblee Collins Hill Carrollton West Rowan Dr. Phillips Harrison Ware Shoals Marist School St. Augustine Blountstown Flowery Branch Central FAMU HS Henry County Union Grove Jesuit Wetumpka Starr’s Mill Palm Bay East Hall Westside Hillgrove Coral Reef South Forsyth Dawson County Archbishop Carroll White Oak Calhoun Belen Jesuit Prep Woodward Academy Kennesaw Mountain Jesuit Farragut Monroe Lakeland Saint John Vianney Union Grove Adairsville Hilliard Darby
No. Name 98 Jimmie Kitchen 99 Euclid Cummings
Pos. DE DE
Ht. 6-3 6-4
Wt. 270 270
Cl. VL Hometown Fr. 0 Lithonia, Ga. r-So. 0 Atlanta, Ga.
High School Lithonia Centennial
Duplicate Numbers No. Name Pos. +(d)3 Michael McDonald P +(d)6 Ty Rawlings K +(d)8 Andrew Chau K/P +(d)11 Darryl Dickey QB +(d)14 Scott Schroer AB +(d)15 Deonte Fletcher QB +(d)17 Chris Tanner K/P +(d)22 Nick Luly DB +(d)29 Coray Carlson DB +(d)31 Denis Onwuala AB/CB +(d)33 Matt Connors BB +(d)43 Sam McNearney AB +(d)47 Jerredith Jiles DB +(d)49 Cole Turner DB +(d)50 Joshua Rogers LB +(d)53 Rusty Scott LB +(d)55 Adam Hyman LB/LS +(d)57 Blake Hembree LB +(d)69 John Barnett OL +(d)79 Adrian Gardner DE +(d)82 Brandon Oliver WR +(d)91 Joey Carman DL
Ht. 6-2 5-10 5-10 5-10 5-9 5-10 6-0 6-1 6-0 5-8 6-0 5-6 5-8 6-3 5-9 6-3 6-1 6-0 6-3 6-2 5-11 6-2
Wt. 210 157 165 203 185 204 178 192 175 170 200 165 190 200 207 212 215 205 230 245 195 270
Cl. VL Hometown r-Fr. 0 Atlanta, Ga. r-Sr. 0 Griffin, Ga. Fr. 0 Griffin, Ga. r-Fr. 0 Locust Grove, Ga. So. 0 Dunwoody, Ga. Jr. 0 Harlem, N.Y. r-Jr. 1 Norcross, Ga. Fr. 0 Alpharetta, Ga. r-Fr. 0 Marietta, Ga. Fr. 0 Alpharetta, Ga. r-Fr. 0 Alpharetta, Ga. r-Fr. 0 Atlanta, Ga. Fr. 0 Jackson, Miss. Fr. 0 Augusta, Ga. r-Fr. 0 Canton, Ga. Fr. 0 Lincolnton, Ga. Fr. 0 Tarboro, N.C. Fr. 0 Canton, Ga. So. 0 Atlanta, Ga. Fr. 0 Dawson, Ga. Fr. 0 Douglasville, Ga. So. 0
High School Woodward Academy Spalding Pike County Ola Wesleyan Salem (Ga.) Norcross Creekview Lassiter Northview Marist School Marist School Murrah Augusta Christian Sequoyah Lincoln County SW Edgecombe The King’s Academy Mt. Vernon Presbyterian Terrell County Lithia Springs Ola
6-3
283
r-Fr.
Northview
Medically Inactive Denzel McCoy
DL
0
Lawrenceville, Ga.
+ Denotes non-scholarship player Jersey numbers are very tentative % Enrolled at Georgia Tech in January, 2011 # Transfer, eligible in 2011 (d) Denotes duplicate number Weights are from May, 2011
Normal Community West
Harrison Jesuit Rockdale Whitewater Newnan Heritage Whitewater Buchholz Newnan Christian Northview Columbia Central Emanuel County Inst. Loganville Stephenson Blacksburg Lake Gibson Dublin Chamblee Leon Camden County Martin Luther King, Jr. Starr’s Mill Chiles Lyndon B. Johnson Langham Creek Shaw Marist School Milton North Cobb Bishop Verot Enterprise CD Hylton Catholic North Clayton Flowery Branch Jefferson County Dawson County Grayson
RAMBLINWRECK.COM
INDIVIDUAL STATISTICS & CAREER HIGHS CHANDLER ANDERSON Year G Punts Yds 2011 6 4 150 2010 13 6 192 2009 14 37 1,565 2008 13 6 250 TOTAL 45 53 2,157
Avg 37.5 32.0 42.3 41.7 40.7
Net 37.5 30.8 38.1 39.0 37.0
50+ I-20 Ret Long 0 1 0 42 0 2 2-7 43 7 12 10-74 63 1 1 2-16 56 8 16 14-97 63
CAREER HIGHS Punts: 7 vs. Iowa, Jan. 5, 2010 Longest Punt: 63 at Miami, Sept. 17, 2009 I-20: 3 vs. Iowa, Jan. 5, 2010 -----------------------------------------------------------------------JEREMIAH ATTAOCHU Year G-GS P-A Tkl TFL Sck FC FR Int PB 2011 10-9 31-21 52 8.5-53 6.0-45 1 1-0 1-5 2 2010 12-1 18-5 23 4.0-30 3.0-28 0 0 0 0 TOTAL 22-10 49-26 75 12.5-83 9.0-73 1 1 1-5 2 CAREER HIGHS Tackles: 10 vs. Virginia Tech, Nov. 10, 2011 Solo Tackles: 5, four times TFL: 3.0 vs. North Carolina, Sept. 24, 2011 Sacks: 3.0 vs. North Carolina, Sept. 24, 2011 FR: 1 vs. Western Carolina, Sept. 1, 2011 PB: 1 vs. North Carolina, Sept. 24, 2011 INTs: 1 at Miami, Oct. 22, 2011 -----------------------------------------------------------------------T.J. BARNES Year G-GS P-A Tkl TFL Sck FC FR Int PB 2011 12-0 3-8 11 1.5-17 1.0-16 0 0 0 0 2010 12-1 8-12 20 0.5-1 0 0 0 0 1 2009 14-2 7-9 16 1.5-6 0 0 0 0 0 TOTAL 38-3 18-29 47 3.5-24 1.0-16 0 0 0 1 CAREER HIGHS Tackles: 5 at North Carolina, Sept. 18, 2010 TFL: 1.5 vs. Clemson, Oct. 29, 2011 Sacks: 1.0 vs. Clemson, Oct. 29, 2011 PB: 1 vs. Air Force, Dec. 27, 2010 -----------------------------------------------------------------------B.J. BOSTIC Year GP-S Rush Yds Avg TD LP Rec Yds Avg TD LP 2011 --INJURED-2010 13-0 13 127 9.8 0 43 0 0 0.0 0 0 TOTAL 13-0 13 127 9.8 0 43 0 0 0.0 0 0 Kick Returns Att 2010 28
Yds Avg TD LP 574 20.5 0 35
CAREER HIGHS Rushing Attempts: 5 vs. South Carolina State, Sept. 4, 2010 Rushing Yards: 51 vs. NC State, Sept. 25, 2010 Longest Rush: 43 vs. NC State, Sept. 25, 2010 Kick Returns: 6 vs. Miami, Nov. 13, 2010; 6 at Georgia, Nov. 27, 2010 Kick Return Yards: 125 vs. Miami, Nov. 13, 2010 Longest Kick Return: 35 vs. NC State, Sept. 25, 2010 -----------------------------------------------------------------------JULIAN BURNETT Year G-GS P-A Tkl TFL Sck FC FR Int PB 2011 12-12 58-55 113 9.5-25 1.0-6 1 1 0 3 2010 13-8 42-47 89 2.0-3 0 2 1 1-10 1 2009 13-3 26-15 41 1.5-3 0.5-2 0 0 0 0 TOTAL 38-23 126-117 243 13.0-31 1.5-8 3 2 1-10 4 CAREER HIGHS Tackles: 13, three times TFL: 2.0 vs. Western Carolina, Sept. 1, 2011 Sacks: 1.0 at Virginia, Oct. 15, 2011 FC: 1, three times FR: 1 vs. Miami, Nov. 13, 2010; 1 vs. Clemson, Oct. 29, 2011 Interceptions: 1 vs. Middle Tennessee State, Oct. 16, 2010 PB: 1, four times -----------------------------------------------------------------------MORGAN CARTER Year G-GS P-A Tkl TFL Sck FC FR Int PB 2011 8-0 1-0 1 0 0 0 0 0 0
IZAAN CROSS Year G-GS P-A Tkl TFL 2011 12-12 14-16 30 1.0-2 2010 13-13 22-19 41 6.5-22 2009 13-2 5-5 10 2.5-3 TOTAL 38-27 41-40 82 10.0-27
Sck 0 2.5-14 0 2.5-14
FC 1 1 0 2
FR Int 0 0 0 0 1-0 0 1-0 0
PB 4 4 0 8
CAREER HIGHS Tackles: 7 at Kansas, Sept. 11, 2010 TFL: 2.0 vs. South Carolina State, Sept. 4, 2010 Sacks: 1.0 at North Carolina, Sept. 18, 2010; 1.0 vs. NC State, Sept. 25, 2010 FC: 1 at North Carolina, Sept. 18, 2010; 1 at Middle Tennessee State, Sept. 10, 2011 FR: 1 at Vanderbilt, Oct. 31, 2009 PB: 2 at Wake Forest, Oct. 2, 2010; 2 at Middle Tennessee State, Sept. 10, 2011 -----------------------------------------------------------------------EUCLID CUMMINGS Year G-GS P-A Tkl TFL Sck FC FR Int PB 2011 12-0 10-11 21 2.0-2 0 0 0 0 1 2010 3-0 0-2 2 0 0 0 0 0 0 TOTAL 15-0 10-13 23 2.0-2 0 0 0 0 1 CAREER HIGHS Tackles: 4 at Miami, Oct. 22, 2011 TFL: 1.0 at Miami, Oct. 22, 2011 PB: 1 vs. Maryland, Oct. 8, 2011 -----------------------------------------------------------------------SYNJYN DAYS Passing G-GS Eff Com-Att Int Pct Yds TD LP PG 2011 6-0 205.3 8-12 0 66.7 198 0 66 33.0 Rushing G-GS Att Yds Avg TD LP Ply TO 2011 6-0 48 237 4.9 4 30 60 435
PG TDR 72.5 4
CAREER HIGHS Pass Attempts: 5 vs. Georgia, Nov. 26, 2011 Pass Completions: 3 vs. Western Carolina, Sept. 1, 2011; 3 vs. vs. Georgia, Nov. 26, 2011 Yards Passing: 94 vs. Western Carolina, Sept. 1, 2011 TD Passing: None Long Pass: 66 vs. Western Carolina, Sept. 1, 2011 Rushing Attempts: 15 at Middle Tennessee State, Sept. 10, 2011 Yards Rushing: 91 at Middle Tennessee State, Sept. 10, 2011 TD Rushing: 2 at Middle Tennessee State, Sept. 10, 2011 Long Rush: 30 vs. Kansas, Sept. 17, 2011 Total Offense Yards: 149 vs. Western Carolina, Sept. 1, 2011 -----------------------------------------------------------------------CORREY DENNIS Year G-GS P-A Tkl TFL Sck FC FR Int PB 2011 12-0 5-2 7 0 0 0 0 0 0 Returns 2011
KOR Yds 0 0
Avg TD LP 0.0 0 0
PR Yds Avg 1 7 7.0
TD 0
LP 7
CAREER HIGHS Tackles: 2 at Middle Tennessee State, Sept. 10, 2011 Punt Returns: 1 vs. North Carolina, Sept. 17, 2011 Punt Return Yards: 7 vs. North Carolina, Sept. 17, 2011 Long Punt Return: 7 vs. North Carolina, Sept. 17, 2011 -----------------------------------------------------------------------EMMANUEL DIEKE Year G-GS P-A Tkl TFL Sck FC FR Int PB 2011 12-0 11-7 16 2.0-6 2.0-6 0 0 0 0 2010 9-0 0-0 0 0 0 0 0 0 0 TOTAL 20-0 11-5 16 2.0-6 2.0-6 0 0 0 0 CAREER HIGHS Tackles: 3, three times TFL: 1.0 vs. North Carolina, Sept. 24, 2011; 1.0 vs. Clemson, Oct. 29, 2011 Sacks: 1.0 vs. North Carolina, Sept. 24, 2011; 1.0 vs. Clemson, Oct. 29, 2011 -----------------------------------------------------------------------DANIEL DRUMMOND Year G-GS P-A Tkl TFL Sck FC FR Int PB 2011 10-5 14-18 32 0 0 1 0 0 1
CAREER HIGHS Tackles: 1 vs. Clemson, Oct. 29, 2011 -----------------------------------------------------------------------CHRISTOPHER CRENSHAW Year G-GS P-A Tkl TFL Sck FC FR Int PB 2011 8-2 4-6 10 1.0-7 1.0-7 0 0 0 0 2010 0-0 0-0 0 0 0 0 0 0 0 TOTAL 8-2 4-6 10 1.0-7 1.0-7 0 0 0 0
CAREER HIGHS Tackles: 8 at NC State, Oct. 1, 2011 FC: 1 vs. Western Carolina, Sept. 1, 2011 PB: 1 vs. Kansas, Sept. 17, 2011 -----------------------------------------------------------------------JAMAL GOLDEN Year G-GS P-A Tkl TFL Sck FC FR Int PB 2011 10-0 5-2 7 0 0 0 0 0 1
CAREER HIGHS Tackles: 3 vs. Maryland, Oct. 8, 2011 TFL: 1.0 vs. Western Carolina, Sept. 1, 2011 Sacks: 1.0 vs. Western Carolina, Sept. 1, 2011 ------------------------------------------------------------------------
CAREER HIGHS Tackles: 2 at NC State, Oct. 1, 2011 PB: 1 vs. Kansas, Sept. 17, 2011 ------------------------------------------------------------------------
2011 GEORGIA TECH FOOTBALL
JEFF GREENE Year GP-GS Rec Yds Avg TD LP Rush Yds Avg TD LP 2011 11-0 0 0 0.0 0 0 0 0 0.0 0 0 CAREER HIGHS Receptions: None Receiving Yards: None Receiving Touchdowns: None Longest Reception: None -----------------------------------------------------------------------STEPHEN HILL Year GP-GS Rec Yds Avg TD LP Rush Yds Avg TD 2011 12-12 26 785 30.2 4 82 3 27 9.0 0 2010 12-9 15 291 19.4 3 79 3 34 11.3 0 2009 13-1 6 137 22.8 1 53 5 84 16.8 1 TOTAL 37-22 47 1,213 25.8 8 82 11 145 13.2 1 Returns 2011
LP 24 16 26 26
KOR Yds Avg TD LP 1 28 28.0 0 28
CAREER HIGHS Receptions: 6 vs. North Carolina, Sept. 24, 2011 Receiving Yards: 181 vs. Western Carolina, Sept. 1, 2011 Receiving Touchdowns: 2 vs. Western Carolina, Sept. 1, 2011 Longest Reception: 82 vs. Western Carolina, Sept. 1, 2011 Rushing Attempts: 1, 11 times Rushing Yards: 26 vs. Georgia, Nov. 28, 2009 Rushing Touchdowns: 1 at Mississippi State, Oct. 3, 2009 Longest Rush: 26 vs. Georgia, Nov. 28, 2009 Kick Returns: 1 vs. North Carolina, Sept. 24, 2011 Kick Return Yards: 28 vs. North Carolina, Sept. 24, 2011 Long Kick Return: 28 vs. North Carolina, Sept. 24, 2011 All Purpose Yards: 181 vs. Western Carolina, Sept. 1, 2011 -----------------------------------------------------------------------FRED HOLTON Year G-GS P-A Tkl TFL Sck FC FR Int PB 2011 --INJURED-2010 13-0 6-5 11 0 0 1 0 0 0 TOTAL 13-0 6-5 11 0 0 1 0 0 0 CAREER HIGHS Tackles: 2, three times FC: 1 at Georgia, Nov. 27, 2010 -----------------------------------------------------------------------ISAIAH JOHNSON Year G-GS P-A Tkl TFL Sck FC FR Int PB 2011 12-12 44-25 69 1.5-5 0 0 2 3-34 3 2010 13-3 28-18 46 3.0-17 1.0-10 1 2 1-18 1 TOTAL 25-15 72-43 115 4.5-22 1.0-10 1 4 4-52 4 CAREER HIGHS Tackles: 9 at Kansas, Sept. 11, 2010 TFL: 1.0, four times Sacks: 1 at Kansas, Sept. 11, 2010 FC: 1 vs. South Carolina State, Sept. 4, 2010 FR: 1, four times Interceptions: 1, four times Interception Return: 34 at NC State, Oct. 1, 2011 PB: 1, four times -----------------------------------------------------------------------RODDY JONES Year GP-S Rush Yds Avg TD LP Rec Yds Avg TD 2011 12-12 52 438 8.4 3 48 5 122 24.4 3 2010 13-13 52 353 6.8 4 31 7 119 17.0 1 2009 13-13 53 345 6.5 3 23 0 0 0.0 0 2008 13-13 81 690 8.5 4 62 8 155 19.4 1 TOTAL 51-50 238 1,826 7.7 14 62 20 396 19.8 5 Returns KOR Yds Avg TD 2011 1 17 17.0 0 2009 0 0 0.0 0 2008 15 354 23.6 0 TOTAL 16 371 23.2 0
LP PR Yds Avg 17 0 0 0.0 0 0 0 0.0 46 6 53 8.8 46 6 53 8.8
LP 52 41 0 41 52
TD LP 0 0 0 0 0 29 0 29
CAREER HIGHS Rushing Attempts: 13 at Georgia, Nov. 29, 2008 Rushing Yards: 214 at Georgia, Nov. 29, 2008 Rushing Touchdowns: 2 at Georgia, Nov. 29, 2008; 2 vs. South Carolina State, Sept. 4, 2010 Receptions: 2, four times Receiving Yards: 64 at North Carolina, Sept. 18, 2010 Receiving Touchdowns: 1, five times Longest Rush: 62 at Georgia, Nov. 29, 2008 Longest Reception: 52 vs. Kansas, Sept. 17, 2011 Kick Returns: 4 at Georgia, Nov. 29, 2008 Kick Return Yards: 98 at Georgia, Nov. 29, 2008 Long Kick Return: 46 vs. Florida State, Nov. 1, 2008 Punt Returns: 4 at North Carolina, Nov. 8, 2008 Punt Return Yards: 29 vs. Virginia, Oct. 25, 2008 Long Punt Return: 29 vs. Virginia, Oct. 25, 2008 All Purpose Yards: 312 at Georgia, Nov. 29, 2008 ------------------------------------------------------------------------
RAMBLINWRECK.COM
ZACH LASKEY Returns KOR Yds Avg TD LP 2011 1 6 6.0 0 6
PR 11
Yds 94
Avg 8.5
TD 0
LP 28
Kickoff Returns: 1 at NC State, Oct. 1, 2011 Kickoff Return Yards: 6 at NC State, Oct. 1, 2011 Long Kickoff Return: 6 at NC State, Oct. 1, 2011 Punt Returns: 4 vs. Kansas, Sept. 17, 2011 Punt Return Yards: 31 vs. Western Carolina, Sept. 1, 2011 Long Punt Return: 28 vs. Western Carolina, Sept. 1, 2011 -----------------------------------------------------------------------PRESTON LYONS Year GP-S Rush Yds Avg TD LP Rec Yds Avg TD LP 2011 10-0 39 202 5.2 1 36 0 0 0.0 0 0 2010 9-0 14 60 4.3 0 15 2 43 21.5 0 38 2009 13-0 30 139 4.6 1 31 0 0 0.0 0 0 TOTAL 32-0 83 401 4.8 2 36 2 43 21.5 0 38 CAREER HIGHS Rushing Attempts: 9 vs. Clemson, Oct. 29, 2011 Rushing Yards: 42 vs. Clemson, Oct. 29, 2011 Rushing Touchdowns: 1 vs. Wake Forest, Nov. 7, 2009; 1 vs. Western Carolina, Sept. 1, 2011 Longest Rush: 36 vs. Kansas, Sept. 17, 2011 Pass Receptions: 1 at Wake Forest, Oct. 2, 2010; 1 vs. Miami, Nov. 13, 2010 Receiving Yards: 38 at Wake Forest, Oct. 2, 2010 Longest Reception: 38 at Wake Forest, Oct. 2, 2010 -----------------------------------------------------------------------B.J. MACHEN Year G-GS P-A Tkl TFL Sck FC FR Int PB 2011 12-0 7-6 13 0 0 0 0 1-15 0 2010 0-0 0-0 0 0 0 0 0 0 0 2009 13-0 7-1 8 0 0 0 0 0 0 TOTAL 25-0 14-7 21 0 0 0 0 1-15 0 CAREER HIGHS Tackles: 5 at NC State, Oct. 1, 2011 Interceptions: 1 vs. Western Carolina, Sept. 1, 2011 -----------------------------------------------------------------------DANIEL McKAYHAN Year GP-S Rush Yds Avg TD LP Rec Yds Avg TD 2011 12-0 0 0 0.0 0 0 0 0 0.0 0 2010 10-0 0 0 0.0 0 0 2 29 14.5 0 2009 8-0 0 0 0.0 0 0 1 18 18.0 0 TOTAL 29-0 0 0 0.0 0 0 3 47 15.7 0
LP 0 16 18 18
Returns 2011 2010 2009 TOTAL
LP 0 11 0 11
KOR Yds 0 0 6 138 3 75 9 213
Avg TD LP 0.0 0 0 23.0 0 34 25.4 0 41 23.7 0 41
PR Yds Avg TD 0 0 0.0 0 3 3 1.0 0 0 0 0.0 0 3 3 1.0 0
CAREER HIGHS Receptions: 1, three times Receiving Yards: 18 at Duke, Nov. 13, 2009 Longest Reception: 18 at Duke, Nov. 13, 2009 Kick Returns: 6 vs. NC State, Sept. 25, 2010 Kick Return Yards: 138 vs. NC State, Sept. 25, 2010 Long Kick Return: 34 vs. NC State, Sept. 25, 2010 Punt Returns: 2 vs. Air Force, Dec. 27, 2010 Punt Return Yards: 11 vs. South Carolina State, Sept. 4, 2010 -----------------------------------------------------------------------TYLER MELTON Year GP-GS Rush Yds Avg TD LP Rec Yds Avg TD LP 2011 12-12 1 4 4.0 0 4 14 244 17.4 0 66 2010 12-5 0 0 0.0 0 0 6 99 16.5 1 42 2009 10-10 0 0 0.0 0 0 5 46 9.2 0 13 2008 10-7 0 0 0.0 0 0 5 53 10.6 0 25 TOTAL 44-34 1 4 4.0 0 4 30 442 14.7 1 66 Returns 2008
KOR Yds 4 72
Avg TD LP 18.0 0 19
PR Yds Avg TD 15 86 5.7 0
LP 16
CAREER HIGHS Receptions: 3 at Duke, Nov. 19, 2011 Yards Receiving: 66 vs. Western Carolina, Sept. 1, 2011 Long Reception: 66 vs. Western Carolina, Sept. 1, 2011 Receiving Touchdowns: 1 vs. NC State, Sept. 25, 2010 Rushing Attempts: 1 at Virginia, Oct. 15, 2011 Rushing Yards: 4 at Virginia, Oct. 15, 2011 Kick Returns: 1, four times Kick Return Yards: 19 at Virginia Tech, Sept. 13, 2008 Longest Kick Return: 19 at Virginia Tech, Sept. 13, 2008 Punt Returns: 6 vs. Gardner-Webb, Oct. 11, 2009 Punt Return Yards: 53 vs. Gardner-Webb, Oct. 11, 2009 Longest Punt Return: 16 vs. Gardner-Webb, Oct. 11, 2009 All-Purpose Yards: 71 vs. Gardner-Webb, Oct. 11, 2009 -----------------------------------------------------------------------NICK MENOCAL Year G-GS P-A Tkl TFL Sck FC FR Int PB 2011 9-0 2-2 4 1.5-9 1.0-9 0 0 0 0
JUSTIN MOORE Year XP-A FG-A Pct 1-19 20-29 30-39 40-49 50+ Lg Blk 2011 53-53 9-13 .692 0-0 4-4 2-4 3-4 0-1 41 2 CAREER HIGHS PATs: 9 vs. Western Carolina, Sept. 1, 2011; 9 vs. Kansas, Sept. 17, 2011 Points: 12 vs. Kansas, Sept. 17, 2011 Field Goals: 2 vs. North Carolina, Sept. 24, 2011; 2 vs. Virginia Tech, Nov. 10, 2011 Field Goal Attempts: 3 vs. North Carolina, Sept. 24, 2011 Longest Field Goal: 41 vs. Virginia Tech, Nov. 10, 2011 Longest Field Goal Attempt: 52 vs. Virginia, Oct. 15, 2011 -----------------------------------------------------------------------MALCOLM MUNROE Year G-GS P-A Tkl TFL Sck FC FR Int PB 2011 12-1 8-0 8 1.0-10 1.0-10 0 0 0 0 2010 4-0 0-0 0 0 0 0 0 0 0 2009 12-0 2-3 5 0 0 1 0 0 0 TOTAL 28-0 10-3 13 1.0-10 1.0-10 1 0 0 0 CAREER HIGHS Tackles: 3 vs. Jacksonville State, Sept. 5, 2009; 3 at NC State, Oct. 1, 2011 Sacks: 1 at NC State, Oct. 1, 2011 TFL: 1 at NC State, Oct. 1, 2011 FF: 1 at Virginia, Oct. 24, 2009 -----------------------------------------------------------------------QUAYSHAWN NEALY Year G-GS P-A Tkl TFL Sck FC FR Int PB 2011 12-7 22-25 47 3.0-4 0 0 1-0 1-10 2 CAREER HIGHS Tackles: 10 at Virginia, Oct. 15, 2011 TFL: 1.0 at Duke, Nov. 19, 2011 FR: 1 vs. Western Carolina, Sept. 1, 2011 PB: 1 vs. Kansas, Sept. 17, 2011; 1 vs. Clemson, Oct. 29, 2011 INT: 1 vs. Maryland, Oct. 8, 2011 -----------------------------------------------------------------------EMBRY PEEPLES Year GP-S Rush Yds Avg TD LP Rec Yds Avg TD 2011 12-2 38 422 11.1 2 63 5 85 17.0 0 2010 13-4 46 287 6.2 1 19 2 66 33.0 1 2009 13-1 31 170 5.5 0 19 8 244 30.5 1 2008 8-0 14 97 6.9 1 15 0 0 0 0 TOTAL 46-7 129 976 7.6 4 63 15 395 26.3 2 Kick Returns 2011 2010 2009 2008 TOTAL
Att 6 10 11 0 27
Yds 109 223 183 0 515
Avg 18.2 22.3 16.6 0.0 19.1
TD 0 0 0 0 0
LP 46 46 87 0 87
LP 29 42 33 0 42
CAREER HIGHS Rushing Attempts: 7 at Duke, Nov. 19, 2011 Yards Rushing: 110 vs. Kansas, Sept. 17, 2011 Longest Rush: 63 vs. Kansas, Sept. 17, 2011 Rushing Touchdowns: 1, four times Receptions: 2 at Vanderbilt, Oct. 31, 2009; 2 vs. Clemson, Dec. 5, 2009 Receiving Yards: 117 at Vanderbilt, Oct. 31, 2009 Longest Reception: 87 (td) at Vanderbilt, Oct. 31, 2009 Receiving Touchdowns: 1 at Vanderbilt, Oct. 31, 2009; 1 at Wake Forest, Oct. 2, 2010 Kick Returns: 5 at Duke, Nov. 19, 2011 Kick Return Yards: 80 at Duke, Nov. 19, 2011 Long Return: 42 at Virginia Tech, Nov. 4, 2010 All-Purpose Yards: 196 at Vanderbilt, Oct. 31, 2009 -----------------------------------------------------------------------CHARLES PERKINS Year G-GS Rush Yds Avg TD LP Rec Yds Avg TD LP 2011 11-0 27 96 3.6 1 14 2 38 19.0 0 29 Returns 2011
KOR 2
Yds 39
Avg 19.5
TD 0
LP 24
CAREER HIGHS Rushing Attempts: 12 at Duke, Nov. 19, 2011 Yards Rushing: 45 at Duke, Nov. 19, 2011 Longest Rush: 14 at Middle Tennessee State, Sept. 10, 2011 Rushing Touchdowns: 1 vs. Kansas, Sept. 17, 2011 Receptions: 1 vs. Western Carolina, Sept. 1, 2011; 1 at Duke, Nov. 19, 2011 Receiving Yards: 29 at Duke, Nov. 19, 2011 Longest Reception: 29 at Duke, Nov. 19, 2011 All-Purpose Yards: 29 at Duke, Nov. 19, 2011 Kickoff Returns: 1 at NC State, Oct. 1, 2011; 1 at Virginia, Oct. 15, 2011 Kick Return Yards: 24 at Virginia, Oct. 15, 2011 Long Return: 24 at Virginia, Oct. 15, 2011 ------------------------------------------------------------------------
JASON PETERS Year G-GS P-A 2011 12-12 16-24 2010 13-13 24-28 2009 13-4 5-6 2008 10-0 4-1 TOTAL 48-29 49-59
Tkl TFL 40 2.5-8 52 5.0-20 11 1.0-2 5 3.0-18 108 11.5-48
Sck 2.0-7 1.5-10 0-0 2.0-17 5.5-34
FC 0 0 0 1 1
FR Int 1-0 0 0 0 1-0 1-0 0 0 2-0 1-0
PB 2 0 2 0 4
CAREER HIGHS Tackles: 11 vs. Air Force, Dec. 27, 2010 TFL: 2.0 vs. Mississippi St., Sept. 20, 2008; 2.0 vs. Miami, Nov. 13, 2010 Sacks: 2.0 vs. Mississippi St., Sept. 20, 2008 FC: 1 vs. Mississippi St., Sept. 20, 2008 FR: 1 at Florida State, Oct. 10, 2009; 1 at Middle Tennessee State, Sept. 10, 2011 INT: 1 vs. Virginia Tech, Oct. 17, 2009 PB: 1, four times -----------------------------------------------------------------------MICHAEL PETERSON Year G-GS P-A Tkl TFL Sck FC FR Int PB 2011 11-1 5-3 8 0.5-5 0 0 0 0 0 2010 12-0 2-4 6 0 0 0 0 0 1 2009 14-2 6-3 9 0 0 0 0 0 0 2008 12-0 12-4 16 1.0-3 0 0 0 0 1 TOTAL 49-4 25-14 39 1.5-8 0 0 0 0 2 CAREER HIGHS Tackles: 6 vs. Florida State, Nov. 1, 2008 TFL: 1.0 vs. Florida State, Nov. 1, 2008 PB: 1 vs. Florida State, Nov. 1, 2008; 1 vs. South Carolina State, Sept. 4, 2010 -----------------------------------------------------------------------SEAN POOLE Year G Punts Yds Avg Net 50+ I-20 Ret Long 2011 12 31 1,201 38.7 36.8 3 5 11-41 55 2010 8 27 1,062 39.3 33.5 5 8 12-117 55 TOTAL 20 58 2,263 39.0 35.2 8 13 23-158 55 CAREER HIGHS Longest Punt: 55 vs. Middle Tennessee State, Oct. 16, 2010; 55 at Middle Tennessee State, Sept. 10, 2011 Punt Attempts: 5 at Wake Forest, Oct. 2, 2010; 5 vs. Middle Tennessee State, Oct. 16, 2010 Highest Punt Average (min. 2 atts.): 47.7 (3 attempts) at Clemson, Oct. 23, 2010 Inside-20: 4 vs. Middle Tennessee State, Oct. 16, 2010 -----------------------------------------------------------------------RASHAAD REID Year G-GS P-A Tkl TFL Sck FC FR Int PB 2011 12-12 21-29 50 1.5-9 0 1 0 0 2 2010 13-1 11-1 12 0 0 0 0 0 0 2009 14-6 7-5 12 1.5-4 0 0 0 0 2 2008 13-8 29-16 45 3.0-7 0 0 1-0 3-23 2 TOTAL 52-27 68-51 119 6.0-20 0 1 1-0 3-23 5 CAREER HIGHS Tackles: 7 vs. Virginia, Oct. 25, 2008; 7 at Virginia, Oct. 15, 2011 TFL: 1.0, five times INTs: 1, three times FC: 1 at Middle Tennessee State, Sept. 10, 2011 FR: 1 vs. Florida State. Nov. 1, 2008 PB: 2 vs. Miami, Nov. 20, 2008 Longest INT Return: 14 at Boston College, Sept. 6, 2008 -----------------------------------------------------------------------LANCE RICHARDSON Year G-GS P-A Tkl TFL Sck FC FR Int PB 2011 4-0 2-0 2 0 0 0 0 0 1 CAREER HIGHS Tackles: 1 vs. Western Carolina, Sept. 1, 2011; 1 at Middle Tennessee State, Sept. 10, 2011 PB: 1 vs. Kansas, Sept. 17, 2011 -----------------------------------------------------------------------DAVID SIMS Year G-GS Rush Yds Avg TD LP Rec Yds Avg TD LP 2011 12-10 135 698 5.2 7 41 3 29 9.7 1 12 2010 5-0 7 58 8.3 1 20 0 0 0 0 0 TOTAL 17-10 142 756 5.3 8 41 3 29 9.7 1 12 CAREER HIGHS Rushing Attempts: 15 vs. Clemson, Oct. 29, 2011 Yards Rushing: 91 at Middle Tennessee State, Sept. 10, 2011 TD Rushing: 2 vs. Kansas, Sept. 17, 2011; 2 at Duke, Nov. 19, 2011 Long Rush: 41 at NC State, Oct. 1, 2011 Receptions: 1, three times Receiving Yards: 12 at Miami, Oct. 22, 2011 Receiving TDs: 1 at NC State, Oct. 1, 2011 All-Purpose Yards: 91 at Middle Tennessee State, Sept. 10, 2011 ------------------------------------------------------------------------
CAREER HIGHS Tackles: 2 vs. Western Carolina, Sept. 1, 2011 Sacks: 1.0 vs. Maryland, Oct. 8, 2011 Tackles for Loss: 1.0 vs. Maryland, Oct. 8, 2011 ------------------------------------------------------------------------
2011 GEORGIA TECH FOOTBALL
RAMBLINWRECK.COM
ORWIN SMITH Year GP Rush Yds Avg TD LP Rec Yds Avg TD LP 2011 11-10 60 616 10.3 11 95 13 306 23.5 1 67 2010 13-6 53 516 9.7 4 73 12 195 16.2 0 41 2009 14-0 5 26 5.2 0 12 2 26 13.0 0 21 TOTAL 38-16 118 1,158 9.8 15 95 27 527 19.5 1 67 Kick Returns 2011 2010 2009 TOTAL
Att Yds 18 352 7 117 37 888 62 1,357
Avg 19.6 16.7 24.0 21.9
TD 0 0 0 0
LP 29 23 83 83
CAREER HIGHS Rushing Attempts: 12 vs. Miami, Nov. 13, 2010 Yards Rushing: 157 vs. Kansas, Sept. 17, 2011 Long Rush: 95 vs. Kansas, Sept. 17, 2011 TDs Rushing: 3 at NC State, Oct. 1, 2011 Receptions: 3 at Miami, Oct. 22, 2011 Yards Receiving: 108 vs. Kansas, Sept. 17, 2011 Longest Reception: 67 vs. Kansas, Sept. 17, 2011 Kick Return Yards: 139 at Duke, Nov. 14, 2009 Long Return: 83 at Duke, Nov. 14, 2009 All-Purpose Yards: 314 vs. Kansas, Sept. 17, 2011 -----------------------------------------------------------------------ROD SWEETING Year G-GS P-A Tkl TFL Sck FC FR Int PB 2011 12-12 36-19 55 3.0-7 0 2 1 3-30 9 2010 13-0 27-11 38 1.0-1 0 0 1 1-7 7 2009 14-0 7-1 8 0 0 0 0 0 0 TOTAL 39-12 70-31 101 4.0-8 0 2 2 4-37 16 CAREER HIGHS Tackles: 8 vs. Duke, Nov. 20, 2010; 8 vs. Virginia Tech, Nov. 10, 2011 TFL: 1.0, three times FC: 1 at Duke, Nov. 19, 2011; 1 vs. Georgia, Nov. 26, 2011 FR: 1 at North Carolina, Sept. 18, 2010; 1 vs. Clemson, Oct. 29, 2011 Interceptions: 1, four times Interception Return: 32 at Virginia, Oct. 15, 2011 PB: 2, five times -----------------------------------------------------------------------STEVEN SYLVESTER Year G-GS P-A Tkl TFL Sck FC FR Int PB 2011 12-9 19-19 38 4.0-18 1.0-7 1 0 0 1 2010 13-13 29-31 60 10.5-33 3.0-13 3 1 0 1 2009 14-9 23-17 40 4.0-22 3.0-19 0 1 0 0 2008 12-0 8-3 11 0 0 0 0 0 0 TOTAL 51-31 79-70 149 18.5-73 7.0-39 4 2 0 2
LOGAN WALLS Year G-GS P-A Tkl 2011 12-12 14-23 37 2010 13-12 2-21 23 2009 14-11 10-15 25 2008 3-0 0-1 1 TOTAL 41-34 26-60 86
TFL 2.0-2 0 3.0-11 0 5.0-13
Sck 0 0 2.0-8 0 2.0-8
FC 0 0 1 0 1
FR Int PB 0 0 0 1 0 1 0 0 0 0 0 0 1 0 1
CAREER HIGHS Tackles: 7 vs. Western Carolina, Sept. 1, 2011 TFL: 1.0, three times Sacks: 1.0 at Virginia, Oct. 24, 2009; 1.0 vs. Georgia, Nov. 28, 2009 FC: 1 at Vanderbilt, Oct. 31, 2009 FR: 1 vs. NC State, Sept. 25, 2010 PB: 1 vs. Air Force, Dec. 27, 2010 -----------------------------------------------------------------------TEVIN WASHINGTON Passing G-GS Eff Com-Att Int Pct Yds TD LP PG 2011 12-12 153.53 63-135 8 46.7 1,515 10 82 126.2 2010 8-4 99.39 25-61 3 41.0 417 2 79 52.1 2009 1-0 276.40 1-1 0 100.0 21 0 21 21.0 TOTAL 21-16 137.40 89-197 11 45.2 1,953 12 82 93.0 Rushing G-GS Att Yds Avg TD LP Ply TO PG TDR 2011 12-12 222 890 4.0 14 56 357 2,405 200.4 24 2010 8-4 116 514 4.4 4 29 177 931 116.4 6 2009 1-0 6 40 6.7 0 17 7 61 61.0 0 TOTAL 21-16 344 1,444 4.2 18 56 541 3,397 161.8 30
KOR 1
Yds Avg 2 2.0
TD LP PR Yds Avg 0 2 0 0 0
CAREER HIGHS PATs: 7 at Florida State, Oct. 10, 2010 Points Scored: 7 at Florida State, Oct. 10, 2010 -----------------------------------------------------------------------JEMEA THOMAS Year G-GS P-A Tkl TFL Sck FC FR Int PB 2011 12-1 29-13 42 3.0-12 1.0-6 1 0 3-9 4 2010 --REDSHIRTED-2009 14-0 5-5 10 0 0 0 1-0 0 1 TOTAL 26-1 34-18 52 3.0-12 1.0-6 1 1-0 3-9 5
CAREER HIGHS Tackles: 6 at North Carolina, Sept. 18, 2010; 6 vs. NC State, Sept. 25, 2010 TFL: 1.0 vs. South Carolina State, Sept. 4, 2010; 1.0 vs. Western Carolina, Sept. 1, 2011 Sacks: 1.0 vs. Western Carolina, Sept. 1, 2011; 1.0 at NC State, Oct. 1, 2011 FC: 1 vs. Western Carolina, Sept. 1, 2011 PB: 1 at Virginia, Oct. 15, 2011 -----------------------------------------------------------------------LOUIS YOUNG Year G-GS P-A Tkl TFL Sck FC FR Int PB 2011 12-12 24-28 52 3.0-9 0 1 0 1-12 5 2010 12-0 3-7 10 0 0 0 0 0 0 TOTAL 24-12 27-35 62 3.0-9 0 1 0 1-12 5
TD 0
LP 16
PR Yds 2 21
Avg 10.5
TD LP 0 14
CAREER HIGHS Tackles: 6 at Duke, Nov. 19, 2011 TFL: 1.0, three times Sacks: 1.0 vs. North Carolina, Sept. 24, 2011 FC: 1 vs. Clemson, Oct. 29, 2011 FR: 1 vs. Jacksonville State, Sept. 5, 2009 PB: 2 vs. Clemson, Oct. 29, 2011 INTS: 2 vs. Clemson, Oct, 29,2011 Kick Returns: 1 at NC State, Oct. 1, 2011 Kick Return Yards: 16 at NC State, Oct. 1, 2011 Long Kick Return: 16 at NC State, Oct. 1, 2011 Punt Returns: 1 vs. Clemson, Oct. 29, 2011; 1 at Duke, Nov. 19, 2011 Punt Return Yards: 14 at Duke, Nov. 19, 2011 Long Punt Return: 14 at Duke, Nov. 19, 2011 All-Purpose Yards: 43 at NC State, Oct. 1, 2011 ------------------------------------------------------------------------
2011 GEORGIA TECH FOOTBALL
KOR Yds Avg 9 202 22.4
TD 0
LP 79
PR Yds 0 0
Avg 0.0
TD LP 0 0
CAREER HIGHS Rushing Attempts: 6 at Middle Tennessee State, Sept. 10, 2011 Rushing Yards: 47 at Middle Tennessee State, Sept. 10, 2011 Rushing Touchdowns: None Receptions: 2 at Middle Tennessee State, Sept. 10, 2011 Receiving Yards: 85 at Middle Tennessee State, Sept. 10, 2011 Receiving Touchdowns: 1 at Middle Tennessee State, Sept. 10, 2011 Longest Rush: 19 at Middle Tennessee State, Sept. 10, 2011 Longest Reception: 73 at Middle Tennessee State, Sept. 10, 2011 Kick Returns: 3 vs. Maryland, Oct. 8, 2011 Kick Return Yards: 115 vs. Maryland, Oct. 8, 2011 Long Kick Return: 79 vs. Maryland, Oct. 8, 2011 Punt Returns: None Punt Return Yards: None Long Punt Return: None All Purpose Yards: 127 vs. Maryland, Oct. 8, 2011
TD LP 0 0
2011
KOR Yds Avg 1 16 16.0
Returns 2011
CAREER HIGHS Pass Attempts: 19 vs. Maryland, Oct. 8, 2011 Pass Completions: 10 vs. North Carolina, Sept. 24, 2011 Yards Passing: 271 vs. Western Carolina, Sept. 1, 2011 Passing Touchdowns: 3 vs. Western Carolina, Sept. 1, 2011 Long Pass: 82 (to Stephen Hill) vs. Western Carolina, Sept. 1, 2011 Rushing Attempts: 32 vs. Maryland, Oct. 8, 2011 Yards Rushing: 176 vs. Clemson, Oct. 29, 2011 TD Rushing: 3 vs. Virginia Tech, Nov. 10, 2011 Long Rush: 56 vs. Clemson, Oct. 29, 2011 Total Offense Yards: 321 at Duke, Nov. 19, 2011 -----------------------------------------------------------------------RICHARD WATSON Year GP-GS Rush Yds Avg TD LP Rec Yds Avg TD LP 2011 11-0 3 30 10.0 0 28 0 0 0.0 0 0 2010 13-0 10 32 3.2 0 7 0 0 0.0 0 0 2009 6-0 9 37 4.1 1 9 0 0 0.0 0 0 TOTAL 28-0 22 99 4.5 1 28 0 0 0.0 0 0
CAREER HIGHS Tackles: 10 at Wake Forest, Oct. 2, 2010 TFL: 3.0 at Wake Forest, Oct. 2, 2010 Sacks: 2.0 at Kansas, Sept. 11, 2010 FC: 1, four times FR: 1 vs. Georgia, Nov. 28, 2009; 1 vs. Middle Tennessee State, Oct. 16, 2010 PB: 1 at Kansas, Sept. 11, 2010; 1 at Miami, Oct. 22, 2011 -----------------------------------------------------------------------CHRIS TANNER Year XP-A FG-A Pct 1-19 20-29 30-39 40-49 50+ Lg Blk 2011 0-0 0-0 .000 0-0 0-0 0-0 0-0 0 0 0 2010 0-0 0-0 .000 0-0 0-0 0-0 0-0 0 0 0 2009 14-14 0-0 .000 0-0 0-0 0-0 0-0 0 0 0 TOTAL 14-14 0-0 .000 0-0 0-0 0-0 0-0 0 0 0
Returns 2011
TONY ZENON Year GP-S Rush Yds Avg TD LP Rec Yds Avg TD LP 2011 8-1 15 86 5.7 0 19 3 104 34.7 1 73
CAREER HIGHS Rushing Attempts: 4 vs. Jacksonville State, Sept. 5, 2009 Rushing Yards: 30 vs. Western Carolina, Sept. 1, 2011 Touchdowns: 1 at Duke, Nov. 14, 2009 Longest Rush: 28 vs. Western Carolina, Sept. 1, 2011 Kick Returns: 1 at Duke, Nov. 19, 2011 Kick Return Yards: 2 at Duke, Nov. 19, 2011 -----------------------------------------------------------------------BRANDON WATTS Year G-GS P-A Tkl TFL Sck FC FR Int PB 2011 11-1 6-9 15 3.0-14 3.0-14 1 0 0 1 2010 12-3 12-9 21 1.0-2 0 0 0 0 0 TOTAL 23-4 18-18 36 4.0-16 3.0-14 1 0 0 1
CAREER HIGHS Tackles: 7 at Duke, Nov. 19, 2011 TFL: 1.0 at NC State, Oct. 1, 2011; 1.0 at Miami, Oct. 22, 2011 PB: 2 at Miami, Oct. 22, 2011 FF: 1 vs. Clemson, Oct. 29, 2011 INT: 1 vs. Georgia, Nov. 26, 2011 ------------------------------------------------------------------------
RAMBLINWRECK.COM
2011 GEORGIA TECH STATISTICS 2011 RESULTS Date Opponent Sep 01 WESTERN CAROLINA Sep 10 at Middle Tennessee Sep 17 KANSAS *Sep 24 rv/25 NORTH CAROLINA *Oct 01 at NC State *Oct 08 MARYLAND *Oct 15 at Virginia *Oct 22 at Miami *Oct 29 6/6 CLEMSON *Nov 10 10/9 VIRGINIA TECH (Th) *Nov 19 at Duke Nov 26 13/14 GEORGIA * indicates conference game
Score 63-21 49-21 66-24 35-28 45-35 21-16 21-24 7-24 31-17 26-37 38-31 17-31
W W W W W W L L W L W L
RUSHING Tevin Washington David Sims Orwin Smith Roddy Jones Embry Peeples Synjyn Days Preston Lyons Charles Perkins Tony Zenon Richard Watson Jemea Thomas Stephen Hill Robert Godhigh Matt Connors Darryl Dickey Deon Hill Tyler Melton TEAM Total.......... Opponents......
GP 12 12 11 12 12 6 10 11 8 11 12 12 5 1 2 12 12 7 12 12
Att 222 135 60 52 38 48 39 27 15 3 2 3 2 1 3 1 1 9 661 433
PASSING Tevin Washington Synjyn Days TEAM Tyler Melton Total.......... Opponents......
G 12 6 7 12 12 12
Effic 153.53 205.27 0.00 0.00 152.56 124.53
RECEIVING Stephen Hill Tyler Melton Orwin Smith Roddy Jones Embry Peeples Tony Zenon David Sims Charles Perkins Total.......... Opponents......
G 12 12 11 12 12 8 12 11 12 12
SCORING Tevin Washington Justin Moore Orwin Smith David Sims Roddy Jones Synjyn Days Stephen Hill Embry Peeples Preston Lyons Rod Sweeting Isaiah Johnson Charles Perkins Tony Zenon Deon Hill David Scully Total.......... Opponents......
|------ PATs ------| TD FGs Kick Rush 14 0-0 0-0 0-1 0 9-13 53-53 0-0 12 0-0 0-0 0-0 8 0-0 0-0 1-1 6 0-0 0-0 0-0 4 0-0 0-0 0-0 4 0-0 0-0 0-0 2 0-0 0-0 0-0 1 0-0 0-0 0-0 1 0-0 0-0 0-0 1 0-0 0-0 0-0 1 0-0 0-0 0-0 1 0-0 0-0 0-0 1 0-0 0-0 0-0 0 0-0 1-1 0-0 56 9-13 54-54 1-2 41 8-14 39-39 0-0
PUNTING Sean Poole Chandler Anderson Total.......... Opponents......
No. 31 4 35 47
No. 26 14 13 5 5 3 3 2 71 200
Yds 1201 150 1351 1950
Gain 1028 702 632 444 433 257 202 97 93 30 29 29 18 12 9 5 4 0 4024 2196
W-L 1-0 2-0 3-0 4-0 5-0 6-0 6-1 6-2 7-2 7-3 8-3 8-4
ACC Attend 42,132 30,502 42,025 1-0 46,849 2-0 55,811 3-0 45,905 3-1 47,692 3-2 43,716 4-2 55,646 4-3 50,140 5-3 18,747 54,925
TV ESPN3.com ESPN3.com
RSN ESPN ABC/ESPN ESPNU ESPNU ESPN ABC ESPN ACC ESPN
Loss 138 4 16 6 11 20 0 1 7 0 0 2 0 0 0 0 0 17 222 240
Net 890 698 616 438 422 237 202 96 86 30 29 27 18 12 9 5 4 -17 3802 1956
Avg 4.0 5.2 10.3 8.4 11.1 4.9 5.2 3.6 5.7 10.0 14.5 9.0 9.0 12.0 3.0 5.0 4.0 -1.9 5.8 4.5
TD 14 7 11 3 2 4 1 1 0 0 0 0 0 0 0 1 0 0 44 18
Long 56 41 95 48 63 30 36 14 19 28 27 24 12 12 6 5 4 0 95 77
Avg 74.2 58.2 56.0 36.5 35.2 39.5 20.2 8.7 10.8 2.7 2.4 2.2 3.6 12.0 4.5 0.4 0.3 -2.4 316.8 163.0
Cmp-Att-Int 63-135-8 8-12-0 0-4-0 0-1-0 71-152-8 200-353-13
Pct 46.7 66.7 0.0 0.0 46.7 56.7
Yds 1515 198 0 0 1713 2376
TD 10 0 0 0 10 20
Lng 82 66 0 0 82 63
Avg 126.2 33.0 0.0 0.0 142.8 198.0
Yds 785 244 306 122 85 104 29 38 1713 2376
Avg 30.2 17.4 23.5 24.4 17.0 34.7 9.7 19.0 24.1 11.9
Avg 38.7 37.5 38.6 41.5
2011 GEORGIA TECH FOOTBALL
Long 55 42 55 58
TD 4 0 1 3 0 1 1 0 10 20
Long 82 66 67 52 46 73 12 29 82 63
Avg 65.4 20.3 27.8 10.2 7.1 13.0 2.4 3.5 142.8 198.0
8-4 overall / 5-3 ACC / 5-2 Home / 3-2 Road
TOTAL OFFENSE Tevin Washington David Sims Orwin Smith Roddy Jones Synjyn Days Embry Peeples Preston Lyons Charles Perkins Tony Zenon Richard Watson Jemea Thomas Stephen Hill Robert Godhigh Matt Connors Darryl Dickey Deon Hill Tyler Melton TEAM Total.......... Opponents......
G Plays 12 357 12 135 11 60 12 52 6 60 12 38 10 39 11 27 8 15 11 3 12 2 12 3 5 2 1 1 2 3 12 1 12 2 7 13 12 813 12 786
Rush 890 698 616 438 237 422 202 96 86 30 29 27 18 12 9 5 4 -17 3802 1956
Pass 1515 0 0 0 198 0 0 0 0 0 0 0 0 0 0 0 0 0 1713 2376
Total 2405 698 616 438 435 422 202 96 86 30 29 27 18 12 9 5 4 -17 5515 4332
Avg 200.4 58.2 56.0 36.5 72.5 35.2 20.2 8.7 10.8 2.7 2.4 2.2 3.6 12.0 4.5 0.4 0.3 -2.4 459.6 361.0
ALL PURPOSE Orwin Smith Tevin Washington Stephen Hill David Sims Embry Peeples Roddy Jones Tony Zenon Tyler Melton Synjyn Days Preston Lyons Charles Perkins Zach Laskey Jemea Thomas Isaiah Johnson Richard Watson Rod Sweeting Robert Godhigh B.J. Machen Matt Connors Quayshawn Nealy Darryl Dickey Corey Dennis Deon Hill Jeremiah Attaochu Euclid Cummings TEAM Total.......... Opponents......
G Rush 11 616 12 890 12 27 12 698 12 422 12 438 8 86 12 4 6 237 10 202 11 96 8 0 12 29 12 0 11 30 12 0 5 18 12 0 1 12 12 0 2 9 12 0 12 5 10 0 12 0 7 -17 12 3802 12 1956
Rec 306 0 785 29 85 122 104 244 0 0 38 0 0 0 0 0 0 0 0 0 0 0 0 0 0 0 1713 2376
PR 0 0 0 0 0 0 0 0 0 0 0 94 21 0 0 0 0 0 0 0 0 7 0 0 -2 0 120 41
KOR 352 0 28 0 109 17 202 0 0 0 39 6 16 0 2 0 0 0 0 0 0 0 0 0 0 0 771 1400
IR 0 0 0 0 0 0 0 0 0 0 0 0 9 34 0 30 0 15 0 10 0 0 0 5 0 0 103 46
FIELD GOALS Justin Moore
Rcv 0 0 0 0 0 0 0 0 0 0 0 0 0 0 0 0 0
Pass 0-0 0-0 0-0 0-0 0-0 0-0 0-0 0-0 0-0 0-0 0-0 0-0 0-0 0-0 0-0 0-0 0-2
DXP 0 0 0 0 0 0 0 0 0 0 0 0 0 0 0 0 0
Saf 0 0 0 0 0 0 0 0 0 0 0 0 0 0 0 0 0
TB 1 0 1 4
FC 6 2 8 13
I20 5 1 6 16
Blkd 0 0 0 1
Points 84 80 72 50 36 24 24 12 6 6 6 6 6 6 1 419 309
FGM-A 9-13
Pct 69.2
01-19 0-0
Tot 1274 890 840 727 616 577 392 248 237 202 173 100 75 34 32 30 18 15 12 10 9 7 5 5 -2 -17 6509 5819
Avg/G 115.8 74.2 70.0 60.6 51.3 48.1 49.0 20.7 39.5 20.2 15.7 12.5 6.2 2.8 2.9 2.5 3.6 1.2 12.0 0.8 4.5 0.6 0.4 0.5 -0.2 -2.4 542.4 484.9
20-29 30-39 40-49 50-99 4-4 2-4 3-4 0-1
Lg 41
Blk 2
FG SEQUENCE GEORGIA TECH OPPONENTS Western Carolina 45 Middle Tennessee 46 Kansas (24) (28) North Carolina (40),38,(36) NC State (40) 48 Maryland 34 (30) Virginia 52 32,(36) Miami 47,(39) Clemson (23) (34),40 Virginia Tech (41),(36) (23) Duke (25) (35) Georgia (22) (41),52 Numbers in (parentheses) indicate field goal was made. KICKOFFS David Scully Justin Moore Chandler Anderson Total.......... Opponents...... INTERCEPTIONS Jemea Thomas Isaiah Johnson Rod Sweeting Jeremiah Attaochu Louis Young B.J. Machen Quayshawn Nealy Total.......... Opponents......
No. 38 29 8 75 56 No. 3 3 3 1 1 1 1 13 8
Yds 2418 1796 470 4684 3564 Yds 9 34 30 5 0 15 10 103 46
Avg 63.6 61.9 58.8 62.5 63.6 Avg 3.0 11.3 10.0 5.0 0.0 15.0 10.0 7.9 5.8
TB 5 1 0 6 13
OB 0 2 0 2 2
TD 0 1 1 0 0 0 0 2 0
Long 7 34 32 5 0 15 10 34 26
Retn
Net
YdLn
1400 771
42.2 45.2
27 24
RAMBLINWRECK.COM
INDIVIDUAL STATISTICS PUNT RETURNS Zach Laskey Jemea Thomas Euclid Cummings Corey Dennis Total.......... Opponents......
No. 11 2 1 1 15 11
Yds 94 21 -2 7 120 41
Avg 8.5 10.5 -2.0 7.0 8.0 3.7
TD 0 0 0 0 0 0
Long 28 14 0 7 28 13
KICK RETURNS Orwin Smith Tony Zenon Embry Peeples Charles Perkins Zach Laskey Richard Watson Roddy Jones Stephen Hill Jemea Thomas Total.......... Opponents......
No. 18 9 6 2 1 1 1 1 1 40 67
Yds 352 202 109 39 6 2 17 28 16 771 1400
Avg 19.6 22.4 18.2 19.5 6.0 2.0 17.0 28.0 16.0 19.3 20.9
TD 0 0 0 0 0 0 0 0 0 0 0
Long 29 79 29 24 6 2 17 28 16 79 60
FUMBLE RETURNS Total.......... Opponents......
No. 0 1
Yds 0 33
Avg 0.0 33.0
TD 0 3
Long 0 33
TEAM STATISTICS
GT
OPP
SCORING 419 309 Points Per Game 34.9 25.8 FIRST DOWNS 246 225 Rushing 186 104 Passing 51 110 Penalty 9 11 RUSHING YARDAGE 3802 1956 Yards gained rushing 4024 2196 Yards lost rushing 222 240 Rushing Attempts 661 433 Average Per Rush 5.8 4.5 Average Per Game 316.8 163.0 TDs Rushing 44 18 PASSING YARDAGE 1713 2376 Comp-Att-Int 71-152-8 200-353-13 Average Per Pass 11.3 6.7 Average Per Catch 24.1 11.9 Average Per Game 142.8 198.0 TDs Passing 10 20 TOTAL OFFENSE 5515 4332 Total Plays 813 786 Average Per Play 6.8 5.5 Average Per Game 459.6 361.0 KICK RETURNS: #-Yards 40-771 67-1400 PUNT RETURNS: #-Yards 15-120 11-41 INT RETURNS: #-Yards 13-103 8-46 KICK RETURN AVERAGE 19.3 20.9 PUNT RETURN AVERAGE 8.0 3.7 INT RETURN AVERAGE 7.9 5.8 FUMBLES-LOST 27-10 21-7 PENALTIES-Yards 54-450 50-344 Average Per Game 37.5 28.7 PUNTS-Yards 35-1351 47-1950 Average Per Punt 38.6 41.5 Net punt average 36.9 37.2 TIME OF POSSESSION/Game 31:45 28:15 3RD-DOWN Conversions 90/164 71/162 3rd-Down Pct 55% 44% 4TH-DOWN Conversions 10/19 14/22 4th-Down Pct 53% 64% SACKS BY-Yards 20-133 13-77 MISC YARDS 0 78 TOUCHDOWNS SCORED 56 41 FIELD GOALS-ATTEMPTS 9-13 8-14 ON-SIDE KICKS 0-0 1-3 RED-ZONE SCORES (47-53) 89% (38-47) 81% RED-ZONE TOUCHDOWNS (40-53) 75% (31-47) 66% PAT-ATTEMPTS (54-54) 100% (39-39) 100% ATTENDANCE 337622 196468 Games/Avg Per Game 7/48232 5/39294 Neutral Site Games 0/0 SCORE BY QUARTERS 1st Georgia Tech 115 Opponents 55
2nd 127 107
3rd 104 44
2011 GEORGIA TECH FOOTBALL
DEFENSIVE STATISTICS No. 40 1 6 45 8 28 54 14 92 34 96 30 94 99 93 11 58 90 95 35 31 42 37 16 36 44 48 21 26 43 84 81 5 85 20 33 56 97 91 13 86 88
|-----Tackles-----| |-Sacks-||---Pass Def---| |-Fumbles-| Player GP Solo Ast Total TFL/Yds No-Yds Int-Yds BrUp QBH Rcv-Yds FF Julian Burnett 12 58 55 113 9.5-25 1.0-6 . 3 1 1-0 1 Isaiah Johnson 12 44 25 69 1.5-5 . 3-34 3 . 2-0 . Rod Sweeting 12 36 19 55 3.0-7 . 3-30 9 . 1-0 2 Jeremiah Attaochu 10 31 21 52 8.5-53 6.0-45 1-5 2 . 1-0 1 Louis Young 12 24 28 52 3.0-9 . 1-0 5 1 . 1 Rashaad Reid 12 21 29 50 1.5-9 . . 2 . . 1 Quayshawn Nealy 12 22 25 47 3.0-4 . 1-10 2 . 1-0 . Jemea Thomas 12 29 13 42 3.0-12 1.0-6 3-9 4 . . 1 Jason Peters 12 16 24 40 2.5-8 2.0-7 . 2 . 1-0 . Steven Sylvester 12 19 19 38 4.0-18 1.0-7 . 1 . . 1 Logan Walls 12 14 23 37 2.0-2 . . . . . . Daniel Drummond 10 14 18 32 . . . 1 . . 1 Izaan Cross 12 14 16 30 1.0-2 . . 4 1 . 1 Euclid Cummings 12 10 11 21 2.0-2 . . 1 . . . Emmanuel Dieke 12 11 7 18 2.0-6 2.0-6 . . 1 . . Brandon Watts 11 6 9 15 3.0-14 3.0-14 . 1 . . 1 B.J. Machen 12 7 6 13 . . 1-15 . . . . T.J. Barnes 12 3 8 11 1.5-17 1.0-16 . . . . . Christopher Crenshaw 8 4 6 10 1.0-7 1.0-7 . . . . . Michael Peterson 11 5 3 8 0.5-5 . . . . . . Deon Hill 12 4 4 8 . . . . . . . Malcolm Munroe 12 8 . 8 1.0-10 1.0-10 . . . . . Zach Laskey 8 3 5 8 . . . . . . . Corey Dennis 12 5 2 7 . . . . . . . Jamal Golden 10 5 2 7 . . . 1 . . . David Scully 10 2 2 4 . . . . . . 1 Nick Menocal 9 2 2 4 1.5-9 1.0-9 . . . . . Charles Perkins 11 2 1 3 . . . . . . . Lance Richardson 4 2 . 2 . . . 1 . . . Kyle Travis 11 1 1 2 . . . . . . . Tyler Melton 12 2 . 2 . . . . . . . Jeff Greene 11 1 . 1 . . . . . . . Stephen Hill 12 1 . 1 . . . . . . . Chandler Anderson 6 . 1 1 . . . . . . . Roddy Jones 12 1 . 1 . . . . . . . Chris Jackson 12 . 1 1 . . . . . . . Anthony Williams 4 . 1 1 . . . . . . . Shawn Green 4 . 1 1 . . . . . . . Morgan Carter 8 1 . 1 . . . . . . . Tevin Washington 12 1 . 1 . . . . . . . Justin Moore 12 1 . 1 . . . . . . . Darren Waller 11 . . . . . . . . . . Total.......... 12 430 388 818 55-224 20-133 13-103 42 4 7-0 12 Opponents...... 12 485 400 885 53.0-176 13-77 8-46 14 4 10-33 9
Blkd Kick Saf . . . . . . . . . . . . . . . . . . . . . . 1 . . . . . . . . . . . . . . . . . . . . . . . . . . . . . . . . . . . . . . . . . . . . . . . . . . . . . . . . . . . 1 . 2 . 2 .
POSSESSIONS TECH Western Carolina Middle Tennessee Kansas North Carolina NC State Maryland Virginia Miami Clemson Virginia Tech Duke Georgia TOTAL
No. 15 11 12 12 13 12 10 12 12 10 11 11 141
TD 9 7 9 4 6 3 3 1 4 3 5 2 56
------------ How Possession Ended -----------FG FGA Punt TO Clock Downs 0 1 2 2 0 1 0 0 2 1 1 0 1 1 1 0 1 0 2 3 3 2 0 0 1 1 2 1 2 1 0 1 5 1 1 1 0 1 4 2 0 0 0 0 5 3 1 2 1 1 3 2 1 1 2 2 3 0 0 2 1 1 2 2 1 0 1 1 3 2 2 1 9 13 35 18 10 9
3&Out 1 1 0 1 2 2 2 3 3 3 2 1 21
Pts 63 49 66 35 45 21 21 7 31 26 38 17 419
PPP 4.20 4.45 5.50 2.92 3.46 1.75 2.10 0.58 2.58 2.60 3.45 1.55 2.97
OPPONENTS Western Carolina Middle Tennessee Kansas North Carolina NC State Maryland Virginia Miami Clemson Virginia Tech Duke Georgia TOTAL
No. 16 11 12 13 12 12 11 12 12 10 10 10 141
TD 3 3 3 4 5 2 3 3 2 5 4 4 41
------------ How Possession Ended -----------FG FGA Punt TO Clock Downs 0 0 8 3 1 1 0 1 3 3 1 0 1 1 7 0 0 1 0 0 5 2 2 0 0 1 3 1 0 2 1 1 4 2 1 2 1 2 2 1 2 1 1 2 4 1 1 1 1 2 3 4 1 0 1 1 2 1 1 0 1 1 4 1 0 0 1 2 3 1 0 0 8 14 48 20 10 8
3&Out 3 1 5 3 2 3 2 3 1 0 3 2 28
Pts 21 21 24 28 35 16 24 24 17 37 31 31 309
PPP 1.31 1.91 2.00 2.15 2.92 1.33 2.18 2.00 1.42 3.70 3.10 3.10 2.19
4th Total 73 419 103 309
RAMBLINWRECK.COM
TEAM GAME-BY-GAME STATISTICS TEAM GAME-BY-GAME |---RUSHING---| |--RECEIVING--| |-------PASSING-------| |--KICK RET--| |--PUNT RET--| Opponent No. Yds TD Lg No. Yds TD Lg Cmp-Att-Int Yds TD Lg No Yds TD Lg No Yds TD Lg WESTERN CAROLINA 48 297 6 77 11 365 3 82 11-16-0 365 3 82 2 51 0 28 3 29 0 28 at Middle Tennessee 65 382 5 28 6 214 2 73 6-10-0 214 2 73 2 17 0 9 1 0 0 0 KANSAS 50 604 7 95 4 164 2 67 4-7-0 164 2 67 4 71 0 29 4 27 0 12 NORTH CAROLINA 58 312 3 48 10 184 1 59 10-14-1 184 1 59 5 111 0 28 1 7 0 7 at NC State 52 296 3 41 4 117 2 40 4-12-0 117 2 40 5 72 0 20 0 0 0 0 MARYLAND 60 272 3 39 6 114 0 34 6-21-1 114 0 34 3 115 0 79 2 29 0 26 at Virginia 53 272 2 29 2 24 0 21 2-8-2 24 0 21 3 46 0 24 1 16 0 16 at Miami 48 134 1 11 7 77 0 17 7-14-1 77 0 17 3 45 0 23 1 -9 0 0 CLEMSON 67 383 4 56 4 60 0 44 4-9-1 60 0 44 3 62 0 24 1 7 0 7 VIRGINIA TECH 49 243 3 39 5 97 0 41 5-11-0 97 0 41 3 70 0 26 0 0 0 0 at Duke 58 364 5 39 6 185 0 56 6-13-0 185 0 56 6 82 0 23 1 14 0 14 GEORGIA 53 243 2 27 6 112 0 36 6-17-2 112 0 36 1 29 0 29 0 0 0 0 Totals 661 3802 44 95 71 1713 10 82 71-152-8 1713 10 82 40 771 0 79 15 120 0 28 Opponent 433 1956 18 77 200 2376 20 63 200-353-13 2376 20 63 67 1400 0 60 11 41 0 13 Avg per rush: 5.8 / Avg per catch: 24.1 / Pass efficiency: 152.56 / Kick ret avg: 19.3 / Punt ret avg: 8.0 / All purpose avg/game: 542.4 / Total offense avg/gm: 459.6 Date Sep 01 Sep 10 Sep 17 Sep 24 Oct 01 Oct 08 Oct 15 Oct 22 Oct 29 Nov 10 Nov 19 Nov 26
Date Sep 01 Sep 10 Sep 17 Sep 24 Oct 01 Oct 08 Oct 15 Oct 22 Oct 29 Nov 10 Nov 19 Nov 26
Date Sep 01 Sep 10 Sep 17 Sep 24 Oct 01 Oct 08 Oct 15 Oct 22 Oct 29 Nov 10 Nov 19 Nov 26
Opponent WESTERN CAROLINA at Middle Tennessee KANSAS NORTH CAROLINA at NC State MARYLAND at Virginia at Miami CLEMSON VIRGINIA TECH at Duke GEORGIA Totals Opponent
|---------TACKLES---------| |-SACKS-| Solo Ast Total TFL-Yds No-Yds 46 46 92 8.0-35 4.0-21 46 16 62 1.0-2 0.0-0 38 44 82 4.0-10 1.0-1 29 38 67 8.0-47 7.0-44 45 30 75 4.0-23 2.0-18 30 34 64 2.0-13 1.0-9 31 48 79 4.0-11 1.0-6 37 6 43 5.0-12 0.0-0 31 22 53 4.0-25 2.0-19 34 42 76 8.0-24 1.0-2 35 30 65 4.0-5 0.0-0 28 32 60 3.0-17 1.0-13 430 388 818 55.0-224 20.0-133 485 400 885 53.0-176 13.0-77
|-FUMBLE-| FF FR-Yds 2 2-0 2 2-0 2 0-0 1 0-0 0 0-0 0 0-0 0 0-0 0 0-0 2 2-0 1 1-0 1 0-0 1 0-0 12 7-0 9 10-33
Int-Yds 1-15 1-0 0-0 2--2 1-34 2-10 1-32 1-5 2-2 0-0 1-7 1-0 13-103 8-46
|------------------PUNTING------------------||--FIELD GOALS--||------KICKOFFS------| Opponent No Yds Avg Long Blkd TB FC 50+ I20 WESTERN CAROLINA 2 81 40.5 41 0 0 0 0 0 at Middle Tennessee 2 104 52.0 55 0 0 0 1 1 KANSAS 1 37 37.0 37 0 0 0 0 1 NORTH CAROLINA 3 92 30.7 48 0 1 0 0 1 at NC State 2 62 31.0 37 0 0 1 0 0 MARYLAND 5 191 38.2 47 0 0 0 0 1 at Virginia 4 137 34.2 40 0 0 2 0 0 at Miami 5 185 37.0 52 0 0 3 1 0 CLEMSON 3 132 44.0 46 0 0 2 0 1 VIRGINIA TECH 3 112 37.3 44 0 0 0 0 0 at Duke 2 87 43.5 48 0 0 0 0 0 GEORGIA 3 131 43.7 54 0 0 0 1 1 Totals 35 1351 38.6 55 0 1 8 3 6 Opponent 47 1950 41.5 58 1 4 13 8 16
QBH 0 1 0 0 1 0 0 0 0 0 2 0 4 4
Pass Brk 5 4 5 1 4 3 1 5 7 0 5 2 42 14
Att-Made 1-0 0-0 1-1 3-2 1-1 1-0 1-0 0-0 1-1 2-2 1-1 1-1 13-9 14-8
Lg 0 0 24 40 40 0 0 0 23 41 25 22 41 41
Blkd Kick 0 0 0 1 0 0 0 1 0 0 0 0 2 2
|-Kicks--XPTS-| Att-Mad Run Rcv 9-9 0 0 7-7 0 0 9-9 0 0 3-3 1 0 6-6 0 0 3-3 0 0 3-3 0 0 1-1 0 0 4-4 0 0 2-2 0 0 5-5 0 0 2-2 0 0 54-54 1 0 39-39 0 0
Blkd 1 0 0 0 0 0 1 0 0 0 0 0 2 1
No 10 8 11 7 8 4 4 2 6 5 6 4 75 56
Yds 649 492 678 395 532 243 251 134 361 314 375 260 4684 3564
Avg 64.9 61.5 61.6 56.4 66.5 60.8 62.8 67.0 60.2 62.8 62.5 65.0 62.5 63.6
3rd-Down Conversions Date Opponent Sep 01 Western Carolina Sep 10 at Middle Tennessee Sep 17 Kansas Sep 24 North Carolina Oct 01 at NC State Oct 08 Maryland Oct 15 at Virginia Oct 22 at Miami Oct 29 Clemson Nov 10 Virginia Tech Nov 19 at Duke Nov 26 GEORGIA Totals Opponents
W W W W W W L L W L W L
Score 63-21 49-21 66-24 35-28 45-35 21-16 21-24 7-24 31-17 26-37 38-31 17-31
Overall 9-12 8-12 7-10 10-16 4-12 13-20 6-14 8-15 7-14 5-13 6-10 7-16 90-164 71-162
75.0% 66.7% 70.0% 62.5% 33.3% 65.0% 42.9% 53.3% 50.0% 38.5% 60.0% 43.8% 54.9% 43.8%
1st Qtr 0-0 2-3 1-2 2-3 1-2 4-4 1-3 0-2 0-3 2-3 1-3 1-4 15-32 19-49
0.0% 66.7% 50.0% 66.7% 50.0% 100.0% 33.3% 0.0% 0.0% 66.7% 33.3% 25.0% 46.9% 38.8%
2nd Qtr 2-3 1-3 2-3 4-5 2-4 5-7 2-2 5-6 2-3 1-4 1-2 1-3 28-45 22-42
66.7% 33.3% 66.7% 80.0% 50.0% 71.4% 100.0% 83.3% 66.7% 25.0% 50.0% 33.3% 62.2% 52.4%
3rd Qtr 2-3 66.7% 2-2 100.0% 3-3 100.0% 4-5 80.0% 1-4 25.0% 2-4 50.0% 3-7 42.9% 3-5 60.0% 1-2 50.0% 2-2 100.0% 1-2 50.0% 2-4 50.0% 26-43 60.5% 14-36 38.9%
4th Qtr 5-6 3-4 1-2 0-3 0-2 2-5 0-2 0-2 4-6 0-4 3-3 3-5 21-44 16-35
83.3% 75.0% 50.0% 0.0% 0.0% 40.0% 0.0% 0.0% 66.7% 0.0% 100.0% 60.0% 47.7% 45.7%
4th-Down Conversions Date Opponent Sep 01 Western Carolina Sep 10 at Middle Tennessee Sep 17 Kansas Sep 24 North Carolina Oct 01 at NC State Oct 08 Maryland Oct 15 at Virginia Oct 22 at Miami Oct 29 Clemson Nov 10 Virginia Tech Nov 19 at Duke Nov 26 GEORGIA Georgia Tech Opponents
W W W W W W L L W L W L
Score 63-21 49-21 66-24 35-28 45-35 21-16 21-24 7-24 31-17 26-37 38-31 17-31
Overall 0-1 2-2 1-1 0-0 1-2 0-1 3-3 0-2 1-2 0-2 1-1 1-2 10-19 14-22
0.0% 100.0% 100.0% 0.0% 50.0% 0.0% 100.0% 0.0% 50.0% 0.0% 100.0% 50.0% 52.6% 63.6%
1st Qtr 0-0 1-1 0-0 0-0 1-1 0-0 0-0 0-1 1-1 0-0 0-0 0-0 3-4 2-2
0.0% 100.0% 0.0% 0.0% 100.0% 0.0% 0.0% 0.0% 100.0% 0.0% 0.0% 0.0% 75.0% 100.0%
2nd Qtr 0-0 0-0 0-0 0-0 0-0 0-0 0-0 0-0 0-0 0-0 1-1 1-1 2-2 4-5
0.0% 0.0% 0.0% 0.0% 0.0% 0.0% 0.0% 0.0% 0.0% 0.0% 100.0% 100.0% 100.0% 80.0%
3rd Qtr 0-0 0.0% 0-0 0.0% 0-0 0.0% 0-0 0.0% 0-1 0.0% 0-0 0.0% 3-3 100.0% 0-1 0.0% 0-0 0.0% 0-0 0.0% 0-0 0.0% 0-0 0.0% 3-5 60.0% 1-4 25.0%
4th Qtr 0-1 1-1 1-1 0-0 0-0 0-1 0-0 0-0 0-1 0-2 0-0 0-1 2-8 7-11
0.0% 100.0% 100.0% 0.0% 0.0% 0.0% 0.0% 0.0% 0.0% 0.0% 0.0% 0.0% 25.0% 63.6%
2011 GEORGIA TECH FOOTBALL
Saf 0 0 0 0 0 0 0 0 0 0 0 0 0 0
TB 0 0 1 0 1 1 0 1 0 0 1 1 6 13
tot off 662 596 768 496 413 386 296 211 443 340 549 355 5515 4332
Pts 63 49 66 35 45 21 21 7 31 26 38 17 419 309
OB 0 2 0 0 0 0 0 0 0 0 0 0 2 2
RAMBLINWRECK.COM
MISCELLANEOUS GAME-BY-GAME STATISTICS Time of Possession Sep 01 Western Carolina Sep 10 at Middle Tennessee Sep 17 Kansas Sep 24 North Carolina Oct 01 at NC State Oct 08 Maryland Oct 15 at Virginia Oct 22 at Miami Oct 29 Clemson Nov 10 Virginia Tech Nov 19 at Duke Nov 26 Georgia Georgia Tech Opponents
W W W W W W L L W L W L Total Avg. Total Avg.
Score 63-21 49-21 66-24 35-28 45-35 21-16 21-24 7-24 31-17 26-37 38-31 17-31
Overall 28:13 38:42 27:37 36:07 27:51 35:28 29:59 29:24 39:00 25:47 32:10 30:39 380:57 31:44 339:03 28:15
1st Qtr 3:51 9:50 5:46 8:30 9:06 7:24 6:12 4:44 6:43 6:39 9:02 7:42 85:29 7:07 94:31 7:52
2nd Qtr 6:45 8:00 4:40 8:10 2:31 9:26 6:25 11:53 11:03 7:00 8:29 9:54 94:16 7:51 85:44 7:08
3rd Qtr 7:18 10:13 7:15 11:24 10:54 8:28 13:21 9:33 8:11 7:10 6:28 7:01 107:16 8:56 72:44 6:03
4th Qtr 10:19 10:39 9:56 8:03 5:20 10:10 4:01 3:14 13:03 4:58 8:11 6:02 93:56 7:49 86:04 7:10
Georgia Tech Inside Opponent Red-Zone Date Opponent Score Sep 01 Western Carolina W 63-21 Sep 10 at Middle Tennessee W 49-21 Sep 17 Kansas W 66-24 Sep 24 North Carolina W 35-28 Oct 01 at NC State W 45-35 Oct 08 Maryland W 21-16 Oct 15 at Virginia L 21-24 Oct 22 at Miami L 7-24 Oct 29 Clemson W 31-17 Nov 10 Virginia Tech L 26-37 Nov 19 at Duke W 38-31 Nov 26 GEORGIA L 17-31 Totals 47 of 53 (88.7%)
Times In RZ 5 5 5 6 6 5 2 1 6 4 5 3 53
Times Scored 5 5 5 4 5 3 2 1 5 4 5 3 47
Total Pts 35 35 31 25 31 21 14 7 31 23 31 17 301
TDs 5 5 4 3 4 3 2 1 4 3 4 2 40
Rush TDs 5 5 4 3 3 3 2 1 4 3 4 2 39
Pass TDs 0 0 0 0 1 0 0 0 0 0 0 0 1
FGs Made 0 0 1 1 1 0 0 0 1 1 1 1 7
------------- Failed to score inside RZ ------------FGA Downs Int Fumb Half Game 0 0 0 0 0 0 0 0 0 0 0 0 0 0 0 0 0 0 1 0 0 1 0 0 0 1 0 0 0 0 1 0 1 0 0 0 0 0 0 0 0 0 0 0 0 0 0 0 0 0 0 1 0 0 0 0 0 0 0 0 0 0 0 0 0 0 0 0 0 0 0 0 2 1 1 2 0 0
Opponents Inside Georgia Tech Red-Zone Date Opponent Score Sep 01 Western Carolina W 63-21 Sep 10 at Middle Tennessee W 49-21 Sep 17 Kansas W 66-24 Sep 24 North Carolina W 35-28 Oct 01 at NC State W 45-35 Oct 08 Maryland W 21-16 Oct 15 at Virginia L 21-24 Oct 22 at Miami L 7-24 Oct 29 Clemson W 31-17 Nov 10 Virginia Tech L 26-37 Nov 19 at Duke W 38-31 Nov 26 GEORGIA L 17-31 Totals 34 of 43 (79.1%)
Times In RZ 3 3 4 3 4 3 4 4 3 7 5 4 47
Times Scored 2 3 4 3 3 2 2 3 2 5 5 4 38
Total Pts 14 21 24 21 21 9 10 17 10 30 31 28 236
TDs 2 3 3 3 3 1 1 2 1 4 4 4 31
Rush TDs 2 2 2 1 0 1 1 2 1 2 0 0 14
Pass TDs 0 1 1 2 3 0 0 0 0 2 4 4 17
FGs Made 0 0 1 0 0 1 1 1 1 1 1 0 7
------------- Failed to score inside RZ ------------FGA Downs Int Fumb Half Game 0 1 0 0 0 0 0 0 0 0 0 0 0 0 0 0 0 0 0 0 0 0 0 0 0 1 0 0 0 0 0 1 0 0 0 0 1 0 0 0 1 0 0 1 0 0 0 0 0 0 1 0 0 0 0 0 0 1 1 0 0 0 0 0 0 0 0 0 0 0 0 0 1 4 1 1 2 0
GAME-BY-GAME STARTERS OFFENSE WCU MTSU Quarterback Washington Washington B-Back Sims 1-Zenon A-Back Jones Jones A-Back O. Smith O. Smith Wide Receiver S. Hill S. Hill Wide Receiver Melton Melton Left Tackle Beno Beno Left Guard W. Jackson W. Jackson Center Finch Finch Right Guard Uzzi Uzzi Right Tackle Kidney Kidney 1 – Three A-backs started the game
KANSAS Washington Sims Jones O. Smith S. Hill Melton Beno W. Jackson Finch Uzzi P. Smith
UNC Washington Sims Jones O. Smith S. Hill Melton Beno W.Jackson Finch Uzzi P. Smith
NCSU Washington Sims Jones O. Smith S. Hill Melton Beno W. Jackson Finch Uzzi Kidney
MARYLAND Washington Sims Jones O. Smith S. Hill Melton Beno W. Jackson Finch Uzzi Kidney
VIRGINIA Washington Sims Jones O. Smith S. Hill Melton Beno W. Jackson Finch Uzzi P. Smith
MIAMI Washington Sims Jones O. Smith S. Hill Melton Beno W. Jackson Finch Uzzi P. Smith
CLEMSON Washington Sims Jones O. Smith S. Hill Melton Beno W. Jackson McRae Uzzi P. Smith
VA TECH Washington Sims Jones O. Smith S. Hill Melton P. Smith W. Jackson Finch Uzzi Kidney
DUKE Washington Sims Jones Peeples S. Hill Melton Beno W. Jackson Finch Uzzi P. Smith
GEORGIA Washington Sims Jones Peeples S. Hill Melton Beno W. Jackson Finch Uzzi P. Smith
DEFENSE WCU MTSU End Peters Peters Tackle Walls Walls End Cross Cross Outside LB Attaochu Attaochu Inside LB Burnett Burnett Inside LB Drummond Nealy Outside LB Sylvester 2-Peterson Cornerback Sweeting Sweeting Cornerback Young Young Safety Johnson Johnson Safety Reid Reid 2 – Tech began game in nickel package
KANSAS Peters Walls Cross Attaochu Burnett Drummond Sylvester Sweeting Young Johnson Reid
UNC Peters Walls Cross Attaochu Burnett Drummond Sylvester Sweeting Young Johnson Reid
NCSU Peters Walls Cross Attaochu Burnett Drummond Sylvester Sweeting Young Johnson Reid
MARYLAND Peters Walls Cross Munroe Burnett Nealy 2-Crenshaw Sweeting Young Johnson Reid
VIRGINIA Peters Walls Cross Watts Burnett Nealy Sylvester Sweeting Young Johnson Reid
MIAMI Peters Walls Cross Attaochu Burnett Nealy Sylvester Sweeting Young Johnson Reid
CLEMSON Peters Walls Cross Attaochu Burnett Nealy 2-Thomas Sweeting Young Johnson Reid
VA TECH Peters Walls Cross Attaochu Burnett Nealy Sylvester Sweeting Young Johnson Reid
DUKE Peters Walls Cross Crenshaw Burnett Nealy Sylvester Sweeting Young Johnson Reid
GEORGIA Peters Walls Cross Attaochu Burnett Drummond Sylvester Sweeting Young Johnson Reid
SPECIALISTS Placekicker Punter Kickoffs Holder Snapper KO Returns Punt Returns
KANSAS Ju. Moore Poole Anderson Poole Morgan O. Smith Laskey
UNC Ju. Moore Poole Anderson Poole Morgan O. Smith Laskey
NCSU Ju. Moore Poole Scully Poole Morgan Zenon Laskey
MARYLAND Ju. Moore Anderson Scully Poole Tobin Zenon Laskey
VIRGINIA Ju. Moore Poole Scully Poole Tobin Zenon Laskey
MIAMI Ju. Moore Poole Scully Poole Tobin Zenon Laskey
CLEMSON Ju. Moore Poole Ju. Moore Poole Tobin O. Smith Thomas
VA TECH Ju. Moore Poole Scully Poole Tobin O. Smith Thomas
DUKE Ju. Moore Poole Scully Poole Tobin Peeples Thomas
GEORGIA Ju. Moore Poole Scully Poole Tobin Peeples Thomas
WCU Ju. Moore Poole Ju. Moore Poole Morgan O. Smith Laskey
MTSU Ju. Moore Poole Ju. Moore Poole Morgan O. Smith Laskey
2011 GEORGIA TECH FOOTBALL
RAMBLINWRECK.COM
OPPONENT GAME-BY-GAME STATISTICS OPPONENT GAME-BY-GAME |---RUSHING---| |--RECEIVING--| |-------PASSING-------| |--KICK RET--| Opponent No. Yds TD Lg No. Yds TD Lg Cmp-Att-Int Yds TD Lg No Yds TD Lg WESTERN CAROLINA 40 104 2 33 22 197 0 21 22-37-1 197 0 21 10 204 0 29 at Middle Tennessee 29 147 2 18 22 195 1 27 22-35-1 195 1 27 6 136 0 38 KANSAS 42 151 2 19 17 211 1 42 17-27-0 211 1 42 10 176 0 28 NORTH CAROLINA 27 128 2 55 17 204 2 41 17-25-2 204 2 41 7 127 0 27 at NC State 38 195 1 46 23 192 3 28 23-36-1 192 3 28 7 150 0 32 MARYLAND 41 246 2 77 6 87 0 34 6-24-2 87 0 34 3 52 0 26 at Virginia 47 272 2 23 9 135 1 37 9-19-1 135 1 37 4 98 0 29 at Miami (Fla.) 41 122 2 18 8 140 0 48 8-23-1 140 0 48 1 48 0 48 CLEMSON 24 95 1 18 24 304 1 48 24-41-2 304 1 48 6 124 0 38 VIRGINIA TECH 52 267 2 44 7 209 3 63 7-13-0 209 3 63 5 90 0 29 at Duke 24 101 0 39 26 250 4 41 26-44-1 250 4 41 5 111 0 31 GEORGIA 28 128 0 22 19 252 4 31 19-29-1 252 4 31 3 84 0 60 Opponent totals 433 1956 18 77 200 2376 20 63 200-353-13 2376 20 63 67 1400 0 60 Georgia Tech 661 3802 44 95 71 1713 10 82 71-152-8 1713 10 82 40 771 0 79 Avg per rush: 4.5 / Avg per catch: 11.9 / Pass efficiency: 124.53 / Kick ret avg: 20.9 / Punt ret avg: 3.7 / All purpose avg/game: 484.9 / Total offense avg/gm: 361.0 Date Sep 01 Sep 10 Sep 17 Sep 24 Oct 01 Oct 08 Oct 15 Oct 22 Oct 29 Nov 10 Nov 19 Nov 26
Date Sep 01 Sep 10 Sep 17 Sep 24 Oct 01 Oct 08 Oct 15 Oct 22 Oct 29 Nov 10 Nov 19 Nov. 26
Date Sep 01 Sep 10 Sep 17 Sep 24 Oct 01 Oct 08 Oct 15 Oct 22 Oct 29 Nov 10 Nov 19 Nov. 26
Opponent WESTERN CAROLINA at Middle Tennessee KANSAS NORTH CAROLINA at NC State MARYLAND at Virginia at Miami CLEMSON VIRGINIA TECH at Duke GEORGIA Opponent totals Georgia Tech
|---------TACKLES---------| |-SACKS-| Solo Ast Total TFL-Yds No-Yds 27 46 73 3.0-8 0.0-0 54 24 78 4.0-18 1.0-11 37 28 65 4.0-17 1.0-11 48 40 88 7.0-23 0.0-0 36 28 64 3.0-10 1.0-3 49 28 77 5.0-6 0.0-0 30 48 78 5.0-14 0.0-0 50 12 62 6.0-14 2.0-4 47 42 89 3.0-5 1.0-1 28 44 72 6.0-37 5.0-36 39 36 75 1.0-6 0.0-0 40 24 64 6.0-18 2.0-11 485 400 885 53.0-176 13.0-77 430 388 818 55.0-224 20.0-133
|-FUMBLE-| FF FR-Yds 0 2-0 1 1-0 1 0-0 0 1-0 3 1-33 0 0-0 0 0-0 2 2-0 1 1-0 0 0-0 1 2-0 0 0-0 9 10-33 12 7-0
Int-Yds 0-0 0-0 0-0 1-20 0-0 1-0 2-0 1-0 1-26 0-0 0-0 2-0 8-46 13-103
|------------------PUNTING------------------||--FIELD GOALS--||------KICKOFFS------| Opponent No Yds Avg Long Blkd TB FC 50+ I20 WESTERN CAROLINA 8 294 36.8 46 0 0 2 0 3 at Middle Tennessee 3 139 46.3 54 0 0 0 1 2 KANSAS 7 330 47.1 51 0 1 0 1 1 NORTH CAROLINA 4 165 41.2 41 1 0 3 0 0 at NC State 3 106 35.3 38 0 0 3 0 0 MARYLAND 4 181 45.2 53 0 0 1 2 1 at Virginia 2 79 39.5 40 0 0 0 0 1 at Miami 4 186 46.5 58 0 1 0 2 2 CLEMSON 3 115 38.3 54 0 0 2 1 1 VIRGINIA TECH 2 69 34.5 35 0 1 0 0 1 at Duke 4 156 39.0 46 0 0 2 0 2 GEORGIA 3 130 43.3 55 0 1 0 1 2 Opponent totals 47 1950 41.5 58 1 4 13 8 16 Georgia Tech 35 1351 38.6 55 0 1 8 3 6
QBH 0 1 0 0 2 0 0 0 0 0 1 0 4 4
Att-Made 0-0 1-0 1-1 0-0 1-0 1-1 2-1 2-1 2-1 1-1 1-1 2-1 14-8 13-9
Pass Brk 0 3 1 0 0 2 1 3 0 0 3 1 14 42
Lg 0 0 28 0 0 30 36 39 34 23 35 41 41 41
Blkd Kick 1 0 0 0 0 0 1 0 0 0 0 0 2 2
Blkd 0 0 0 0 0 0 0 1 0 0 0 0 1 2
|-Kicks--XPTS-| Att-Mad Run Rcv 3-3 0 0 3-3 0 0 3-3 0 0 4-4 0 0 5-5 0 0 1-1 0 0 3-3 0 0 3-3 0 0 2-2 0 0 4-4 0 0 4-4 0 0 4-4 0 0 39-39 0 0 54-54 1 0
No 3 3 4 5 4 4 5 5 4 7 6 6 56 75
Yds 173 139 236 325 244 272 327 349 263 482 358 396 3564 4684
Avg 57.7 46.3 59.0 65.0 61.0 68.0 65.4 69.8 65.8 68.9 59.7 66.0 63.6 62.5
|--PUNT RET--| No Yds TD Lg 2 15 0 13 1 -2 0 0 0 0 0 0 0 0 0 0 1 4 0 2 2 3 0 4 1 13 0 13 1 -2 0 0 0 0 0 0 0 0 0 0 1 6 0 6 2 4 0 4 11 41 0 13 15 120 0 28
Saf 0 0 0 0 0 0 0 0 0 0 0 0 0 0
TB 0 0 0 0 0 1 2 2 0 4 0 4 13 6
tot off 301 342 362 332 387 333 407 262 399 476 351 380 4332 5515
Pts 21 21 24 28 35 16 24 24 17 37 31 31 309 419
OB 1 0 0 0 0 0 0 0 1 0 0 0 2 2
MISCELLANEOUS GAME-BY-GAME W. Carolina at Middle Tennessee Kansas North Carolina at NC State Maryland at Virginia at Miami Clemson Virginia Tech at Duke Georgia
Captain Jones Melton Anderson Burnett Burnett Burnett Burnett Burnett Burnett Burnett Burnett Burnett
Captain Sylvester Peters Peeples Jones Jones Jones Jones Jones Jones Jones Jones Jones
2011 GEORGIA TECH FOOTBALL
Captain Walls Peterson Reid Sylvester Sylvester Sylvester Sylvester Sylvester Sylvester Sylvester Sylvester Sylvester
Won Coin Toss Tech MTSU Kansas Tech Tech Tech UVA Miami Clemson Tech Duke Georgia
Tech KO/ Receive Kickoff Receive Kickoff Kickoff Kickoff Kickoff Kickoff Kickoff Receive Kickoff Receive Receive
Tech’s 1st Play O. Smith 5-yd TD run Zenon 73-yd TD reception O. Smith 95-yard TD run O. Smith 21-yd reception O. Smith 5-yard run Melton 21-yd reception Incomplete pass Intercepted pass Washington 1-yd run Sims 3-yard run Washington 0-yd run Incomplete pass
Tech’s 1st Possession Touchdown Touchdown Touchdown Field Goal Touchdown Touchdown Punt Interception Punt Touchdown Punt Punt
Opp. 1st Possession Fumble Punt Punt Touchdown Punt Punt Touchdown Punt Field Goal Punt Touchdown Interception
Game Time 7:34 7:04 12:38 12:01 3:37 12:02 3:32 3:43 8:12 8:02 12:30 12:01
Game Length 3:00 2:40 3:00 3:05 3:20 3:23 3:02 3:01 3:18 3:06 3:11 3:14
Jerseys Pants White Gold White White White Gold White Gold White White White Gold White White White White White Gold White Gold White White White Gold
Result W, 63-21 W, 49-21 W, 66-24 W, 35-28 W, 45-35 W, 21-16 L, 21-24 L, 7-24 W, 31-17 L, 26-37 W, 38-31 L, 17-31
RAMBLINWRECK.COM
INDIVIDUAL GAME-BY-GAME STATISTICS RUSHING Washington, T. QB Sims, D. RB Smith, O. RB Jones, R. RB Peeples, E. RB Days, S. QB Lyons, P. RB Perkins, C. RB Zenon, T. RB Watson, R. RB Thomas, J. Hill, S. WR Godhigh, R. RB Connors, M. Dickey, D. QB Hill, D. RB Melton, T. WR
No.-Yds/TD 222-890/14 135-698/7 60-616/11 52-438/3 38-422/2 48-237/4 39-202/1 27-96/1 15-86/0 3-30/0 2-29/0 3-27/0 2-18/0 1-12/0 3-9/0 1-5/1 1-4/0
WCU 6-34/0 9-44/1 4-84/2 1-7/0 14-55/1 2-22/1 5-12/0 1--3/0 3-30/0 1-6/0 DNP 1-1/0 1-5/1 -
MTSU 10-6/2 12-91/0 3-29/1 6-63/0 2-15/0 15-91/2 6-18/0 5-22/0 6-47/0 DNP DNP -
KANSAS 6-32/0 9-70/2 5-157/1 4-72/1 5-110/1 9-68/1 2-40/0 4-15/1 2-8/0 1-12/0 1-12/0 2-8/0 -
UNC 25-74/2 13-71/0 7-79/0 7-59/1 5-27/0 DNP DNP 1-2/0 DNP DNP DNP DNP -
NC STATE 16-43/0 9-73/0 9-74/3 4-26/0 3-20/0 2-5/0 5-22/0 1-2/0 1-27/0 1-5/0 DNP DNP DNP -
MARYLAND 32-120/2 14-83/0 4-41/1 2-6/0 DNP 4-14/0 2-12/0 DNP DNP DNP -
UVA 26-115/2 11-35/0 5-24/0 4-28/0 4-37/0 DNP 1-5/0 1-24/0 DNP DNP DNP 1-4/0
MIAMI 20-36/1 10-29/0 5-28/0 3-16/0 4-14/0 2-1/0 2-9/0 DNP 1-2/0 DNP DNP DNP -
CLEMSON 27-176/1 15-68/1 7-37/2 4-52/0 2-16/0 DNP 9-42/0 DNP 1--2/0 DNP DNP DNP -
VA TECH 24-77/3 8-32/0 4-17/0 3-7/0 3-84/0 DNP 7-26/0 DNP DNP DNP DNP -
DUKE 17-136/1 13-66/2 DNP 4-37/1 7-64/1 DNP DNP 12-45/0 3-20/0 DNP DNP -
UGA 13-41/0 12-36/1 7-46/1 11-72/0 2-28/0 6-17/0 1-4/0 DNP DNP DNP DNP -
RECEIVING Hill, S. WR Smith, O. RB Melton, T. WR Jones, R. RB Zenon, T. RB Peeples, E. RB Perkins, C. RB Sims, D. RB
No.-Yds/TD 26-785/4 13-306/1 14-244/0 5-122/3 3-104/1 5-85/0 2-38/0 3-29/1
WCU 4-181/2 2-43/0 1-66/0 1-26/1 1-19/0 1-21/0 1-9/0 -
MTSU 3-126/1 2-85/1 1-3/0 -
KANSAS 1-4/0 2-108/1 1-52/1 -
UNC 6-151/1 1-21/0 2-12/0 1-0/0 DNP -
NC STATE 1-40/0 1-30/0 1-38/1 1-9/1
MARYLAND 2-50/0 2-37/0 2-27/0 -
UVA 1-21/0 1-3/0 -
MIAMI 1-9/0 3-26/0 1-14/0 1-16/0 DNP 1-12/0
CLEMSON 2-47/0 2-13/0 DNP -
VA TECH 2-43/0 2-55/0 DNP 1--1/0 -
DUKE 1-56/0 DNP 3-54/0 1-46/0 1-29/0 -
UGA 3-78/0 1-20/0 1-6/0 DNP 1-8/0
PUNT RETURNS Laskey, Z. Thomas, J. Dennis, C. Cummings, E.
No.-Yds 11-94 2-21 1-7 1--2
WCU 2-31 1--2
MTSU 1-0 -
KANSAS 4-27 -
UNC 1-7 -
NC STATE -
MARYLAND 2-29 -
UVA 1-16 -
MIAMI 1--9 -
CLEMSON DNP 1-7 -
VA TECH DNP -
DUKE DNP 1-14 -
UGA DNP -
KICK RETURNS Smith, O. Zenon, T. Peeples, E. Perkins, C. Hill, S. Jones, R. Thomas, J. Laskey, Z. Watson, R.
No.-Yds 18-352 9-202 6-109 2-39 1-28 1-17 1-16 1-6 1-2
WCU 2-51 -
MTSU 2-17 -
KANSAS 3-49 1-22 -
UNC 4-83 DNP 1-28 DNP
NC STATE 2-35 1-15 1-16 1-6 -
MARYLAND 3-115 -
UVA 2-22 1-24 -
MIAMI 2-37 1-8 DNP -
CLEMSON 2-45 DNP 1-17 DNP -
VA TECH 3-70 DNP DNP -
DUKE DNP 5-80 DNP 1-2
UGA DNP 1-29 DNP -
INT RETURNS Sweeting, R. Johnson, I. Thomas, J. Nealy, Q. Attaochu, J. Machen, B. Young, L.
No.-Yds 3-30 3-34 3-9 1-10 1-5 1-15 1-0
WCU 1-15 -
MTSU 1-0 -
KANSAS -
UNC 1--2 1-0 -
NC STATE 1-34 -
MARYLAND 1-0 1-10 DNP -
UVA 1-32 DNP -
MIAMI 1-5 -
CLEMSON 2-2 -
VA TECH -
DUKE 1-7 -
UGA 1-0
ALL-PURPOSE YDS Smith, O. Washington, T. Hill, S. Sims, D. Peeples, E. Jones, R. Zenon, T. Melton, T. Days, S. Lyons, P. Perkins, C. Laskey, Z. Thomas, J. Johnson, I. Watson, R. Sweeting, R. Godhigh, R. Machen, B. Connors, M. Nealy, Q. Dickey, D. Dennis, C. Attaochu, J. Hill, D. Cummings, E.
TOTAL 1274 890 840 727 616 577 392 248 237 202 173 100 75 34 32 30 18 15 12 10 9 7 5 5 -2
WCU 178 34 181 44 28 26 16 66 55 22 21 31 30 6 15 DNP 1 5 -2
MTSU 46 6 126 91 18 63 132 91 18 22 DNP DNP -
KANSAS 314 32 4 70 110 124 30 68 40 15 27 12 12 8 -
UNC 183 74 179 71 27 59 DNP 12 DNP DNP 2 DNP -2 DNP DNP 7 -
NC STATE 104 43 45 82 20 64 37 5 22 15 6 43 34 DNP DNP DNP -
MARYLAND 78 120 50 83 6 127 27 DNP 14 29 DNP DNP 10 DNP DNP -
UVA 45 115 24 35 37 28 22 7 DNP 5 24 16 32 DNP DNP DNP DNP -
MIAMI 91 36 9 41 30 16 8 14 1 9 DNP -9 2 DNP DNP DNP 5 -
CLEMSON 82 176 45 68 16 69 DNP 13 DNP 42 DNP 9 DNP DNP DNP -
VA TECH 87 77 43 32 83 7 DNP 55 DNP 26 DNP DNP DNP DNP -
DUKE DNP 136 56 66 190 37 20 54 DNP DNP 74 DNP 21 2 DNP DNP -
UGA 66 41 78 44 57 78 DNP 17 4 DNP DNP DNP DNP -
PASSING Tevin Washington Western Carolina Middle Tennessee Kansas North Carolina NC State Maryland Virginia Miami Clemson Virginia Tech Duke Georgia TOTALS
Att 13 8 7 14 12 19 8 12 9 10 13 10 135
Cmp 8 5 4 10 4 6 2 6 4 5 6 3 63
Int 0 0 0 1 0 1 2 1 1 0 0 2 8
Pct 61.5 62.5 57.1 71.4 33.3 31.6 25.0 50.0 44.4 50.0 46.2 30.0 46.7
2011 GEORGIA TECH FOOTBALL
Yds 271 202 164 184 117 114 24 63 60 97 185 34 1515
TD 3 2 2 1 2 0 0 0 0 0 0 0 10
Lng Sack 82 0 73 1 67 1 59 0 40 1 34 0 21 0 17 2 44 1 41 5 56 0 20 1 82 12
Yards 0 11 11 0 3 0 0 4 1 36 0 6 72
Effic 312.8 357.1 348.2 191.1 170.2 71.5 0.2 77.4 78.2 131.5 165.7 18.6 153.5
Synjyn Days Western Carolina Middle Tennessee Miami Georgia TOTALS
Att 3 2 2 5 12
Cmp 3 1 1 3 8
Int 0 0 0 0 0
Pct 100.0 50.0 50.0 60.0 66.7
Yds 94 12 14 78 198
TD 0 0 0 0 0
Lng Sack 66 0 12 0 14 0 36 1 66 1
Yards 0 0 0 5 5
Effic 363.2 100.4 108.8 191.0 205.3
Tyler Melton Georgia
Att 1
Cmp 0
Int 0
Pct 0.0
Yds 0
TD 0
Lng Sack 0 0
Yards 0
Effic 0.0
RAMBLINWRECK.COM
DEFENSE GAME-BY-GAME STATISTICS TACKLES Burnett, J. LB Johnson, I. Sweeting, R. CB Attaochu, J. LB Young, L. CB Reid, R. DB Nealy, Q. LB Thomas, J. DB Peters, J. DE Sylvester, S. LB Walls, L. DT Drummond, D. LB Cross, I. DE Cummings, E. DE Dieke, E. DE Watts, B. LB Machen, B. LB Barnes, T. DT Crenshaw, C. LB Laskey, Z. Peterson, M. DB Hill, D. Munroe, M. LB Golden, J. DB Dennis, C. DB Menocal, N. LB Scully, D. Perkins, C. Melton, T. Travis, K. LB Richardson, L. Jackson, C. Jones, R. Williams, A. DE Hill, S. Washington, T. Greene, J. Anderson, C. Moore, Ju. Green, S. DL Carter, M. LB
UA-A 58-55 44-25 36-19 31-21 24-28 21-29 22-25 29-13 16-24 19-19 14-23 14-18 14-16 10-11 11-7 6-9 7-6 3-8 4-6 3-5 5-3 4-4 8-0 5-2 5-2 2-2 2-2 2-1 2-0 1-1 2-0 0-1 1-0 0-1 1-0 1-0 1-0 0-1 1-0 0-1 1-0
TOTAL 113 69 55 52 52 50 47 42 40 38 37 32 30 21 18 15 13 11 10 8 8 8 8 7 7 4 4 3 2 2 2 1 1 1 1 1 1 1 1 1 1
WCU 7-5 5-1 4-1 3-2 3-3 2-1 0-2 2-3 3-3 0-2 3-4 2-1 0-3 0-2 1-2 1-3 2-2 0-1 2-0 1-1 0-1 1-0 DNP 1-1 1-0 1-0 1-0 0-1 0-1 DNP
MTSU 4-4 3-1 3-1 3-2 2-0 4-1 3-3 3-0 2-0 1-1 2-0 3-0 3-0 2-1 0-1 0-1 DNP 2-0 1-0 1-0 1-0 2-0 DNP 1-0 DNP
KANSAS 4-5 2-3 5-1 3-1 0-4 1-1 1-2 4-0 0-2 4-4 1-2 1-5 2-2 0-3 1-0 1-1 1-1 1-1 0-1 0-1 1-1 2-0 1-0 1-1 0-1 1-0 0-1 -
UNC 3-4 4-3 3-2 5-4 2-1 0-4 1-1 3-2 1-1 3-2 1-4 1-0 0-3 0-1 0-1 1-2 0-1 0-1 DNP 1-0 DNP DNP DNP 0-1 DNP -
NC STATE 7-5 3-0 3-1 4-2 4-1 1-2 0-1 1-0 2-2 2-1 1-5 4-4 2-0 1-2 1-0 1-0 2-3 1-0 3-0 1-1 1-0 DNP DNP -
MARYLAND 4-6 3-2 2-2 DNP 3-3 0-4 5-0 1-3 0-3 0-2 2-2 DNP 0-2 1-0 3-0 DNP 0-1 1-2 1-1 1-0 1-0 1-0 0-1 1-0 DNP DNP DNP -
UVA 5-4 5-3 2-3 DNP 1-3 3-4 4-6 0-2 2-6 0-6 1-2 DNP 3-2 0-1 2-1 0-1 0-1 DNP 0-1 DNP 0-1 1-0 DNP 0-1 DNP 1-0 1-0 DNP DNP -
MIAMI 5-1 2-1 2-0 5-0 2-0 2-0 0-1 4-0 2-0 2-1 2-0 2-1 4-0 1-0 1-0 1-0 0-1 DNP DNP DNP DNP -
CLEMSON 4-4 5-2 2-1 1-3 2-4 2-2 1-1 4-1 0-1 2-0 0-1 1-0 0-1 1-0 1-1 DNP DNP 1-0 1-0 DNP DNP DNP 1-0 DNP 1-0 DNP 1-0
VA TECH 7-6 3-3 4-4 5-5 0-4 3-1 1-3 0-1 2-3 5-2 1-4 0-3 1-0 1-1 DNP DNP 1-0 0-1 DNP 0-1 DNP DNP DNP DNP DNP -
DUKE 4-5 5-2 3-1 1-0 2-5 1-5 5-2 5-1 0-1 1-0 2-1 0-1 1-1 0-2 0-1 0-1 DNP 1-1 1-0 1-0 1-0 DNP 1-0 DNP DNP DNP DNP
UGA 4-6 4-4 3-2 1-2 3-0 2-4 1-3 2-0 2-2 2-0 2-3 0-2 1-2 0-2 1-0 DNP DNP DNP DNP DNP DNP DNP
SACKS Attaochu, J. LB Watts, B. LB Dieke, E. DE Peters, J. DE Sylvester, S. LB Crenshaw, C. LB Barnes, T. DT Munroe, M. LB Menocal, N. LB Burnett, J. LB Thomas, J. DB
UA-A 6-0 3-0 2-0 2-0 1-0 1-0 1-0 1-0 1-0 1-0 1-0
TOTAL 6.0 3.0 2.0 2.0 1.0 1.0 1.0 1.0 1.0 1.0 1.0
WCU 1.0-7 1.0-5 1.0-2 1.0-7 -
MTSU DNP -
KANSAS 1.0-1 -
UNC 3.0-23 1.0-3 1.0-5 1.0-7 1.0-6
NC STATE 1.0-8 1.0-10 -
MARYLAND DNP DNP 1.0-9 -
UVA DNP DNP 1.0-6 -
MIAMI -
CLEMSON 1.0-3 DNP 1.0-16 DNP -
VA TECH 1.0-2 DNP DNP -
DUKE -
UGA 1.0-13 DNP -
TACKLES FOR LOSS Burnett, J. LB Attaochu, J. LB Sylvester, S. LB Sweeting, R. CB Young, L. CB Thomas, J. DB Watts, B. LB Nealy, Q. LB Peters, J. DE Walls, L. DT Dieke, E. DE Cummings, E. DE Reid, R. DB Barnes, T. DT Johnson, I. Menocal, N. LB Cross, I. DE Crenshaw, C. LB Munroe, M. LB Peterson, M. DB
UA-A 7-5 8-1 3-2 2-2 2-2 3-0 3-0 1-4 2-1 1-2 2-0 1-2 1-1 1-1 1-1 1-1 0-2 1-0 1-0 0-1
TOTAL 9.5 8.5 4.0 3.0 3.0 3.0 3.0 3.0 2.5 2.0 2.0 2.0 1.5 1.5 1.5 1.5 1.0 1.0 1.0 0.5
WCU 2.0-4 1.0-7 0.5-4 1.0-5 1.0-2 0.5-0 0.5-1 1.0-7 0.5-5
MTSU 1.0-2 DNP -
KANSAS 1.0-7 1.0-1 1.0-1 0.5-1 0.5-0 -
UNC 3.0-23 1.0-7 1.0-3 1.0-6 1.0-5 1.0-3 -
NC STATE MARYLAND 1.0-3 DNP 1.0-2 1.0-8 DNP 1.0-4 1.0-9 1.0-10 -
UVA 1.0-6 DNP 1.0-1 0.5-2 0.5-1 0.5-1 0.5-0 DNP DNP
MIAMI 1.5-5 1.0-2 0.5-1 1.0-2 0.5-1 0.5-1 -
CLEMSON 1.0-5 1.0-3 0.5-0 1.5-17 DNP DNP -
VA TECH 1.5-2 2.5-7 1.0-3 0.5-1 0.5-1 0.5-0 0.5-1 1.0-9 DNP DNP -
DUKE 1.0-2 1.0-1 1.0-1 1.0-1 -
UGA 1.5-4 1.0-13 0.5-0 DNP -
FUMBLE RETURNS None
No.-Yds
FUMBLES F/R Attaochu, J. Burnett, J. Cross, I. Drummond, D. Johnson, I. Nealy, Q. Peters, J. Scully, D. Sweeting, R. Sylvester, S. Reid, R. Sweeting, R. Thomas, J. Watts, B. Young, L.
FF 1 1 1 1 0 0 0 1 1 1 1 1 1 1 1
WCU
FR 1 1 0 0 2 1 1 0 1 0 0 0 0 0 0
MTSU
WCU FR --FF -FR -------FF --
2011 GEORGIA TECH FOOTBALL
MTSU --FF -FR -FR ---FF -----
KANSAS
KANSAS -------FF -FF ------
UNC
NC STATE
UNC FF ---------------
MARYLAND
NC STATE ----------------
MARYLAND ----------------
UVA
UVA ----------------
MIAMI
MIAMI ----------------
CLEMSON
CLEMSON -FR ------FR ---FF -FF
VA TECH
VA TECH -FF --FR -----------
DUKE
DUKE -----------FF ----
UGA
UGA --------FF -------
RAMBLINWRECK.COM
PARTICIPATION No. 87 57 89 85 45 72 90 64 40 91 3A 95 94 99 10 16 1D 93 30 47 50 25 36 97 81 31 5 68 33 52 1 20 69 71 37 2 29 27 58 3C 70 80 46 4B 76 84 48 83 86 63 42 54 24 21 92 35 82 28 26 44 7 17 61 6 34 1C 14 55 43 77 88 96 13 32 11 56 3 8 9
Name GP/GS Alcala, M. 2/Alford, Ca. 5/Alvarez, J. 3/Anderson, C. 6/Attaochu, J. 10/9 Bailey, M. 2/Barnes, T. 12/Beno, R. 12/11 Burnett, J. 12/12 Carter, M. 8/Connors, M. 1/Crenshaw, C. 8/2 Cross, I. 12/12 Cummings, E. 12/Days, S. 6/Dennis, C. 12/Dickey, D. 2/Dieke, E. 12/Drummond, D. 10/5 Elakman, A. 1/Finch, J. 11/11 Godhigh, R. 5/Golden, J. 10/Green, S. 4/Greene, J. 11/Hill, D. 12/Hill, S. 12/12 Hogan, R. 1/Jackson, C. 12/Jackson, W. 12/12 Johnson, I. 12/12 Jones, R. 12/12 Kidney, T. 11/5 Lanier, J. 1/Laskey, Z. 8/Lee, V. 1/Lockhart, J. 2/Lyons, P. 10/Machen, B. 12/Mann, S. 1/Mason, S. 10/McKayhan, D. 12/McNair, T. 7/McNearney, S. 2/McRae, N. 12/1 Melton, T. 12/12 Menocal, N. 9/Moore, Je. 3/Moore, Ju. 12/Morgan, T. 5/Munroe, M. 12/1 Nealy, Q. 12/7 Peeples, E. 12/2 Perkins, C. 11/Peters, J. 12/12 Peterson, M. 11/1 Poole, S. 12/Reid, R. 12/12 Richardson, L. 4/Scully, D. 10/Sims, D. 12/11 Smith, O. 11/10 Smith, P. 10/8 Sweeting, R. 12/12 Sylvester, S. 12/9 Tanner, C. 1/Thomas, J. 12/1 Tobin, S. 8/Travis, K. 11/Uzzi, O. 12/12 Waller, D. 11/Walls, L. 12/12 Washington, T. 12/12 Watson, R. 11/Watts, B. 11/1 Williams, A. 4/Wright, M. 1/Young, L. 12/12 Zenon, T. 8/1
WCU XXX XXX XXX XXX START XXX XXX START START ... ... XXX START XXX XXX XXX XXX XXX START XXX START XXX ... XXX XXX XXX START ... XXX START START START START ... XXX XXX XXX XXX XXX XXX ... XXX XXX XXX XXX START XXX XXX XXX XXX XXX XXX XXX XXX START XXX XXX START XXX XXX START START ... START START XXX XXX ... XXX START XXX START START XXX XXX XXX ... START XXX
2011 GEORGIA TECH FOOTBALL
MTSU ... XXX ... XXX START ... XXX START START ... ... ... START XXX XXX XXX ... XXX XXX ... START XXX XXX XXX XXX XXX START ... XXX START START START START ... XXX ... ... XXX XXX ... XXX XXX XXX ... XXX START XXX XXX XXX XXX XXX START XXX XXX START START XXX START XXX ... XXX START ... START XXX ... XXX ... XXX START ... START START XXX XXX XXX ... START START
KANSAS XXX XXX XXX XXX START ... XXX START START XXX XXX XXX START XXX XXX XXX XXX XXX START ... START XXX XXX XXX XXX XXX START ... XXX START START START XXX ... XXX ... XXX XXX XXX ... XXX XXX XXX XXX XXX START XXX XXX XXX XXX XXX XXX XXX XXX START XXX XXX START XXX XXX START START START START START ... XXX ... XXX START XXX START START XXX XXX XXX ... START XXX
UNC ... ... ... XXX START ... XXX START START XXX ... XXX START XXX ... XXX ... XXX START ... START XXX XXX ... ... XXX START ... XXX START START START XXX ... XXX ... ... ... XXX ... ... XXX ... ... XXX START XXX ... XXX XXX XXX XXX XXX XXX START XXX XXX START ... ... START START START START START ... XXX ... XXX START XXX START START ... XXX ... ... START ...
NC STATE MARYLAND ... ... XXX ... ... XXX ... XXX START ... ... ... XXX XXX START START START START XXX XXX ... ... XXX START START START XXX XXX XXX ... XXX XXX ... ... XXX XXX START ... ... ... START START ... ... XXX XXX XXX ... XXX XXX XXX XXX START START ... ... XXX XXX START START START START START START START START XXX ... XXX XXX ... ... ... ... XXX XXX XXX XXX ... ... XXX XXX XXX XXX XXX XXX ... ... XXX XXX START START XXX XXX ... ... XXX XXX XXX ... XXX START XXX START XXX XXX XXX XXX START START XXX XXX XXX XXX START START XXX ... XXX XXX START START START START XXX XXX START START START XXX ... ... XXX XXX XXX XXX XXX XXX START START XXX XXX START START START START XXX XXX XXX ... ... ... ... ... START START XXX XXX
UVA ... ... ... ... ... ... XXX START START XXX ... XXX START XXX ... XXX ... XXX ... ... START ... XXX ... XXX XXX START ... XXX START START START XXX ... XXX ... ... XXX XXX ... XXX XXX ... ... XXX START ... ... XXX ... XXX START XXX XXX START ... XXX START ... XXX START START START START START ... XXX XXX XXX START XXX START START XXX START ... ... START XXX
MIAMI ... ... ... XXX START ... XXX START START XXX ... XXX START XXX XXX XXX ... XXX XXX ... START ... ... ... XXX XXX START ... XXX START START START ... ... XXX ... ... XXX XXX ... XXX XXX ... ... XXX START XXX ... XXX ... XXX START XXX ... START XXX XXX START ... XXX START START START START START ... XXX XXX XXX START XXX START START XXX XXX XXX XXX START XXX
CLEMSON ... ... ... ... START ... XXX START START XXX ... ... START XXX ... XXX ... XXX XXX ... ... ... XXX ... XXX XXX START XXX XXX START START START XXX ... ... ... ... XXX XXX ... XXX XXX ... ... START START ... ... XXX ... XXX START XXX XXX START XXX XXX START ... XXX START START START START XXX ... START XXX XXX START XXX START START XXX XXX ... ... START ...
VA TECH ... ... ... ... START ... XXX XXX START XXX ... ... START XXX ... XXX ... XXX XXX ... START ... XXX ... XXX XXX START ... XXX START START START START ... ... ... ... XXX XXX ... XXX XXX XXX ... XXX START ... ... XXX ... XXX START XXX XXX START XXX XXX START ... XXX START START START START START ... XXX XXX ... START XXX START START XXX XXX ... ... START ...
DUKE ... ... ... ... XXX ... XXX START START ... ... START START XXX ... XXX ... XXX XXX ... START XXX XXX ... XXX XXX START ... XXX START START START XXX ... ... ... ... ... XXX ... XXX XXX XXX ... XXX START XXX ... XXX ... XXX START START XXX START XXX XXX START ... XXX START ... START START START ... XXX XXX XXX START XXX START START XXX XXX ... ... START XXX
UGA ... XXX ... ... START XXX XXX START START ... ... ... START XXX XXX XXX ... XXX START ... START ... XXX ... XXX XXX START ... XXX START START START XXX ... ... ... ... XXX XXX ... XXX XXX ... ... XXX START XXX ... XXX ... XXX XXX START XXX START XXX XXX START ... XXX START XXX START START START ... XXX XXX XXX START XXX START START XXX XXX ... ... START ...
RAMBLINWRECK.COM
MISCELLANEOUS STATISTICS 4 4 1 1 2 2 1 2 2 4 1 3 4 2 2 2 3 4 4 1 2 3 4 4 1 2 2 3 3
SCORING DRIVES GEORGIA TECH -----------------------------------------------------------------------------------Opponent Qtr TD FG Player(s) Scoring Play Plays Yds Time Western Carolina 1 x Orwin Smith 5-yard run 1 5 0:06 1 x Washington to S. Hill 82-yard pass 4 95 1:38 1 x Orwin Smith 77-yard run 2 80 0:49 1 x Synjyn Days 7-yard run 3 75 1:08 2 x David Sims 3-yard run 7 41 2:55 2 x Washington to Jones 26-yard pass 4 60 1:13 3 x Preston Lyons 20-yard run 6 58 2:36 3 x Washington to S. Hill 77-yard pass 3 81 0:52 4 x Deon Hill 5-yard run 15 74 7:35 Middle Tennessee 1 x Washington to Zenon 73-yard pass 1 73 0:14 1 x Tevin Washington 2-yard run 17 98 9:25 1 x Washington to Hill 71-yard pass 1 71 0:11 2 x Tevin Washington 7-yard run 7 90 3:24 3 x Orwin Smith 2-yard run 11 85 6:00 3 x Synjyn Days 5-yard run 8 63 4:13 4 x Synjyn Days 1-yard run 16 73 9:41 Kansas 1 x Orwin Smith 95-yard run 1 95 0:14 1 x Roddy Jones 4-yard run 4 44 1:43 2 x David Sims 19-yard run 5 72 1:25 2 x Justin Moore 24-yard field goal 8 73 3:09 3 x Embry Peeples 63-yard run 1 63 0:11 3 x Washington to O. Smith 67-yard pass 4 74 2:23 3 x Washington to Jones 52-yard pass 1 52 0:07 3 x David Sims 21-yard run 6 74 2:17 4 x Synjyn Days 2-yard run 10 68 5:23 4 x Charles Perkins 3-yard run 8 75 4:16 North Carolina 1 x Justin Moore 40-yard field goal 9 59 5:05 2 x Washington to S. Hill 59-yard pass 1 59 0:08 2 x Roddy Jones 2-yard run 12 79 5:05 3 x Justin Moore 36-yard field goal 10 62 5:06 3 x Tevin Washington 1-yard run 13 81 6:05 4 x Tevin Washington 5-yard run 4 61 1:55 NC State 1 x Orwin Smith 13-yard run 10 64 3:18 1 x Orwin Smith 9-yard run 6 68 3:09 2 x Washington to Sims 9-yard pass 7 48 2:44 4 x Orwin Smith 2-yard run 13 67 7:55 4 x Isaiah Johnson 34-yard INT return ---4 x Washington to Jones 38-yard pass 1 38 0:06 4 x Justin Moore 40-yard field goal 4 1 2:04 Maryland 1 x Tevin Washington 7-yard run 8 63 3:57 2 x Orwin Smith 10-yard run 7 33 3:10 3 x Tevin Washington 3-yard run 5 17 1:56 Virginia 2 x Tevin Washington 7-yard run 11 80 4:55 2 x Rod Sweeting 32-yard INT return ---3 x Tevin Washington 1-yard run 19 85 9:31 Miami 2 x Tevin Washington 1-yard run 20 92 9:15 Clemson 1 x Orwin Smith 1-yard run 6 19 2:58 2 x Justin Moore 23-yard field goal 8 71 3:15 2 x Orwin Smith 3-yard run 10 80 4:19 2 x Tevin Washington 3-yard run 9 78 3:45 3 x David Sims 11-yard run 5 77 1:58 Virginia Tech 1 x Tevin Washington 2-yard run 13 80 6:39 2 x Justin Moore 41-yard field goal 8 57 3:21 2 x Justin Moore 36-yard field goal 6 61 0:44 3 x Tevin Washington 1-yard run 8 74 3:35 3 x Tevin Washington 1-yard run 7 84 2:55 Duke 1 x David Sims 4-yard run 8 67 3:21 1 x Roddy Jones 1-yard run 5 59 2:11 2 x David Sims 1-yard run 8 91 3:37 2 x Embry Peeples 1-yard run 11 94 5:21 3 x Justin Moore 25-yard field goal 12 78 4:46 4 x Tevin Washington 39-yard run 7 81 2:53 Georgia 2 x Justin Moore 22-yard field goal 11 76 5:07 2 x David Sims 5-yard run 14 80 7:07 4 x Orwin Smith 16-yard run 6 65 2:26 OPPONENTS --------------------------------------------------------------------------------------Team Qtr TD FG Player(s) Scoring Play Plays Yds Time Western Carolina 2 x Brandon Pechloff 2-yard run 1 4 0:05 2 x Michael Vaughn 4-yard run 13 64 4:15 69-yard blocked punt ---2 x Isaiah Moore Middle Tennessee 2 x D.D. Kyles 15-yard run 11 68 3:41 4 x Benny Cunningham 1-yard run 5 38 1:32 4 x Murphy to McDonald 18-yard pass 9 68 2:23 Kansas 1 x Darrian Miller 10-yard run 11 72 5:16 2 x Darrian Miller 11-yard run 13 71 5:57 2 x Alex Mueller 28-yard field goal 5 65 0:35 4 x Mecham to Turzilli 10-yard pass 9 63 2:41 North Carolina 1 x Giovani Bernard 4-yard run 8 63 3:25 3 x Renner to Hurst 6-yard pass 5 74 2:04 4 x Renner to Ebron 20-yard pass 5 64 1:25 4 x Giovani Bernard 55-yard run 4 61 1:55 NC State 2 x Glennon to Smith 9-yard pass 9 49 2:39 3 x James Washington 46-yard run 1 46 0:09 4 x Glennon to Purvis 1-yard pass 6 65 2:11 4 x Brosius to Purvis 13-yard pass 13 76 4:54 4 x Brandan Bishop 33-yard fumble ret. ---Maryland 1 x Nick Ferrara 30-yard field goal 14 68 6:59
2011 GEORGIA TECH FOOTBALL
Virginia
Miami
Clemson
Virginia Tech
Duke
Georgia
x x x x x x x x x x x x x x x x x x x x x x x x x x x x x
C.J. Brown Davin Meggett Kevin Parks Rocco to T. Smith Clifton Richardson Robert Randolph Mike James JoJo Nicolas Lamar Miller Jake Wieclaw Chandler Catanzaro Boyd to Watkins Brandon Thomas Logan Thomas Thomas to Boykin Thomas to Coale Logan Thomas Thomas to Drager Cody Journell Renfree to Vernon Renfree to Varner Will Snyderwine Renfree to Helfet Renfree to Helfet Murray to Bennett Murray to Conley Blair Walsh Murray to King Murray to White
77-yard run 1-yard run 6-yard run 37-yard pass 22-yard run 36-yard field goal 2-yard run 0-yd fumble recovery 14-yard run 39-yard field goal 34-yard field goal 48-yard pass 0-yd fumble recovery 1-yard run 9-yard pass 63-yard pass 12-yard run 14-yard pass 23-yard field goal 15-yard pass 12-yard pass 35-yard field goal 3-yard pass 10-yard pass 15-yard pass 14-yard pass 41-yard field goal 3-yard pass 3-yard pass
1 10 12 2 10 8 12 -3 11 12 4 10 9 7 1 8 7 8 4 13 15 11 7 5 8 8 3 6
77 53 73 45 72 41 46 -46 44 67 70 97 36 70 63 74 31 52 59 80 55 73 67 76 80 58 36 38
0:13 2:57 5:53 0:43 4:24 2:30 5:24 -0:37 4:54 4:37 1:19 3:39 4:37 2:46 0:12 3:51 3:50 4:42 1:11 6:31 5:17 4:21 2:49 3:13 3:56 1:04 1:24 3:34
PUNT-BY-PUNT SEAN POOLE Opponent Western Carolina Middle Tennessee Kansas North Carolina
NC State Maryland
Virginia
Miami
Clemson
Virginia Tech
Duke Georgia
Qtr 2 3 2 2 1 4 4 4 2 3 3 4 4 1 4 4 4 1 2 4 1 1 4 2 2 4 1 1 1 1 3
CHANDLER ANDERSON Opponent Qtr Maryland 2 3 Miami 3 3
From GT35 GT34 GT17 GT41 KU40 GT47 NC48 NC45 GT12 GT25 GT42 GT25 GT33 GT18 GT36 GT47 GT40 GT25 GT43 GT16 GT40 GT21 GT28 GT07 GT33 GT15 GT17 GT34 GT35 GT47 GT22
To WC24 WC26 MT34 MT4 KU3 NC38 EZ NC16 GT49 50 MD19 MD47 MD20 VA42 VA28 VA29 VA23 UM23 UM44 UM37 CU17 CU36 CU26 GT37 VT29 VT41 DU35 DU27 GA11 GA23 GA31
YDS 41 40 49 55 37 15 48 29 37 25 39 28 47 40 36 24 37 52 13 47 43 43 46 30 38 44 48 39 54 30 47
Return 2 13 -2 Downed Downed Downed Touchback OB FC 2 4 OB -1 13 FC OB FC -2 OB FC Downed FC FC Downed OB Downed 6 OB 0 OB 4
NET 39 27 61 55 37 15 28 29 37 23 35 28 48 27 36 24 37 54 13 47 43 43 46 30 38 44 42 39 54 30 43
FP WC26 WC39 MT32 MT4 KU 3 NC38 NC20 NC16 GT49 GT46 MD23 MD47 MD19 GT45 VA28 VA29 VA23 UM21 UM44 UM37 CU17 CU36 CU26 GT37 VT29 VT41 DU41 DU27 GA11 GA23 GA35
From GT46 GT26 GT27 GT31
To MD12 MD39 UM34 UM35
YDS 42 35 39 34
Return Downed Downed FC FC
NET 42 39 39 34
FP MD12 MD39 UM34 UM35
TOUCHDOWN DRIVES SUMMARY Touchdown Touchdown Touchdown Touchdown Touchdown Touchdown Touchdown Touchdown Touchdown Touchdown Touchdown Touchdown Touchdown
Tech Opponents plays of 20-plus yards . . . . . . . . . . . . . . . . . . . . . .15 . . . . . . . . . .9 plays of 50-plus yards . . . . . . . . . . . . . . . . . . . . . .10 . . . . . . . . . .4 drives of 80-plus yards . . . . . . . . . . . . . . . . . . . . .18 . . . . . . . . . .3 drives of 90-plus yards . . . . . . . . . . . . . . . . . . . . . .7 . . . . . . . . . . .1 drives of 20 yards or less . . . . . . . . . . . . . . . . . . . .3 . . . . . . . . . . .1 drives of 5:00 or more . . . . . . . . . . . . . . . . . . . . .13 . . . . . . . . . .5 drives of 7:00 or more . . . . . . . . . . . . . . . . . . . . . .7 . . . . . . . . . . .0 drives of 3:00 or less . . . . . . . . . . . . . . . . . . . . . .27 . . . . . . . . . .21 drives of 2:00 or less . . . . . . . . . . . . . . . . . . . . . .18 . . . . . . . . . .13 drives of 1:00 or less . . . . . . . . . . . . . . . . . . . . . .10 . . . . . . . . . .7 drives of 5 plays or less . . . . . . . . . . . . . . . . . . . . .20 . . . . . . . . . .15 drives of 10 plays or more . . . . . . . . . . . . . . . . . . .16 . . . . . . . . . .12 drives of 1 play . . . . . . . . . . . . . . . . . . . . . . . . . . .8 . . . . . . . . . . .4
RAMBLINWRECK.COM
BIG PLAYS BIG PLAYS Plays of 20 yards or more GEORGIA TECH No. 1 2 3 4 5 6 7 8 9 10 11 12 13 14 15 16 17 18 19 20 21 22 23 24 25 26 27 28 29 30 31 32 33 34 35 36 37 38 39 40 41 42 43 44 45 46 47 48 -49 50 51 52 53 54 55 56 57 58 59
Opponent Western Carolina
Middle Tennessee
Kansas
North Carolina
NC State
Maryland
Virginia
Miami Clemson
Virginia Tech
Duke
Player(s) Washington to S. Hill Orwin Smith Days to Melton Washington to Peeples Washington to Jones Washington to O. Smith Preston Lyons Washington to S. Hill Synjyn Days Richard Watson Washington to Zenon Washington to S. Hill Washington to S. Hill Synjyn Days Orwin Smith Orwin Smith Roddy Jones Roddy Jones Embry Peeples Washington to O. Smith Embry Peeples Washington to O. Smith Tevin Washington David Sims Preston Lyons Synjyn Days Synjyn Days Washington to O. Smith Orwin Smith Washington to S. Hill Washington to S. Hill Washington to S. Hill David Sims Roddy Jones Jemea Thomas Washington to S. Hill Orwin Smith David Sims Washington to Smith Washington to Jones Washington to Melton Tevin Washington David Sims Washington to S. Hill Washington to O. Smith Embry Peeples Stephen Hill Tevin Washington None Tevin Washington Roddy Jones Washington to S. Hill Tevin Washington Embry Peeples Washington to Melton Washington to S. Hill Tevin Washington Embry Peeples Tevin Washington Embry Peeples
Play Pass Run Pass Pass Pass Pass Run Pass Run Run Pass Pass Pass Run Run Run Run Run Run Pass Run Pass Run Run Run Run Run Pass Run Pass Pass Pass Run Run Run Pass Run Run Pass Pass Pass Run Run Pass Pass Run Run Run
Down/Dist. 2nd & 11 2nd & 7 2nd & 8 1st & 10 1st & 10 2nd & 10 1st & 10 3rd & 6 3rd & 5 1st & 10 1st & 10 1st & 10 1st & 10 1st & 10 1st & 10 2nd & 3 1st & 10 1st & 10 3rd & 3 3rd & 5 1st & 10 1st & 15 3rd & 2 1st & 10 2nd & 5 2nd & 8 4th & 3 1st & 10 2nd & 7 1st & 10 1st & 10 3rd & 5 3rd & 3 2nd & 6 4th & 10 1st & 10 2nd & 7 1st & 10 2nd & 13 1st & 10 1st & 10 1st & 20 2nd & 10 2nd & 15 3rd & 8 1st & 10 1st & 10 4th & 5
Run Run Pass Run Run Pass Pass Run Run Run Run
2nd & 5 1st & 10 1st & 10 3rd & 6 3rd & 5 1st & 10 1st & 10 2nd & 9 2nd & 7 1st & 10 2nd & 9
Yds *82 *77 66 21 *26 33 *20 *77 22 28 *73 *71 43 28 *95 22 33 35 21 41 *63 *67 28 *21 36 30 21 21 36 *59 34 25 22 48 % 27 40 28 41 30 *38 21 21 39 34 25 27 24 23 46 21 44 56 39 41 41 35 39 29 22
60 61 62 63 64 65 66 67 68 69 70 71 72 73
Georgia
Tevin Washington Washington to Melton Tevin Washington Washington to Peeples Washington to S. Hill Washington to Perkins Embry Peeples Roddy Jones Tevin Washington Tevin Washington Washington to O. Smith Embry Peeples Washington to Hill Days to Hill
Run Pass Run Pass Pass Pass Run Run Run Run Pass Run Pass Pass
2nd & 7 24 1st & 10 31 2nd & 7 21 2nd & 9 46 3rd & 4 56 2nd & 10 29 1st & 10 22 2nd & 10 26 2nd & 9 *39 1st & 10 23 2nd & 8 20 2nd & 8 27 1st & 10 36 2nd & 10 32 * Touchdown & Fake punt
Player(s) Pechloff to Alexander Pechloff to Cockrell Petey Boone Kilgore to Amos Banks to Cunningham Webb to Biere Webb to Beshears Giovani Bernard Renner to D. Jones Renner to Ebron Giovani Bernard Renner to Ebron Glennon to Howard James Washington Tony Creecy Logan to Dorsey C.J. Brown Rocco to T. Smith Rocco to Burd Clifton Richardson Perry Jones Harris to Streeter Harris to Streeter Boyd to Watkins Boyd to Watkins Boyd to Watkins Thomas to Boykin David Wilson Thomas to Coale Thomas to Coale Thomas to Coles David Wilson David Wilson Donovan Varner Renfree to Braxton Murray to Boykin Malcolm Mitchell Murray to Charles Aaron Murray Murray to Charles Alec Ogletree
Play Pass Pass Run Pass Pass Pass Pass Run Pass Pass Run Pass Pass Run Run Pass Run Pass Pass Run Run Pass Pass Pass Pass Pass Pass Run Pass Pass Pass Run Run Run Pass Pass Run Pass Run Pass Run
Down/Dist. Yds 2nd & 10 21 3rd & 7 21 1st & 10 33 1st & 10 20 1st & 10 27 3rd & 9 28 1st & 10 42 1st & 10 25 1st & 10 41 1st & 10 20 1st & 10 *55 3rd & 9 24 4th & 8 28 1st & 10 *46 2nd & 2 27 1st & 10 34 1st & 10 *77 2nd & 2 *37 2nd & 4 30 1st & 10 *22 1st & 10 23 2nd & 10 48 1st & 10 32 2nd & 10 *48 2nd & 4 28 1st & 10 26 3rd & 13 33 1st & 10 26 1st & 10 *63 3rd & 12 34 3rd & 11 38 2nd & 5 44 1st & 10 25 1st & 10 39 2nd & 9 41 1st & 10 28 1st & 10 20 2nd & 8 31 2nd & 10 22 2nd & 5 28 3rd & 2 21 * Touchdown
OPPONENTS No. 1 2 3 4 5 6 7 8 9 10 11 12 13 14 15 16 17 18 19 20 21 22 23 24 25 26 27 28 29 30 31 32 33 34 35 36 37 38 39 40 41
Opponent Western Carolina
Middle Tennessee Kansas North Carolina
NC State
Maryland Virginia
Miami Clemson
Virginia Tech
Duke Georgia
BIG PLAYS SUMMARY PLAYS OF 20-29 Total (Rushing/Receiving) Synjyn Days, QB 3 (3/0) Stephen Hill, WR 2 (1/1) Roddy Jones, RB 3 (2/1) Preston Lyons, RB 1 (1/0) Tyler Melton, WR 1 (0/1) Embry Peeples, RB 6 (5/1) Charles Perkins, RB 1 (0/1) David Sims, RB 2 (2/0) Orwin Smith, RB 5 (2/3) Jemea Thomas, DB 1 (1/0) Tevin Washington, QB 7 (7/0) Richard Watson, RB 1 (1/0) Tony Zenon, RB -TOTAL Opponents PASSING Synjyn Days Tevin Washington TOTAL
30-39
40-49
50-59
60-69
70-79
80-89
90-99
Total
1 4 3 1 1 2
-4 (0/4) 1 (1/0) -1 (0/1) 1 (0/1) -1 (1/0) 1 (0/1) -1 (1/0) ---
-2 (0/2) --------1 (1/0) ---
----1 (0/1) 1 (1/0) --1 (0/1) -----
-2 (0/2) ------1 (1/0) ---1 (0/1)
-1 (0/1) ------------
--------1 (1/0) -----
4 (4/0) 15 (1/14) 7 (5/2) 2 (2/0) 4 (0/4) 10 (8/2) 1 (0/1) 4 (4/0) 12 (5/7) 1 (1/0) 11 (11/0) 1 (1/0) 1 (0/1)
33 (25/8) 18 (10/8) 10 (3/7) 3 (1/2) 21 (9/12) 10 (2/8) 7 (2/5) 1 (1/0)
3 (1/2) 1 (0/1)
4 (1/3) 1 (1/0)
1 (0/1) --
1 (1/0) --
73 (42/31) 41 (15/26)
60-69 1 1 2
70-79 -3 3
80-89 -1 1
90-99 ----
Total 2 29 31
20-29 -8 8
(1/0) (0/4) (2/1) (1/0) (0/1) (2/0) -1 (1/0) 3 (1/2) -2 (2/0) ---
30-39 1 7 8
2011 GEORGIA TECH FOOTBALL
40-49 -7 7
50-59 -2 2
RAMBLINWRECK.COM
MISCELLANEOUS STATISTICS RESULT OF TECH TURNOVERS Opponent Western Carolina
Qtr Turnover (Player) Defender(s) 1 Fumble (Perkins) (r) Rainey 2 Fumble (Cummings) (r) Carson Middle Tennessee 4 Fumble (Perkins) (c) Fennell/(r) Fennell Kansas None North Carolina 2 Fumble (Washington) (r) Boston 2 INT (Washington) Boston NC State 4 Fumble (Days) (c) Wolff/(r) Bishop Maryland 2 INT (Washington) McDougle Virginia 2 INT (Washington) Minnifield 2 INT (Washington) Nicholsan Miami 1 INT (Washington) Nicolas 2 Fumble (Laskey) Nicolas 3 Fumble (Days) (c) Perryman/(r)Chickillo Clemson 3 Fumble (Washington) (c) Moore/(r) Moore 4 INT (Washington) Hall Virginia Tech None Duke 3 Fumble (Peeples) (c) Canty/(r) Sarmiento 4 Fumble (Perkins) (r) Hatcher Georgia 3 INT (Washington) Gilliard 3 INT (Washington) S. Williams Georgia Tech’s 18 turnovers resulted in 52 opponent points.
Led To Pts End of half 0 Touchdown 7 Touchdown 7 Punt Interception Touchdown End of half Field Goal End of half Touchdown Touchdown Interception Touchdown Interception
0 0 7 0 3 0 7 7 0 7 0
Punt Interception Punt Touchdown
0 0 0 7
RESULT OF OPPONENT TURNOVERS Opponent Western Carolina
Qtr Turnover (Player) Defender(s) 1 Fumble (Pechloff) (c) Watts/(r) Nealy (c) Drummond/(r) Attaochu 2 Fumble (Mitchell) 4 INT (Brindise) Machen Middle Tennessee 2 INT (Kilgore) I. Johnson 2 Fumble (Mason) (c) Reid/(r) I. Johnson 4 Fumble (Gray) (c) Cross/(r) Peters Kansas None North Carolina 2 INT (Renner) I. Johnson 4 INT (Renner) Sweeting NC State 4 INT (Glennon) I. Johnson Maryland 2 INT (O’Brien) Nealy 3 INT (Brown) Sweeting Virginia 2 INT (Rocco) Sweeting Miami 3 INT (Harris) Attaochu Clemson 1 Fumble (Howard) (c) Young/(r) Sweeting 3 Fumble (Bellamy) (c) Thomas/(r) Burnett 4 INT (Boyd) Thomas 4 INT (Boyd) Thomas Virginia Tech 3 Fumble (Wilson) (c) Burnett/(r) Johnson Duke 4 INT (Renfree) Thomas Georgia 1 INT (Murray) Young Opponents’ 20 turnovers resulted in 56 Georgia Tech points.
Led To Pts Touchdown 7 Touchdown 7 Downs 0 Touchdown 7 Punt 0 Fumble 0 Touchdown Punt Touchdown Missed FG Punt Touchdown Punt Touchdown Fumble Downs End of Game Touchdown End of Game Punt
7 0 7 0 0 7 0 7 0 0 0 7 0 0
GEORGIA TECH FUMBLES Western Carolina 1 Tevin Washington 1 Charles Perkins 2 Tevin Washington 2 Euclid Cummings (pr) 2 Tevin Washington 3 Synjyn Days Middle Tennessee 2 Tevin Washington 4 Charles Perkins Kansas 2 Charles Perkins North Carolina 2 Tevin Washington NC State 1 Orwin Smith 2 Preston Lyons 4 Tevin Washington 4 Synjyn Days
Recovered Lost Recovered Lost Recovered Recovered Recovered Lost Recovered Lost Recovered Recovered Recovered Lost
2011 GEORGIA TECH FOOTBALL
Maryland 3 Tevin Washington Virginia 4 Tevin Washington Miami 2 Zach Laskey 3 Synjyn Days 4 Tevin Washington Clemson 3 Tevin Washington Virginia Tech 2 Tevin Washington 2 Orwin Smith 3 Tevin Washington Duke 1 Tevin Washington 3 Embry Peeples 4 Charles Perkins Georgia 4 Tevin Washington
Recovered Recovered Lost (TD) Lost Recovered Lost Recovered Recovered Recovered Recovered Lost Lost Recovered
RAMBLINWRECK.COM
SUPERLATIVES TEAM Georgia Tech High Georgia Tech Low Opponent High Opponent Low Points . . . . . . . . . . . . . . . . . . .66 vs. Kansas (9.17) . . . . . . . . . . . . . . . . . . .7 at Miami (10.22) . . . . . . . . . . . . . . . .37 by Virginia Tech (11.10) . . . . . . . . . .16 by Maryland (10.8) Points/half . . . . . . . . . . . . . . .42 (1st) vs. Western Carolina (9.1) . . . . . . . . .0 (2nd) at Miami (10.22) . . . . . . . . . . . .28 (2nd) by NC State (10.1) . . . . . . . . .0 (2nd) by Western Carolina (9.1) . . . . . . . . . . . . . . . . . . . . . . . .42 (2nd) vs. Kansas (9.17) . . . . . . . . . . . . . . . . . . . . . . . . . . . . . . . . . . . . . . . . . . . . . . . . . . . . . . . . . . . . . . . . . . . . . . . . . .0 (2nd) by Virginia (10.15) Points/quarter . . . . . . . . . . . .28 (1st) vs. Western Carolina (9.1) . . . . . . . . .0, 11 times . . . . . . . . . . . . . . . . . . . . .21, three times . . . . . . . . . . . . . . . . . .0, 16 times . . . . . . . . . . . . . . . . . . . . . . . .28 (3rd) vs. Kansas (9.17) First downs . . . . . . . . . . . . . . .29 at Middle Tennessee (9.10) . . . . . . . . . . . .14 at Miami (10.22) . . . . . . . . . . . . . . .22 by NC State (10.1) . . . . . . . . . . . . . .14 by Miami (10.22) First downs by rushing . . . . . .24 at Middle Tennessee (9.10) . . . . . . . . . . . .9 at Miami (10.22) . . . . . . . . . . . . . . . .15 by Virginia (10.15) . . . . . . . . . . . . . .4 by Clemson (10.29) First downs by passing . . . . . .10 vs. Western Carolina (9.1) . . . . . . . . . . . . .1 at Virginia (10.15) . . . . . . . . . . . . . . .14 by Clemson (10.29) . . . . . . . . . . . . .4 by Maryland (10.8) . . . . . . . . . . . . . . . . . . . . . . . . . . . . . . . . . . . . . . . . . . . . . . . . . . . . . . . . . . .1 vs. Clemson (10.29) . . . . . . . . . . . . . .14 by Duke (11.19) First downs by penalty . . . . . .3 at NC State (10.1) . . . . . . . . . . . . . . . . . . .0, seven times . . . . . . . . . . . . . . . . . . .2, three times . . . . . . . . . . . . . . . . . . .0, four times . . . . . . . . . . . . . . . . . . . . . . . .3 vs. Virginia Tech (11.10) Net yards rushing . . . . . . . . . .*604 vs. Kansas (9.17) . . . . . . . . . . . . . . . . .134 at Miami (10.22) . . . . . . . . . . . . . .272 by Virginia (10.15) . . . . . . . . . . . . .95 by Clemson (10.29) Rushing attempts . . . . . . . . . .67 vs. Clemson (10.29) . . . . . . . . . . . . . . . . .48 vs. Western Carolina (9.1) . . . . . . . .52 by Virginia Tech (11.10) . . . . . . . . . .24 by Clemson (10.29) . . . . . . . . . . . . . . . . . . . . . . . . . . . . . . . . . . . . . . . . . . . . . . . . . . . . . . . . . . .48 at Miami (10.22) . . . . . . . . . . . . . . . . . . . . . . . . . . . . . . . . . . . . . . . . . . . . .24 by Duke (11.19) Average per rush . . . . . . . . . .#12.1 vs. Kansas (9.17) . . . . . . . . . . . . . . . . .4.5 vs. Maryland (10.8) . . . . . . . . . . . . .6.0 by Maryland (10.8) . . . . . . . . . . . . .2.6 by Western Carolina (9.1) Rushing touchdowns . . . . . . .7 vs. Kansas (9.17) . . . . . . . . . . . . . . . . . . . .1 at Miami (10.22) . . . . . . . . . . . . . . . .2, eight times . . . . . . . . . . . . . . . . . . . .0 by Duke (11.19) . . . . . . . . . . . . . . . . . . . . . . . . . . . . . . . . . . . . . . . . . . . . . . . . . . . . . . . . . . . . . . . . . . . . . . . . . . . . . . . . . . . . . . . . . . . . . . . . . . . . . . . . . . . . . . . . . . . . . .0 by Georgia (11.26) Net yards passing . . . . . . . . . .365 vs. Western Carolina (9.1) . . . . . . . . . . . .24 at Virginia (10.15) . . . . . . . . . . . . . .304 by Clemson (10.29) . . . . . . . . . . . .87 by Maryland (10.8) Pass completions . . . . . . . . . .11 vs. Western Carolina (9.1) . . . . . . . . . . . . .2 at Virginia (10.15) . . . . . . . . . . . . . . .26 by Duke (11.19) . . . . . . . . . . . . . . .6 by Maryland (10.8) Pass attempts . . . . . . . . . . . . .21 vs. Maryland (10.8) . . . . . . . . . . . . . . . . . .7 vs. Kansas (9.17) . . . . . . . . . . . . . . . .44 by Duke (11.19) . . . . . . . . . . . . . . .13 by Virginia Tech (11.10) Passes had intercepted . . . . .2 at Virginia (10.15) . . . . . . . . . . . . . . . . . . .0, six times . . . . . . . . . . . . . . . . . . . . .2, three times . . . . . . . . . . . . . . . . . . .0 by Kansas (9.17) . . . . . . . . . . . . . . . . . . . . . . . .2 vs. Georgia (11.26) . . . . . . . . . . . . . . . . . . . . . . . . . . . . . . . . . . . . . . . . . . . . . . . . . . . . . . . . . . . . . . . . . . . . . . . . . . . . . .0 by Virginia Tech (11.10) Passing touchdowns . . . . . . .3 vs. Western Carolina (9.1) . . . . . . . . . . . . . .0, seven times . . . . . . . . . . . . . . . . . . .4 by Duke (11.19) . . . . . . . . . . . . . . . .0, three times . . . . . . . . . . . . . . . . . . . . . . . . . . . . . . . . . . . . . . . . . . . . . . . . . . . . . . . . . . . . . . . . . . . . . . . . . . . . . . . . . . . . . . . .4 by Georgia (11.26) Total offense . . . . . . . . . . . . . .%768 vs. Kansas (9.17) . . . . . . . . . . . . . . . . .211 at Miami (10.22) . . . . . . . . . . . . . .476 by Virginia Tech (11.10) . . . . . . . . .262 by Miami (10.22) Total offensive plays . . . . . . .81 vs. Maryland (10.8) . . . . . . . . . . . . . . . . . .57 vs. Kansas (9.17) . . . . . . . . . . . . . . .77 by Western Carolina (9.1) . . . . . . . . .52 by North Carolina (9.24) Average gain per play . . . . . .13.5 vs. Kansas (9.17) . . . . . . . . . . . . . . . . . .3.4 at Miami (10.22) . . . . . . . . . . . . . . .7.3 by Virginia Tech (11.10) . . . . . . . . . .3.9 by Western Carolina (9.1) Fumbles . . . . . . . . . . . . . . . . .6 vs. Western Carolina (9.1) . . . . . . . . . . . . . .1, six times . . . . . . . . . . . . . . . . . . . . .3, three times . . . . . . . . . . . . . . . . . . .0 by Maryland (10.8) Fumbles lost . . . . . . . . . . . . . .2, three times . . . . . . . . . . . . . . . . . . . . . . . .0, five times . . . . . . . . . . . . . . . . . . . . .2, three times . . . . . . . . . . . . . . . . . . .0, eight times Total turnovers . . . . . . . . . . . .3 at Miami (10.22) . . . . . . . . . . . . . . . . . . . . .0 vs. Kansas (9.17) . . . . . . . . . . . . . . . .4 by Clemson (10.29) . . . . . . . . . . . . . .0 by Kansas (9.17) . . . . . . . . . . . . . . . . . . . . . . . . . . . . . . . . . . . . . . . . . . . . . . . . . . . . . . . . . . .0 vs. Virginia Tech (11.10) Penalties . . . . . . . . . . . . . . . . .8 vs. Maryland (10.8) . . . . . . . . . . . . . . . . . .2 at Miami (10.22) . . . . . . . . . . . . . . . .7 by NC State (10.1) . . . . . . . . . . . . . . .1, three times Penalty yards . . . . . . . . . . . . .63 vs. Maryland (10.8) . . . . . . . . . . . . . . . . . .10 at Miami (10.22) . . . . . . . . . . . . . . .56 by Virginia Tech (11.10) . . . . . . . . . .5, three times Punts . . . . . . . . . . . . . . . . . . . .5 vs. Maryland (10.8) . . . . . . . . . . . . . . . . . .1 vs. Kansas (9.17) . . . . . . . . . . . . . . . .8 by Western Carolina (9.1) . . . . . . . . . .2 by Virginia (10.15) . . . . . . . . . . . . . . . . . . . . . . . .5 at Miami (10.22) . . . . . . . . . . . . . . . . . . . . . . . . . . . . . . . . . . . . . . . . . . . . . . . . . . . . . . . . . . . . . . . . . . . . . . . . . . . . . . . .2 by Virginia Tech (11.10) Punting average . . . . . . . . . . .52.0 at Middle Tennessee (9.10) . . . . . . . . . . .30.7 (3) vs. North Carolina (9.24) . . . . .47.1 by Kansas (9.17) . . . . . . . . . . . . . .34.5 by Virginia Tech (11.10) Net yards per punt . . . . . . . . .53.0 at Middle Tennessee (9.10) . . . . . . . . . . .24.0 (3) vs. North Carolina (9.24) . . . . .46.3 by Middle Tennessee (9.10) . . . . . .24.5 by Virginia Tech (11.10) Avg yards punt return . . . . . .16.0 (1) at Virginia (10.15) . . . . . . . . . . . . . .- 9.0 (1) at Miami (10.22) . . . . . . . . . . .13.0 by Virginia (10.15) (1) . . . . . . . . . .- 2.0 by Middle Tennessee (9.10) (1) . . . . . . . . . . . . . . . . . . . . . . . . . . . . . . . . . . . . . . . . . . . . . . . . . . . . . . . . . . . . . . . . . . . . . . . . . . . . . . . . . . . . . . . . . . . . . . . . . . . . . . . . . . . . . . . . . . . . . .- 2.0 by Miami (10.22) (1) Avg yards per KO return . . . . .38.3 vs. Maryland (10.8) . . . . . . . . . . . . . . . .8.5 at Middle Tennessee (9.10) (2) . . . . .48.0 by Miami (10.22) (1) . . . . . . . . . . .17.3 by Maryland (10.8) Interceptions . . . . . . . . . . . . .2, three times . . . . . . . . . . . . . . . . . . . . . . . .0 vs. Kansas (9.17) . . . . . . . . . . . . . . . .2 by Virginia (10.15) . . . . . . . . . . . . . . .0, six times . . . . . . . . . . . . . . . . . . . . . . . . . . . . . . . . . . . . . . . . . . . . . . . . . . . . . . . . . . .0 vs. Virginia Tech (11.10) . . . . . . . . . . .2 by Georgia (11.26) INT Return Yards . . . . . . . . . .34 at NC State (10.1) . . . . . . . . . . . . . . . . . .- 2 vs. North Carolina (9.24) . . . . . . . . .26 by Clemson (10.29) . . . . . . . . . . . . .0, nine times Possession time . . . . . . . . . . .39:00 vs. Clemson (10.29) . . . . . . . . . . . . . . .25:47 vs. Virginia Tech (11.10) . . . . . . .34:13 by Virginia Tech (11.10) . . . . . . . .21:00 by Clemson (10.29) Field goals . . . . . . . . . . . . . . .2 vs. North Carolina (9.24) . . . . . . . . . . . . . . .0, five times . . . . . . . . . . . . . . . . . . . . .1, eight times . . . . . . . . . . . . . . . . . . . .0, four times . . . . . . . . . . . . . . . . . . . . . . . .2 vs. Virginia Tech (11.10) Field goal attempts . . . . . . . .3 vs. North Carolina (9.24) . . . . . . . . . . . . . . .0 at Middle Tennessee (9.10) . . . . . . . . .2, four times . . . . . . . . . . . . . . . . . . . .0, two times . . . . . . . . . . . . . . . . . . . . . . . . . . . . . . . . . . . . . . . . . . . . . . . . . . . . . . . . . . .0 at Miami (10.22) Sacks . . . . . . . . . . . . . . . . . . . .7.0 vs. North Carolina (9.24) . . . . . . . . . . . . .0, three times . . . . . . . . . . . . . . . . . . .5.0 by Virginia Tech (11.10) . . . . . . . . .0, five times Tackles for loss . . . . . . . . . . . .8.0, three times . . . . . . . . . . . . . . . . . . . . . .1.0 at Middle Tennessee (9.10) . . . . . . .7.0 by North Carolina (9.24) . . . . . . . . .1.0 by Duke (11.19) INDIVIDUAL Georgia Tech Opponent Most rushing attempts . . . . . . . . . .32, Tevin Washington vs. Maryland (10.8) . . . . . . . . . . . . . . . . . . . . . . . . . . .27, Lamar Miller of Miami (10.22) Most net rushing yards . . . . . . . . . .176, Tevin Washington vs. Clemson (10.29) . . . . . . . . . . . . . . . . . . . . . . . . . .175, David Wilson of Virginia Tech (11.10) Most rushing touchdowns . . . . . . .3, Orwin Smith at NC State (10.1); 3, Tevin Washington vs. Virginia Tech (11.10) .2, three times Most pass attempts . . . . . . . . . . . .19, Tevin Washington vs. Maryland (10.8) . . . . . . . . . . . . . . . . . . . . . . . . . . .42, Sean Renfree of Duke (11.19) Most pass completions . . . . . . . . . .10, Tevin Washington vs. North Carolina (9.24) . . . . . . . . . . . . . . . . . . . . . . .26, Sean Renfree of Duke (11.19) Most passes had intercepted . . . . .2, Tevin Washington at Virginia (10.15) . . . . . . . . . . . . . . . . . . . . . . . . . . . . .2, Bryn Renner of North Carolina (9.24) . . . . . . . . . . . . . . . . . . . . . . . . . . . .2, Tevin Washington vs. Georgia (11.26) . . . . . . . . . . . . . . . . . . . . . . . . . . . .2, Tajh Boyd of Clemson (10.29) Most passing yards . . . . . . . . . . . . .271, Tevin Washington vs. Western Carolina (9.1) . . . . . . . . . . . . . . . . . . . . .295, Tajh Boyd of Clemson (10.29) Most touchdowns passing . . . . . . .3, Tevin Washington vs. Western Carolina (9.1) . . . . . . . . . . . . . . . . . . . . . . .4, Sean Renfree of Duke (11.19) . . . . . . . . . . . . . . . . . . . . . . . . . . . . . . . . . . . . . . . . . . . . . . . . . . . . . . . . . . . . . . . . . . . . . . . . . . . . . . . . . . . . . .4, Aaron Murray of Georgia (11.26) Most receptions . . . . . . . . . . . . . . .6, Stephen Hill vs. North Carolina (9.24) . . . . . . . . . . . . . . . . . . . . . . . . . . . .10, Sammy Watkins of Clemson (10.29) Most yards receiving . . . . . . . . . . .181, Stephen Hill vs. Western Carolina (9.1) . . . . . . . . . . . . . . . . . . . . . . . . .159, Sammy Watkins of Clemson (10.29) Most touchdown receptions . . . . . .2, Stephen Hill vs. Western Carolina (9.1) . . . . . . . . . . . . . . . . . . . . . . . . . . .2, Tyler Purvis of NC State (10.1) . . . . . . . . . . . . . . . . . . . . . . . . . . . . . . . . . . . . . . . . . . . . . . . . . . . . . . . . . . . . . . . . . . . . . . . . . . . . . . . . . . . . . .2, Cooper Helfet of Duke (11.19) Most punts . . . . . . . . . . . . . . . . . . .4, Sean Poole at Virginia (10.15) . . . . . . . . . . . . . . . . . . . . . . . . . . . . . . . . . .8, Blake Cain of Western Carolina (9.1) Highest punting avg. (Min. 2) . . . .52.0, Sean Poole at Middle Tennessee (9.10) . . . . . . . . . . . . . . . . . . . . . . . . .47.5, Nathaniel Toulson of Middle Tennessee (9.10) (2) Most punt returns . . . . . . . . . . . . . .4, Zach Laskey vs. Kansas (9.17) . . . . . . . . . . . . . . . . . . . . . . . . . . . . . . . . .2, three times Most punt return yards . . . . . . . . . .31, Zach Laskey vs. Western Carolina (9.1) . . . . . . . . . . . . . . . . . . . . . . . . . .15, Deja Alexander of Western Carolina (9.1) Most kickoff returns . . . . . . . . . . . .5, Embry Peeples at Duke (11.19) . . . . . . . . . . . . . . . . . . . . . . . . . . . . . . . . .8, George Richardson of Western Carolina (9.1) Most kickoff return yards . . . . . . . .115, Tony Zenon vs. Maryland (10.8) . . . . . . . . . . . . . . . . . . . . . . . . . . . . . . .156, George Richardson of Western Carolina (9.1) Most field goals . . . . . . . . . . . . . . .2, Justin Moore vs. North Carolina (9.24); 2, Justin Moore vs. Virginia Tech (11.10) 1, eight times Most field goal attempts . . . . . . . .3, Justin Moore vs. North Carolina (9.24) . . . . . . . . . . . . . . . . . . . . . . . . . . . .2, four times Most all-purpose yards . . . . . . . . . .314, Orwin Smith vs. Kansas (9.17) . . . . . . . . . . . . . . . . . . . . . . . . . . . . . . . .290, Sammy Watkins of Clemson (10.29) Longest rush . . . . . . . . . . . . . . . . . .% 95, Orwin Smith vs. Kansas (9.17) . . . . . . . . . . . . . . . . . . . . . . . . . . . . . .77, C.J. Brown of Maryland (10.8) Longest pass play . . . . . . . . . . . . . .82, Washington to Hill vs. Western Carolina (9.1) . . . . . . . . . . . . . . . . . . . . . .63, Thomas to Coale of Virginia Tech (11.10) Longest punt return . . . . . . . . . . . .28, Zach Laskey vs. Western Carolina (9.1) . . . . . . . . . . . . . . . . . . . . . . . . . .13, Deja Alexander of Western Carolina (9.1); 13, Dominique Terrell of Virginia (10.15) Longest kickoff return . . . . . . . . . .79, Tony Zenon vs. Maryland (10.8) . . . . . . . . . . . . . . . . . . . . . . . . . . . . . . .60, Brandon Boykin of Georgia (11.26) Longest interception return . . . . . .34, Isaiah Johnson at NC State (10.1) . . . . . . . . . . . . . . . . . . . . . . . . . . . . . .26, Rashard Hall of Clemson (10.29) Longest field goal . . . . . . . . . . . . . .41, Justin Moore vs. Virginia Tech (11.10) . . . . . . . . . . . . . . . . . . . . . . . . . . .41, Blair Walsh of Georgia (11.26) Longest field goal attempt . . . . . . .52, Justin Moore (blocked) at Virginia (10.15) . . . . . . . . . . . . . . . . . . . . . . . .52, Blair Walsh of Georgia (11.26) Most solo tackles . . . . . . . . . . . . . .7, Julian Burnett (three times) . . . . . . . . . . . . . . . . . . . . . . . . . . . . . . . . . . .14, Joe Vellano of Maryland (10.8) Most total tackles . . . . . . . . . . . . . .13, Julian Burnett vs. Virginia Tech (11.10) . . . . . . . . . . . . . . . . . . . . . . . . . .20, Joe Vellano of Maryland (10.8) Most sacks . . . . . . . . . . . . . . . . . . .3.0, Jeremiah Attaochu vs. North Carolina (9.24) . . . . . . . . . . . . . . . . . . . . . .1.5, two times Tackles-for-loss . . . . . . . . . . . . . . .3.0, Jeremiah Attaochu vs. North Carolina (9.24) . . . . . . . . . . . . . . . . . . . . . .3.0, Denzel Perryman of Miami (10.22) Forced fumbles . . . . . . . . . . . . . . . .1, 12 times . . . . . . . . . . . . . . . . . . . . . . . . . . . . . . . . . . . . . . . . . . . . . . . . .2, Earl Wolff of NC State (10.1) Fumble recoveries . . . . . . . . . . . . .1, seven times . . . . . . . . . . . . . . . . . . . . . . . . . . . . . . . . . . . . . . . . . . . . . . .1, 10 times Interceptions . . . . . . . . . . . . . . . . .2, Jemea Thomas vs. Clemson (10.29) . . . . . . . . . . . . . . . . . . . . . . . . . . . . .1, eight times *ACC record / # NCAA Record / % Georgia Tech record 2011 GEORGIA TECH FOOTBALL
RAMBLINWRECK.COM
GAME #1
Western Carolina (nr/rv) Georgia Tech
21 63
September 1, 2011 | Atlanta, Ga. Bobby Dodd Stadium | 42,131 Orwin Smith scored two of Georgia Tech's four first-quarter touchdowns, Stephen Hill caught two touchdown passes from Tevin Washington and Georgia Tech beat Western Carolina 6321 in the opener for both teams. The Yellow Jackets piled up 662 yards of total offense -- their most productive game since 2000 -- but they struggled throughout the night to hold on to the football, losing two of six fumbles and allowing a second-quarter punt to get blocked and recovered for a touchdown. Brandon Pechloff, who was sacked three times, had 180 yards passing for Western Carolina. Georgia Tech, facing an FCS opponent that dropped to 10-46 since the start of 2006, showed flashes of a formidable passing game after ranking 119th in the nation last year. Washington completed eight of 13 passes for 271 yards and three TDs. No. 2 quarterback Synjyn Days was 3 of 3 passing for 94 yards. Hill caught four passes for 181 yards. The yardage totals were career highs for all three players. Georgia Tech had more yards passing in the first quarter (148) than it had in any game last season (130 in an Oct. 2 win over Wake Forest). The Yellow Jackets, who led the nation in rushing last year, racked up 260 yards on the ground. Smith finished with 84 yards, which included a 77-yard score, on just four carries Western Carolina scored three touchdowns in the second quarter but still trailed by 21 points at halftime. Georgia Tech coach Paul Johnson was surely irritated by his team's propensity to fumble. Leading 28-0 near the end of the first quarter, Jackets B-back Charles Perkins lost a fumble that Western Carolina's Rainey Ala recovered at the Georgia Tech 31. The Catamounts went threeand-out, but Georgia Tech's Euclid Cummings fumbled away the ensuing punt return that Courtland Carson recovered at the Georgia Tech 4. Pechloff's 2-yard run on the next play made it 28-7. After the Catamounts had a 13-play, 64-yard drive that ended with Michael Vaughn's 4-yard run and cut the lead to 35-14 late in the second, Georgia Tech answered with Washington's 26yard TD pass to Roddy Jones. But following another three-and-out by Western Carolina, the Jackets allowed Ala to block a 45-yard field goal attempt that was recovered by Isaiah Moore and returned for a 69-yard score to make it 42-21 at halftime. Score by Quarters Western Carolina Georgia Tech
GT GT GT GT WC GT WC GT WC GT GT GT
Qtr 1st 1st 1st 1st 2nd 2nd 2nd 2nd 2nd 3rd 3rd 4th
Time 13:42 10:07 6:38 3:02 14:39 7:57 3:34 2:21 0:01 12:17 3:00 7:25
1 0 28
2 21 14
3 0 14
Scoring Play Smith, O. 5 yd run Hill, S. 82 yd pass Smith, O. 77 yd run Days, S. 7 yd run B. Pechloff 2 yd run Sims, D. 3 yd run M. Vaughn 4 yd run Jones, R. 26 yd pass Moore 69 yd blk. FG ret. Lyons, P. 20 yd run Hill, S. 77 yd pass Hill, D. 5 yd run
4 0 7
Score 21 63
Conversion Moore, Ju. kick Moore, Ju. kick Moore, Ju. kick Moore, Ju. kick Sechrest kick Moore, Ju. kick Sechrest kick Moore, Ju. kick Sechrest kick Moore, Ju. kick Moore, Ju. kick Moore, Ju. kick
WCU FIRST DOWNS . . . . . . . . . . . . . . . . . . . . . . . . . . .18 RUSHING . . . . . . . . . . . . . . . . . . . . . . . . . . . . . . .5 PASSING . . . . . . . . . . . . . . . . . . . . . . . . . . . . . . .11 PENALTY . . . . . . . . . . . . . . . . . . . . . . . . . . . . . . .2 NET YARDS RUSHING . . . . . . . . . . . . . . . . . . . . .104 RUSHING ATTEMPTS . . . . . . . . . . . . . . . . . . . . . .40 AVERAGE PER RUSH . . . . . . . . . . . . . . . . . . . . . .2.6 RUSHING TOUCHDOWNS . . . . . . . . . . . . . . . . . . . .2 YARDS GAINED RUSHING . . . . . . . . . . . . . . . . . .139 YARDS LOST RUSHING . . . . . . . . . . . . . . . . . . . .35 NET YARDS PASSING . . . . . . . . . . . . . . . . . . . . . .197 COMPLETIONS-ATTEMPTS-INT . . . . . . . . . . .22-37-1 AVERAGE PER ATTEMPT . . . . . . . . . . . . . . . . . . .5.3 AVERAGE PER COMPLETION . . . . . . . . . . . . . . . .9.0 PASSING TOUCHDOWNS . . . . . . . . . . . . . . . . . . . .0 TOTAL OFFENSE YARDS . . . . . . . . . . . . . . . . . . . .301 TOTAL OFFENSE PLAYS . . . . . . . . . . . . . . . . . . . .77 AVERAGE GAIN PER PLAY . . . . . . . . . . . . . . . . . .3.9 FUMBLES: NUMBER-LOST . . . . . . . . . . . . . . . . . . .2-2 PENALTIES: NUMBER-YARDS . . . . . . . . . . . . . . . .6-29 PUNTS-YARDS . . . . . . . . . . . . . . . . . . . . . . . . .8-294 AVERAGE YARDS PER PUNT . . . . . . . . . . . . . . . .36.8
2011 GEORGIA TECH FOOTBALL
GT . . . . . .21 . . . . . .11 . . . . . .10 . . . . . . .0 . . . . .297 . . . . . .48 . . . . .6.2 . . . . . . .6 . . . . .320 . . . . . .23 . . . . .365 . .11-16-0 . . . . .22.8 . . . . .33.2 . . . . . . .3 . . . . .662 . . . . . .64 . . . . .10.3 . . . . .6-2 . . . .5-53 . . . .2-81 . . . . .40.5
NET YARDS PER PUNT . . . . . . . . . . . . . . . . . . .33.1 INSIDE 20 . . . . . . . . . . . . . . . . . . . . . . . . . . . . . .3 50+ YARDS . . . . . . . . . . . . . . . . . . . . . . . . . . . . .0 TOUCHBACKS . . . . . . . . . . . . . . . . . . . . . . . . . . . .0 FAIR CATCH . . . . . . . . . . . . . . . . . . . . . . . . . . . . .2 KICKOFFS-YARDS . . . . . . . . . . . . . . . . . . . . . . .3-173 AVERAGE YARDS PER KICKOFF . . . . . . . . . . . . .57.7 NET YARDS PER KICKOFF . . . . . . . . . . . . . . . . .40.7 TOUCHBACKS . . . . . . . . . . . . . . . . . . . . . . . . . . . .0 PUNT RETURNS: NUMBER-YARDS-TD . . . . . . . .2-15-0 AVERAGE PER RETURN . . . . . . . . . . . . . . . . . . . .7.5 KICKOFF RETURNS: NUMBER-YDS-TD . . . . . .10-204-0 AVERAGE PER RETURN . . . . . . . . . . . . . . . . . . .20.4 INTERCEPTIONS: NUMBER-YDS-TD . . . . . . . . . . .0-0-0 FUMBLE RETURNS: NUMBER-YDS-TD . . . . . . . . .0-0-1 POSSESSION TIME . . . . . . . . . . . . . . . . . . . . . .31:47 THIRD-DOWN CONVERSIONS . . . . . . . . . . . . .8 OF 18 FOURTH-DOWN CONVERSIONS . . . . . . . . . . . .0 OF 1 RED-ZONE SCORES-CHANCES . . . . . . . . . . . . . . . .2-3 TOUCHDOWNS . . . . . . . . . . . . . . . . . . . . . . . . .2-3 FIELD GOALS . . . . . . . . . . . . . . . . . . . . . . . . . . .0-3 SACKS BY: NUMBER-YARDS . . . . . . . . . . . . . . . . . .0-0 PAT KICKS . . . . . . . . . . . . . . . . . . . . . . . . . . . . . .3-3 FIELD GOALS . . . . . . . . . . . . . . . . . . . . . . . . . . . .0-0
. . . . .33.0 . . . . . . .0 . . . . . . .0 . . . . . . .0 . . . . . . .0 . . .10-649 . . . . .64.9 . . . . .44.5 . . . . . . .0 . . .3-29-0 . . . . .9.7 . . .2-51-0 . . . . .25.5 . . .1-15-0 . . . .0-0-0 . . . .28:13 . .9 OF 12 . . .0 OF 1 . . . . .5-5 . . . . .5-5 . . . . .0-5 . . . .4-21 . . . . .9-9 . . . . .0-1
TEAM STATISTICS Rushing WC -- Warren 13-43; Boone 5-42; Vaughn 11-27, 1TD; Pechloff 7-6, 1TD; Richardson 1-4; Alexander 1(-2); Brindise 1(-7); Green 1(-9) GT -- Smith 4-84, 2TD; Days 14-55, 1TD; Sims 9-44, 1TD; Washington 6-34; Watson 3-30; Lyons 2-22; Perkins 5-12; Peeples 1-7; Godhigh 1-6; D. Hill 1-5, 1TD; Dickey 1-1; Zenon 1(-3) Passing WC -- Pechloff 20-33, 180; Brindise 2-4, 17, INT GT -- Washington 8-13, 271, 3TD; Days 3-3, 94 Receiving WC -- Alexander 6-64; Rogers 3-38; Richardson 3-16; Cockrell 2-25; Mitchell 2-15; Boone 1-11; Johnson 1-7; Warren 1-7; Harris 1-7; Vaughn 1-6; Green 1-1 GT -- S. Hill 4-181, 2TD; Smith 2-43; Melton 1-66; Jones 1-26, 1TD; Peeples 1-21; Zenon 1-19; Perkins 1-9
GAME #2 (rv/rv) Georgia Tech Middle Tennessee
49 21
September 10, 2011 | Murfreesboro, Tenn. Floyd Stadium | 30,502 One week after rolling up over 600 yards and 60 points, Georgia Tech proved it could score quickly through the air or grind it out on the ground with its triple-option attack. Tevin Washington threw for two long touchdowns and ran for two scores, and Georgia Tech (2-0) pounded Middle Tennessee State (0-2) 49-21 before MTSU's record crowd of 30,501. The Yellow Jackets, who took a 28-0 second-quarter lead, scored on their first play from scrimmage. Washington hit Tony Zenon down the left sideline for a 73-yard touchdown only 14 seconds into the game. Georgia Tech then went to the ground for all 17 plays on its next possession to score on a 98-yard drive after MTSU had downed its first punt at the 2. Tech took 9:25 off the clock, had five different ball carriers and made six first downs before Washington scored on a 2-yard keeper for a 14-0 lead. The Yellow Jackets finished with 596 total yards, 382 on the ground. Washington left in the third quarter after completing 5 of 8 passes for 202 yards, while David Sims and backup quarterback Synjyn Days led Tech's rushers with 91 yards each. MTSU started its second possession at its 40 after Tech's kickoff went out of bounds, and Logan Kilgore hit Anthony Amos for a 20-yard pass on first down. But the drive stalled at the Tech 29 and Alan Gendreau missed on a 46-yard field goal attempt. The Yellow Jackets went back to the air and scored on the next play, a 71-yard pass from Washington to Stephen Hill. Hill was hit by defenders around the 32, but broke loose for a 21-0 lead with 2:12 left in the first quarter. An interception by Tech's Isaiah Johnson stopped MTSU at the Tech 10, and this time the Yellow Jackets mixed up the pass and the run to build a 28-0 lead with 10:45 to go in the second quarter. Washington connected with Hill for 43 yards and Roddy Jones and Sims had 14-yard carries on the seven-play drive before Washington kept on the option for a 7-yard touchdown. Johnson also came up with a fumble recovery on the Blue Raiders' next drive, but Tech had to punt for the first time 7 minutes before halftime. MTSU finally got on the scoreboard 3:12 before halftime after an 11-play. D.D. Kyles dragged defenders into the end zone on a 15-yard touchdown run.
Georgia Tech was the third Atlantic Coast Conference visitor to MTSU's Johnny (Red) Floyd Stadium since the Raiders moved up to the Football Bowl Subdivision in 1999. But the Yellow Jackets were the first to blow out MTSU; Virginia won by only two points in 2007 and Maryland lost in 2008. The Yellow Jackets tacked on another touchdown midway through the third quarter when Orwin Smith's 2-yard TD run capped an 11-play, 6-minute drive that covered 85 yards. Georgia Tech put in Days on the next series, and he directed two touchdown drives. The redshirt freshman ran keepers for 10 and 28 yards before scoring on a 5-yard run with 1:27 left in the third. Middle Tennessee was celebrating its centennial with a birthday cake unveiled at halftime of the home opener. Score by Quarters Georgia Tech Middle Tennessee State
GT GT GT GT MT GT GT MT GT MT
Qtr 1st 1st 1st 2nd 2nd 3rd 3rd 4th 4th 4th
Time 0:14 4:10 2:12 10:45 3:12 7:36 1:27 12:57 3:16 0:53
1 21 0
2 7 7
3 14 0
Scoring Play Zenon, T. 73 yd pass Washington, T. 2 yd run Hill, S. 71 yd pass Washington, T. 7 yd run Kyles, D.D. 15 yd run Smith, O. 2 yd run Days, S. 5 yd run Cunningham, B. 1 yd run Days, S. 1 yd run McDonald, S. 18 yd pass
4 7 14
Score 49 21
Conversion Moore, Ju. kick Moore, Ju. kick Moore, Ju. kick Moore, Ju. kick Gendreau, A. kick Moore, Ju. kick Moore, Ju. kick Gendreau, A. kick Moore, Ju. kick Gendreau, A. kick
GT FIRST DOWNS . . . . . . . . . . . . . . . . . . . . . . . . . . .29 RUSHING . . . . . . . . . . . . . . . . . . . . . . . . . . . . . .24 PASSING . . . . . . . . . . . . . . . . . . . . . . . . . . . . . . .5 PENALTY . . . . . . . . . . . . . . . . . . . . . . . . . . . . . . .0 NET YARDS RUSHING . . . . . . . . . . . . . . . . . . . . .382 RUSHING ATTEMPTS . . . . . . . . . . . . . . . . . . . . . .65 AVERAGE PER RUSH . . . . . . . . . . . . . . . . . . . . . .5.9 RUSHING TOUCHDOWNS . . . . . . . . . . . . . . . . . . . .5 YARDS GAINED RUSHING . . . . . . . . . . . . . . . . . .403 YARDS LOST RUSHING . . . . . . . . . . . . . . . . . . . .21 NET YARDS PASSING . . . . . . . . . . . . . . . . . . . . . .214 COMPLETIONS-ATTEMPTS-INT . . . . . . . . . . . .6-10-0 AVERAGE PER ATTEMPT . . . . . . . . . . . . . . . . . .21.4 AVERAGE PER COMPLETION . . . . . . . . . . . . . . .35.7 PASSING TOUCHDOWNS . . . . . . . . . . . . . . . . . . . .2 TOTAL OFFENSE YARDS . . . . . . . . . . . . . . . . . . . .596 TOTAL OFFENSE PLAYS . . . . . . . . . . . . . . . . . . . .75 AVERAGE GAIN PER PLAY . . . . . . . . . . . . . . . . . .7.9 FUMBLES: NUMBER-LOST . . . . . . . . . . . . . . . . . . .2-1 PENALTIES: NUMBER-YARDS . . . . . . . . . . . . . . . .3-23 PUNTS-YARDS . . . . . . . . . . . . . . . . . . . . . . . . .2-104 AVERAGE YARDS PER PUNT . . . . . . . . . . . . . . . .52.0 NET YARDS PER PUNT . . . . . . . . . . . . . . . . . . .53.0 INSIDE 20 . . . . . . . . . . . . . . . . . . . . . . . . . . . . . .1 50+ YARDS . . . . . . . . . . . . . . . . . . . . . . . . . . . . .1 TOUCHBACKS . . . . . . . . . . . . . . . . . . . . . . . . . . . .0 FAIR CATCH . . . . . . . . . . . . . . . . . . . . . . . . . . . . .0 KICKOFFS-YARDS . . . . . . . . . . . . . . . . . . . . . . .8-492 AVERAGE YARDS PER KICKOFF . . . . . . . . . . . . .61.5 NET YARDS PER KICKOFF . . . . . . . . . . . . . . . . .44.5 TOUCHBACKS . . . . . . . . . . . . . . . . . . . . . . . . . . . .0 PUNT RETURNS: NUMBER-YARDS-TD . . . . . . . . .1-0-0 AVERAGE PER RETURN . . . . . . . . . . . . . . . . . . . .0.0 KICKOFF RETURNS: NUMBER-YDS-TD . . . . . . . .2-17-0 AVERAGE PER RETURN . . . . . . . . . . . . . . . . . . . .8.5 INTERCEPTIONS: NUMBER-YDS-TD . . . . . . . . . . .1-0-0 FUMBLE RETURNS: NUMBER-YDS-TD . . . . . . . . .0-0-0 MISCELLANEOUS YARDS . . . . . . . . . . . . . . . . . . . . .0 POSSESSION TIME . . . . . . . . . . . . . . . . . . . . . .38:42 THIRD-DOWN CONVERSIONS . . . . . . . . . . . . .8 OF 12 FOURTH-DOWN CONVERSIONS . . . . . . . . . . . .2 OF 2 RED-ZONE SCORES-CHANCES . . . . . . . . . . . . . . . .5-5 TOUCHDOWNS . . . . . . . . . . . . . . . . . . . . . . . . .5-5 FIELD GOALS . . . . . . . . . . . . . . . . . . . . . . . . . . .0-5 SACKS BY: NUMBER-YARDS . . . . . . . . . . . . . . . . . .0-0 PAT KICKS . . . . . . . . . . . . . . . . . . . . . . . . . . . . . .7-7 FIELD GOALS . . . . . . . . . . . . . . . . . . . . . . . . . . . .0-0
MTSU . . . . . .21 . . . . . .14 . . . . . . .7 . . . . . . .0 . . . . .147 . . . . . .29 . . . . .5.1 . . . . . . .2 . . . . .147 . . . . . . .0 . . . . .195 . .22-35-1 . . . . .5.6 . . . . .8.9 . . . . . . .1 . . . . .342 . . . . . .64 . . . . .5.3 . . . . .2-2 . . . .2-13 . . . .3-139 . . . . .46.3 . . . . .46.3 . . . . . . .2 . . . . . . .1 . . . . . . .0 . . . . . . .0 . . . .3-139 . . . . .46.3 . . . . .40.7 . . . . . . .0 . . .1--2-0 . . . . .-2.0 . .6-136-0 . . . . .22.7 . . . .0-0-0 . . . .0-0-0 . . . . . . .0 . . . .21:18 . .6 OF 13 . . .2 OF 2 . . . . .3-3 . . . . .3-3 . . . . .0-3 . . . .1-11 . . . . .3-3 . . . . .0-1
TEAM STATISTICS Rushing GT -- Sims 12-91; Days 15-91, 2TD; Jones 6-63; Zenon 6-47; Smith 3-29, 1TD; Perkins 5-22; Lyons 6-18; Peeples 2-15; Washington 106, 2TD MT -- Cunningham 15-80, 1TD; Kilgore 4-19; Pratcher 5-18; Kyles 2-17, 1TD; Murphy 2-10; Whatley 1-3 Passing GT -- Washington 5-8, 202, 2TD; Days 1-2, 12 MT -- Kilgore 16-28, 114, INT; Murphy 5-6, 54, 1TD; Banks 1-1, 27 Receiving GT -- S. Hill 3-126, 1TD; Zenon 2-85, 1TD; Peeples 1-3 MT -- McDonald 5-44, 1TD; Whatley 3-40; Jefferson 3-7; Amos 228; Gray 2-18; Mason 2-18; Blissard 2-9; Beyah 2-4; Cunningham 1-27
RAMBLINWRECK.COM
GAME #3
Kansas (rv/rv) Georgia Tech
24 66
September 17, 2011 | Atlanta, Ga. Bobby Dodd Stadium | 42,025 Led by Orwin Smith, who had more than 100 yards rushing and receiving, Georgia Tech piled up a school-record 768 yards in a 66-24 rout of the Jayhawks. Georgia Tech (3-0) also set a school mark with 604 yards rushing and played with a passion and focus that was missing a year ago in an mistake-plagued loss to Kansas. The Yellow Jackets ran at will and mixed in three long passes against Kansas (2-1). Georgia Tech avenged a 28-25 upset by the Jayhawks last season, a bitter defeat that sent the Yellow Jackets spiraling to a losing season. Georgia Tech also set a school record with 604 yards on the ground in its highest-scoring game since a 69-14 win over Samford in 2007. Losing its 10th straight road game, Kansas gave up three one-play scoring drives to the Yellow Jackets, including their first offensive snap of each half. Georgia Tech averaged 12.1 yards each time they ran the ball. That broke the NCAA record, an 11.9-yard performance in 1973 by Bear Bryant's Alabama team against Virginia Tech. Smith needed only five carries to put up 157 yards. Peeples added 110 yards on five carries. Smith set the tone on Georgia Tech's first offensive play, breaking off a 95-yard touchdown for yet another record-longest run in school history. Tevin Washington had another efficient day at quarterback, completing 4 of 7 for 164 yards. He connected with Smith on a 67-yard touchdown and hooked up with Jones on a 52-yarder. Washington also completed a 41-yard pass to Smith that came up short of the end zone, giving the junior A-back 108 yards on his two receptions. Georgia Tech had gone seven years since its last player, Calvin Johnson, had rushing and receiving touchdowns in the same game. Both Smith and Jones did it against the Jayhawks. Smith also was the first Yellow Jackets player since at least 1978 to account for more than 100 yards on the ground and through the air. Kansas kicked a field goal on the last play of the first half and actually went to the locker room only down 24-17. It was all Georgia Tech after that. Peeples took off from the 37 on the opening play of the third quarter and the rout was on. The Yellow Jackets finished with their highest-scoring second half since putting up 96 over the final two periods of their famous 222-0 victory over Cumberland in 1916. Georgia Tech broke the school record of 558 yards rushing against VMI in 1975, and the 706-yard mark for total yards set in 1948 against Citadel. Score by Quarters Kansas Georgia Tech
GT KU GT KU GT GT KU GT GT GT GT GT GT KU
Qtr 1st 1st 1st 2nd 2nd 2nd 2nd 3rd 3rd 3rd 3rd 4th 4th 4th
Time 12:33 7:09 0:06 9:03 7:32 0:39 0:00 14:39 10:34 6:55 3:30 11:44 5:13 2:24
1 7 14
2 10 10
Scoring Play Smith, O. 95 yd run Miller, D. 10 yd run Jones, R. 4 yd run Miller, D. 11 yd run Sims, D. 19 yd run Moore, Ju. 24 yd FG Mueller, A. 28 yd FG Peeples, E. 63 yd run Smith, O. 67 yd pass Jones, R. 52 yd pass Sims, D. 21 yd run Days, S. 2 yd run Perkins, C. 3 yd run Turzilli, A. 10 yd pass
3 0 28
4 7 14
Score 24 66
Conversion Moore, Ju. kick Mueller, A. kick Moore, Ju. kick Mueller, A. kick Moore, Ju. kick
Moore, Ju. kick Moore, Ju. kick Moore, Ju. kick Moore, Ju. kick Moore, Ju. kick Moore, Ju. kick Mueller, A. kick
KU FIRST DOWNS . . . . . . . . . . . . . . . . . . . . . . . . . . .19 RUSHING . . . . . . . . . . . . . . . . . . . . . . . . . . . . . . .7 PASSING . . . . . . . . . . . . . . . . . . . . . . . . . . . . . . .11 PENALTY . . . . . . . . . . . . . . . . . . . . . . . . . . . . . . .1 NET YARDS RUSHING . . . . . . . . . . . . . . . . . . . . .151 RUSHING ATTEMPTS . . . . . . . . . . . . . . . . . . . . . .42 AVERAGE PER RUSH . . . . . . . . . . . . . . . . . . . . . .3.6 RUSHING TOUCHDOWNS . . . . . . . . . . . . . . . . . . . .2 YARDS GAINED RUSHING . . . . . . . . . . . . . . . . . .155 YARDS LOST RUSHING . . . . . . . . . . . . . . . . . . . . .4 NET YARDS PASSING . . . . . . . . . . . . . . . . . . . . . .211 COMPLETIONS-ATTEMPTS-INT . . . . . . . . . . .17-27-0 AVERAGE PER ATTEMPT . . . . . . . . . . . . . . . . . . .7.8 AVERAGE PER COMPLETION . . . . . . . . . . . . . . .12.4 PASSING TOUCHDOWNS . . . . . . . . . . . . . . . . . . . .1
2011 GEORGIA TECH FOOTBALL
GT . . . . . .24 . . . . . .21 . . . . . . .3 . . . . . . .0 . . . . .604 . . . . . .50 . . . . .12.1 . . . . . . .7 . . . . .621 . . . . . .17 . . . . .164 . . . .4-7-0 . . . . .23.4 . . . . .41.0 . . . . . . .2
TOTAL OFFENSE YARDS . . . . . . . . . . . . . . . . . . . .362 TOTAL OFFENSE PLAYS . . . . . . . . . . . . . . . . . . . .69 AVERAGE GAIN PER PLAY . . . . . . . . . . . . . . . . . .5.2 FUMBLES: NUMBER-LOST . . . . . . . . . . . . . . . . . . .3-0 PENALTIES: NUMBER-YARDS . . . . . . . . . . . . . . . . .1-5 PUNTS-YARDS . . . . . . . . . . . . . . . . . . . . . . . . .7-330 AVERAGE YARDS PER PUNT . . . . . . . . . . . . . . . .47.1 NET YARDS PER PUNT . . . . . . . . . . . . . . . . . . .40.4 INSIDE 20 . . . . . . . . . . . . . . . . . . . . . . . . . . . . . .1 50+ YARDS . . . . . . . . . . . . . . . . . . . . . . . . . . . . .1 TOUCHBACKS . . . . . . . . . . . . . . . . . . . . . . . . . . . .1 FAIR CATCH . . . . . . . . . . . . . . . . . . . . . . . . . . . . .0 KICKOFFS-YARDS . . . . . . . . . . . . . . . . . . . . . . .4-236 AVERAGE YARDS PER KICKOFF . . . . . . . . . . . . .59.0 NET YARDS PER KICKOFF . . . . . . . . . . . . . . . . .41.2 TOUCHBACKS . . . . . . . . . . . . . . . . . . . . . . . . . . . .0 PUNT RETURNS: NUMBER-YARDS-TD . . . . . . . . .0-0-0 AVERAGE PER RETURN . . . . . . . . . . . . . . . . . . . .0.0 KICKOFF RETURNS: NUMBER-YDS-TD . . . . . .10-176-0 AVERAGE PER RETURN . . . . . . . . . . . . . . . . . . .17.6 INTERCEPTIONS: NUMBER-YDS-TD . . . . . . . . . . .0-0-0 FUMBLE RETURNS: NUMBER-YDS-TD . . . . . . . . .0-0-0 MISCELLANEOUS YARDS . . . . . . . . . . . . . . . . . . . . .0 POSSESSION TIME . . . . . . . . . . . . . . . . . . . . . .32:23 THIRD-DOWN CONVERSIONS . . . . . . . . . . . . .9 OF 17 FOURTH-DOWN CONVERSIONS . . . . . . . . . . . .0 OF 1 RED-ZONE SCORES-CHANCES . . . . . . . . . . . . . . . .4-4 TOUCHDOWNS . . . . . . . . . . . . . . . . . . . . . . . . .3-4 FIELD GOALS . . . . . . . . . . . . . . . . . . . . . . . . . . .1-4 SACKS BY: NUMBER-YARDS . . . . . . . . . . . . . . . . .1-11 PAT KICKS . . . . . . . . . . . . . . . . . . . . . . . . . . . . . .3-3 FIELD GOALS . . . . . . . . . . . . . . . . . . . . . . . . . . . .1-1
. . . . .768 . . . . . .57 . . . . .13.5 . . . . .1-0 . . . .5-40 . . . .1-37 . . . . .37.0 . . . . .37.0 . . . . . . .1 . . . . . . .0 . . . . . . .0 . . . . . . .0 . . .11-678 . . . . .61.6 . . . . .43.8 . . . . . . .1 . . .4-27-0 . . . . .6.8 . . .4-71-0 . . . . .17.8 . . . .0-0-0 . . . .0-0-0 . . . . . . .0 . . . .27:37 . .7 OF 10 . . .1 OF 1 . . . . .5-5 . . . . .4-5 . . . . .1-5 . . . . .1-1 . . . . .9-9 . . . . .1-1
TEAM STATISTICS Rushing KU -- Miller 11-54, 2TD; Sims 11-40; Lewis 10-26; Pierson 6-18; Webb 3-15; Bourbon 1(-1) GT -- Smith 5-157, 1TD; Peeples 5-10, 1TD; Jones 4-72, 1TD; Sims 9-70, 2TD; Days 9-68, 1TD; Lyons 2-40; Washington 6-32; Perkins 4-15, 1TD; Godhigh 1-12; Jackson 1-12; Zenon 2-8; Dickey 2-8 Passing KU -- Webb 11-19, 148; Mecham 6-68, 63. 1TD GT -- Washington 4-7, 164, 2TD Receiving KU -- Beshears 5-65; Biere 3-40; Turzilli 3-37, 1TD; Jackson 2-23; Mundine 2-22; Pick 1-17; Sims 1-7 GT -- Smith 2-108, 1TD; Jones 1-52, 1TD; S. Hill 1-4
GAME #4 (rv/25) North
Carolina 28 Tech 35
(25/24) Georgia
September 24, 2011 | Atlanta, Ga. Bobby Dodd Stadium | 46,849 Tevin Washington threw a long touchdown pass and ran for two scores, including a 5-yarder with about 5 1/2 minutes remaining that gave No. 25 Georgia Tech a 35-28 victory over North Carolina. The Yellow Jackets improved to 4-0 for the first time since 1990, the season they shared the national title with Colorado. The Tar Heels (3-1, 1-1 ACC) were actually the ones who fought back from a 28-14 deficit going to the final period, tying the game on Giovani Bernard's 55-yard run with 7:22 left. Georgia Tech needed only four plays to respond in its conference opener. Running back Roddy Jones reached out to take a pitch from Washington that looked too far in front of him, going 48 yards down the sideline to the North Carolina 9. Two snaps later, with Finch and others clearing the way, Washington carried it in himself for the winning score with 5:20 left. Stephen Hill had a huge game for Georgia Tech with six receptions for 151 yards, including a 59-yard touchdown. Bernard rushed for 155 yards and two TDs. The Yellow Jackets came in with the nation's highest-scoring offense (59.3 points a game) and leading in several other offensive categories. While not nearly as dominating as they were in the first three games, they still had another big day offensively, piling up 312 yards on the ground and 496 yards in all. Washington had a fumble and an interception, but he mostly ran the offense just as it's drawn up. He completed 10 of 14 passes for 184 yards, hooking up with Hill on Georgia Tech's seventh one-play scoring drive of the season midway through the second period. Hill should've had another score, dropping a sure TD pass late in the game after he again broke free behind the secondary. He pulled up with some sort of cramp or hamstring problem just as the ball arrived, then hobbled to the sideline. It was hard to get too mad at the 6-foot-5 receiver, especially with the leaping, one-handed grab he made on a pass in the
first half, somehow getting his fingers on the ball and pulling it down as he fell hard to the ground. Washington also ran 25 times for 74 yards, taking quite a pounding from the Tar Heels. North Carolina's Bryn Renner completed 17 of 25 for 204 yards, but a couple of interceptions plagued the sophomore in his first start outside of Chapel Hill. The Tar Heels trailed 17-7 at halftime, and Tech drove for a field goal on the opening possession to extend its lead. Renner and Bernard led North Carolina back. Renner completed five straight passes on a right-down-the-field, 74-yard drive the first time he got the ball, three of the completions going to Dwight Jones before Nelson Hurst hauled in a 6-yard scoring pass. Washington guided Georgia Tech on a 13-play, 81-yard drive and scored on a 1-yard dive. The Yellow Jackets also made the 2-point conversion for their biggest lead. Score by Quarters North Carolina Georgia Tech
NC GT GT GT GT NC GT NC NC GT
Qtr 1st 1st 2nd 2nd 3rd 3rd 3rd 4th 4th 4th
Time 11:26 6:13 7:57 0:11 9:47 7:37 1:26 14:53 7:22 5:20
1 7 3
2 0 14
Scoring Play Bernard, G. 4 yd run Moore, Ju. 40 yd FG Hill, S. 59 yd pass Jones, R. 2 yd run Moore, Ju. 36 yd FG Hurst, N. 6 yd pass Washington, T. 1 yd run Ebron, E. 20 yd pass Bernard, G. 55 yd run Washington, T. 5 yd run
3 7 11
4 14 7
Score 28 35
Conversion Moore, T. kick Moore, Ju. kick Moore, Ju. kick Moore, T. kick Sims, D. rush Moore, T. kick Moore, T. kick Moore, Ju. kick
UNC FIRST DOWNS . . . . . . . . . . . . . . . . . . . . . . . . . . .15 RUSHING . . . . . . . . . . . . . . . . . . . . . . . . . . . . . . .6 PASSING . . . . . . . . . . . . . . . . . . . . . . . . . . . . . . .8 PENALTY . . . . . . . . . . . . . . . . . . . . . . . . . . . . . . .1 NET YARDS RUSHING . . . . . . . . . . . . . . . . . . . . .128 RUSHING ATTEMPTS . . . . . . . . . . . . . . . . . . . . . .27 AVERAGE PER RUSH . . . . . . . . . . . . . . . . . . . . . .4.7 RUSHING TOUCHDOWNS . . . . . . . . . . . . . . . . . . . .2 YARDS GAINED RUSHING . . . . . . . . . . . . . . . . . .175 YARDS LOST RUSHING . . . . . . . . . . . . . . . . . . . .47 NET YARDS PASSING . . . . . . . . . . . . . . . . . . . . . .204 COMPLETIONS-ATTEMPTS-INT . . . . . . . . . . .17-25-2 AVERAGE PER ATTEMPT . . . . . . . . . . . . . . . . . . .8.2 AVERAGE PER COMPLETION . . . . . . . . . . . . . . .12.0 PASSING TOUCHDOWNS . . . . . . . . . . . . . . . . . . . .2 TOTAL OFFENSE YARDS . . . . . . . . . . . . . . . . . . . .332 TOTAL OFFENSE PLAYS . . . . . . . . . . . . . . . . . . . .52 AVERAGE GAIN PER PLAY . . . . . . . . . . . . . . . . . .6.4 FUMBLES: NUMBER-LOST . . . . . . . . . . . . . . . . . . .1-0 PENALTIES: NUMBER-YARDS . . . . . . . . . . . . . . . .6-40 PUNTS-YARDS . . . . . . . . . . . . . . . . . . . . . . . . .4-165 AVERAGE YARDS PER PUNT . . . . . . . . . . . . . . . .41.2 NET YARDS PER PUNT . . . . . . . . . . . . . . . . . . .39.5 INSIDE 20 . . . . . . . . . . . . . . . . . . . . . . . . . . . . . .0 50+ YARDS . . . . . . . . . . . . . . . . . . . . . . . . . . . . .0 TOUCHBACKS . . . . . . . . . . . . . . . . . . . . . . . . . . . .0 FAIR CATCH . . . . . . . . . . . . . . . . . . . . . . . . . . . . .3 KICKOFFS-YARDS . . . . . . . . . . . . . . . . . . . . . . .5-325 AVERAGE YARDS PER KICKOFF . . . . . . . . . . . . .65.0 NET YARDS PER KICKOFF . . . . . . . . . . . . . . . . .42.8 TOUCHBACKS . . . . . . . . . . . . . . . . . . . . . . . . . . . .0 PUNT RETURNS: NUMBER-YARDS-TD . . . . . . . . .0-0-0 AVERAGE PER RETURN . . . . . . . . . . . . . . . . . . . .0.0 KICKOFF RETURNS: NUMBER-YDS-TD . . . . . . .7-127-0 AVERAGE PER RETURN . . . . . . . . . . . . . . . . . . .18.1 INTERCEPTIONS: NUMBER-YDS-TD . . . . . . . . . .1-20-0 FUMBLE RETURNS: NUMBER-YDS-TD . . . . . . . . .0-0-0 MISCELLANEOUS YARDS . . . . . . . . . . . . . . . . . . . . .0 POSSESSION TIME . . . . . . . . . . . . . . . . . . . . . .23:53 THIRD-DOWN CONVERSIONS . . . . . . . . . . . . .3 OF 8 FOURTH-DOWN CONVERSIONS . . . . . . . . . . . .0 OF 0 RED-ZONE SCORES-CHANCES . . . . . . . . . . . . . . . .3-3 TOUCHDOWNS . . . . . . . . . . . . . . . . . . . . . . . . .3-3 FIELD GOALS . . . . . . . . . . . . . . . . . . . . . . . . . . .0-3 SACKS BY: NUMBER-YARDS . . . . . . . . . . . . . . . . . .0-0 PAT KICKS . . . . . . . . . . . . . . . . . . . . . . . . . . . . . .4-4 FIELD GOALS . . . . . . . . . . . . . . . . . . . . . . . . . . . .0-0
GT . . . . . .21 . . . . . .15 . . . . . . .5 . . . . . . .1 . . . . .312 . . . . . .58 . . . . .5.4 . . . . . . .3 . . . . .335 . . . . . .23 . . . . .184 . .10-14-1 . . . . .13.1 . . . . .18.4 . . . . . . .1 . . . . .496 . . . . . .72 . . . . .6.9 . . . . .1-1 . . . .3-23 . . . .3-92 . . . . .30.7 . . . . .24.0 . . . . . . .1 . . . . . . .0 . . . . . . .1 . . . . . . .0 . . . .7-395 . . . . .56.4 . . . . .38.3 . . . . . . .0 . . . .1-7-0 . . . . . .7.0 . .5-111-0 . . . . .22.2 . . .2--2-0 . . . .0-0-0 . . . . . . .0 . . . .36:07 .10 OF 16 . . .0 OF 0 . . . . .4-6 . . . . .3-6 . . . . .1-6 . . . .7-44 . . . . .3-3 . . . . .2-3
TEAM STATISTICS Rushing NC -- Bernard 17-155, 2TD; Houston 1-2; Renner 9(-29) GT -- Smith 7-79; Washington 25-74, 2TD; Sims 13-71; Jones 7-59, 1TD; Peeples 5-27; Perkins 1-2 Passing NC -- Renner 17-25, 204, 2TD, 2INT GT -- Washington 10-14, 184, 1TD, INT Receiving NC -- Jones 7-85; Bernard 5-47; Ebron 2-44, 1TD; Thorpe 1-18; Hurst 1-6, 1TD; Boyd 1-4 GT -- S. Hill 6-151, 1TD; Melton 2-12; Smith 1-21; Jones 1-0
RAMBLINWRECK.COM
GAME #5 (21/21) Georgia
NC State
Tech 45 35
October 1, 2011 | Raleigh, N.C. Carter-Finley Stadium | 55,811 Georgia Tech's offense kept on scoring - and the defense put up an important touchdown, too. It all added up to the Yellow Jackets' best start since they were national champions. Orwin Smith rushed for three touchdowns and No. 21 Georgia Tech used a fourth-quarter flurry of points to beat North Carolina State 45-35 to extend its best start in more than 20 years. Smith finished with 74 yards and scored on runs of 13, 9 and 3 yards. The Yellow Jackets (5-0, 2-0 ACC) were held to a season-low 413 total yards -- they entered averaging 630.5 yards per game -- but opened with five wins for the first time since their national championship season in 1990. Georgia Tech led 21-0, briefly allowed N.C. State to make a game of it in the third quarter and pulled away with three touchdowns in a 2-minute, 22-second span of the fourth. Mike Glennon was 20 of 29 for 163 yards with touchdown passes covering 9 yards to Jay Smith and 1 yard to Tyler Purvis for the Wolfpack (2-3, 0-2). Tevin Washington completed just four passes for Georgia Tech -- but two were touchdowns, covering 9 yards to David Sims and 38 yards to Roddy Jones. He rushed for 43 yards but finished 4 of 12 for 117 yards through the air. James Washington rushed for a career-high 131 yards for the Wolfpack. His 46-yard touchdown run got N.C. State within a score, down 21-14. That's when Georgia Tech used a scoring flurry befitting the nation's most productive offense to take a huge lead. Smith closed a 13-play drive that demoralized N.C. State by taking a pitch from Tevin Washington around right end and diving across the goal line with 12:29 left. On State's next offensive play, Isaiah Johnson picked off Glennon's pass and returned it for a score, and Tevin Washington hit Jones deep for a TD that made it 42-14 with 10:07 left. N.C. State made things interesting with two touchdowns in the final 34 seconds, including Brandan Bishop's 33-yard return of Synjyn Days' fumble with 20 seconds left to finish the scoring. Glennon made it 21-7 with 1:15 left in the half on his scoring pass to Smith, and N.C. State got within a score on Washington's long touchdown run on its first play of the second half. That came after it looked as though the Yellow Jackets would have their way against an N.C. State team that entered with one of the worst -- and most injury-riddled -- defenses in the ACC. Smith capped each of Georgia Tech's first two drives with touchdown runs. Four plays after Jemea Thomas took a snap on a fake punt and rumbled 27 yards for a first down, Smith took a pitch through the right side and ran 13 yards for a score. Then, he made it 14-0 with 3:34 left in the first quarter when he took a handoff 9 yards for his second touchdown. Washington then made it 21-0 with his short flip to Sims on the first play of the second quarter, giving Georgia Tech a 17330 advantage in total yards. Score by Quarters Georgia Tech NC State
GT GT GT ST ST GT GT GT ST GT ST ST
Qtr 1st 1st 2nd 2nd 3rd 4th 4th 4th 4th 4th 4th 4th
Time 10:35 3:34 14:55 1:15 13:22 12:29 12:15 10:07 7:47 5:38 0:34 0:20
1 14 0
2 7 7
3 0 7
Scoring Play Smith, O. 13 yd run Smith, O. 9 yd run Sims, D. 9 yd pass Smith, J. 9 yd pass Washington, J. 46 yd run Smith, O. 2 yd run Johnson, I. 34 yd INT Jones, R. 38 yd pass Purvis, T. 1 yd pass Moore, Ju. 40 yd FG Purvis, T. 13 yd pass Bishop, B. 33 yd fmbl rec.
4 24 21
Score 45 35
Conversion Moore, Ju. kick Moore, Ju. kick Moore, Ju. kick Sade, N. Kick Sade, N. Kick Moore, Ju. kick Moore, Ju. kick Moore, Ju. kick Sade, N. Kick Sade, N. Kick Sade, N. Kick
GT FIRST DOWNS . . . . . . . . . . . . . . . . . . . . . . . . . . .19 RUSHING . . . . . . . . . . . . . . . . . . . . . . . . . . . . . .13 PASSING . . . . . . . . . . . . . . . . . . . . . . . . . . . . . . .3 PENALTY . . . . . . . . . . . . . . . . . . . . . . . . . . . . . . .3 NET YARDS RUSHING . . . . . . . . . . . . . . . . . . . . .296 RUSHING ATTEMPTS . . . . . . . . . . . . . . . . . . . . . .52 AVERAGE PER RUSH . . . . . . . . . . . . . . . . . . . . . .5.7 RUSHING TOUCHDOWNS . . . . . . . . . . . . . . . . . . . .3 YARDS GAINED RUSHING . . . . . . . . . . . . . . . . . .307 YARDS LOST RUSHING . . . . . . . . . . . . . . . . . . . .11 NET YARDS PASSING . . . . . . . . . . . . . . . . . . . . . .117 COMPLETIONS-ATTEMPTS-INT . . . . . . . . . . . .4-12-0 AVERAGE PER ATTEMPT . . . . . . . . . . . . . . . . . . .9.8 AVERAGE PER COMPLETION . . . . . . . . . . . . . . .29.2 PASSING TOUCHDOWNS . . . . . . . . . . . . . . . . . . . .2
2011 GEORGIA TECH FOOTBALL
NCS . . . . . .22 . . . . . . .8 . . . . . .13 . . . . . . .1 . . . . .195 . . . . . .38 . . . . .5.1 . . . . . . .1 . . . . .218 . . . . . .23 . . . . .192 . .23-36-1 . . . . .5.3 . . . . .8.3 . . . . . . .3
TOTAL OFFENSE YARDS . . . . . . . . . . . . . . . . . . . .413 TOTAL OFFENSE PLAYS . . . . . . . . . . . . . . . . . . . .64 AVERAGE GAIN PER PLAY . . . . . . . . . . . . . . . . . .6.5 FUMBLES: NUMBER-LOST . . . . . . . . . . . . . . . . . . .4-1 PENALTIES: NUMBER-YARDS . . . . . . . . . . . . . . . .4-45 PUNTS-YARDS . . . . . . . . . . . . . . . . . . . . . . . . . .2-62 AVERAGE YARDS PER PUNT . . . . . . . . . . . . . . . .31.0 NET YARDS PER PUNT . . . . . . . . . . . . . . . . . . .29.0 INSIDE 20 . . . . . . . . . . . . . . . . . . . . . . . . . . . . . .0 50+ YARDS . . . . . . . . . . . . . . . . . . . . . . . . . . . . .0 TOUCHBACKS . . . . . . . . . . . . . . . . . . . . . . . . . . . .0 FAIR CATCH . . . . . . . . . . . . . . . . . . . . . . . . . . . . .1 KICKOFFS-YARDS . . . . . . . . . . . . . . . . . . . . . . .8-532 AVERAGE YARDS PER KICKOFF . . . . . . . . . . . . .66.5 NET YARDS PER KICKOFF . . . . . . . . . . . . . . . . .45.2 TOUCHBACKS . . . . . . . . . . . . . . . . . . . . . . . . . . . .1 PUNT RETURNS: NUMBER-YARDS-TD . . . . . . . . .0-0-0 AVERAGE PER RETURN . . . . . . . . . . . . . . . . . . . .0.0 KICKOFF RETURNS: NUMBER-YDS-TD . . . . . . . .5-72-0 AVERAGE PER RETURN . . . . . . . . . . . . . . . . . . .14.4 INTERCEPTIONS: NUMBER-YDS-TD . . . . . . . . . .1-34-1 FUMBLE RETURNS: NUMBER-YDS-TD . . . . . . . . .0-0-0 MISCELLANEOUS YARDS . . . . . . . . . . . . . . . . . . . . .0 POSSESSION TIME . . . . . . . . . . . . . . . . . . . . . .27:51 THIRD-DOWN CONVERSIONS . . . . . . . . . . . . .4 OF 12 FOURTH-DOWN CONVERSIONS . . . . . . . . . . . .1 OF 2 RED-ZONE SCORES-CHANCES . . . . . . . . . . . . . . . .5-6 TOUCHDOWNS . . . . . . . . . . . . . . . . . . . . . . . . .4-6 FIELD GOALS . . . . . . . . . . . . . . . . . . . . . . . . . . .1-6 SACKS BY: NUMBER-YARDS . . . . . . . . . . . . . . . . .2-18 PAT KICKS . . . . . . . . . . . . . . . . . . . . . . . . . . . . . .6-6 FIELD GOALS . . . . . . . . . . . . . . . . . . . . . . . . . . . .1-1
. . . . .387 . . . . . .74 . . . . .5.2 . . . . .2-0 . . . .7-35 . . . .3-106 . . . . .35.3 . . . . .35.3 . . . . . . .0 . . . . . . .0 . . . . . . .0 . . . . . . .3 . . . .4-244 . . . . .61.0 . . . . .43.0 . . . . . . .0 . . . .1-4-0 . . . . .4.0 . .7-150-0 . . . . .21.4 . . . .0-0-0 . . .1-33-1 . . . . . . .0 . . . .32:09 . .5 OF 14 . . .3 OF 5 . . . . .3-4 . . . . .3-4 . . . . .0-4 . . . . .1-3 . . . . .5-5 . . . . .0-1
TEAM STATISTICS Rushing GT -- Smith 9-74, 3TD; Sims 9-73; Washington 16-43; Thomas 127; Jones 4-26; Lyons 5-22; Peeples 3-20; Days 2-5; S. Hill 1-5; Zenon 1-2 ST -- Washington 20-131, 1TD; Creecy 12-77; Barnes 3-10; Glennon 3 (-23) Passing GT -- Washington 4-12, 117, 2TD ST -- Glennon 20-29, 163, 2TD, INT; Brosius 3-7, 29, 1TD Receiving GT -- S. Hill 1-40; Jones 1-38, 1TD; Smith 1-30; Sims 1-9, 1TD ST -- Washington 5-35; Purvis 4-33, 2TD; Howard 3-48; Bryan 326; Smith 3-24, 1TD; Carter 2-16; Palmer 2-6; Gentry 1-4
GAME #6
Maryland 16 (13/13) Georgia Tech 21 October 8, 2011 | Atlanta, Ga. Bobby Dodd Stadium | 45,905 Tevin Washington ran for 120 yards and two touchdowns and No. 13 Georgia Tech's least impressive offensive showing of the season was enough to beat Maryland 21-16. Georgia Tech led 21-3 before holding off the Terrapins' fourth-quarter comeback. Georgia Tech (6-0 overall, 3-0 Atlantic Coast Conference) matched its wins total from 2010, when it finished 6-7. The Yellow Jackets averaged almost 52 points in their first five wins and began the day ranked first in the nation in rushing and second in scoring. Quarterback C.J. Brown, who replaced starter Danny O'Brien, had a 77-yard touchdown run early in the fourth quarter for Maryland (2-3, 1-1). Davin Meggett, who had 86 yards rushing, scored from the 1 with 7:33 remaining to cut the lead to 21-16. But Maryland was stopped on a fourth-and-8 play from its 46 on Brown's incomplete pass with 2:31 remaining, ending its comeback bid. Brown was 4-of-17 passing for 36 yards and an interception. He had nine carries for 124 yards. O'Brien was replaced after completing only 1 of 6 passes for 17 yards and an interception. Washington had scoring runs of 7 yards in the first quarter and 3 yards in the third. Orwin Smith had a 10-yard scoring run in the second quarter. Maryland's only points in the first three quarters were Nick Ferrara's 30-yard field goal at the end of a 14-play drive on the Terrapins' first possession. Washington was Georgia Tech's leading rusher, but he struggled as a passer as he completed only 6 of 19 passes for 114 yards and an interception. Maryland is left with a possible quarterback controversy. Coach Randy Edsall pulled O'Brien after the sophomore's second-quarter interception, his sixth of the year. Brown took over and remained in the game after he was picked off by Rod Sweeting in the end zone in the third quarter.
Georgia Tech led 14-3 at halftime but wasted two secondquarter chances to stretch the lead. Linebacker Quayshawn Nealy, making only his second career start, intercepted a pass from O'Brien to give the Yellow Jackets the ball at Maryland's 28. A false-start penalty helped stall the drive after one first down, and Justin Moore was wide left on a 34-yard field goal attempt. Maryland turned to Brown on its next possession. Maryland left guard Andrew Gonnella was taken off the field in an ambulance after suffering an apparent left leg injury in the fourth quarter. With most Maryland players standing or kneeling on the field, the game was delayed for about 15 minutes as medical personnel from each team worked in a circle around Gonnella. A cart was first driven on the field but then left as the ambulance followed. Score by Quarters Maryland Georgia Tech
GT MD GT GT MD MD
Qtr 1st 1st 2nd 3rd 4th 4th
Time 10:26 03:27 09:17 12:51 12:01 07:33
1 3 7
2 0 7
Scoring Play Washington, T. 7 yd run Ferrara 30 yd field goal Smith, O. 10 yd run Washington, T. 3 yd run Brown 77 yd run Meggett 1 yd run
3 0 7
4 13 0
Score 16 21
Conversion Moore, Ju. kick 14-68 Moore, Ju. kick Moore, Ju. kick Ferrara kick Brown pass failed
MD GT FIRST DOWNS . . . . . . . . . . . . . . . . . . . . . . . . . . .18 . . . . . .21 Rushing . . . . . . . . . . . . . . . . . . . . . . . . . . . . . . .12 . . . . . .16 Passing . . . . . . . . . . . . . . . . . . . . . . . . . . . . . . . .4 . . . . . . .5 Penalty . . . . . . . . . . . . . . . . . . . . . . . . . . . . . . . . .2 . . . . . . .0 NET YARDS RUSHING . . . . . . . . . . . . . . . . . . . . .246 . . . . .272 Rushing Attempts . . . . . . . . . . . . . . . . . . . . . . . .41 . . . . . .60 Average Per Rush . . . . . . . . . . . . . . . . . . . . . . . .6.0 . . . . .4.5 Rushing Touchdowns . . . . . . . . . . . . . . . . . . . . . . .2 . . . . . . .3 Yards Gained Rushing . . . . . . . . . . . . . . . . . . . .261 . . . . .285 Yards Lost Rushing . . . . . . . . . . . . . . . . . . . . . . .15 . . . . . .13 NET YARDS PASSING . . . . . . . . . . . . . . . . . . . . . . .87 . . . . .114 Completions-Attempts-Int . . . . . . . . . . . . . . . .6-24-2 . . .6-21-1 Average Per Attempt . . . . . . . . . . . . . . . . . . . . . .3.6 . . . . .5.4 Average Per Completion . . . . . . . . . . . . . . . . . .14.5 . . . . .19.0 Passing Touchdowns . . . . . . . . . . . . . . . . . . . . . . .0 . . . . . . .0 TOTAL OFFENSE YARDS . . . . . . . . . . . . . . . . . . . .333 . . . . .386 Total offense plays . . . . . . . . . . . . . . . . . . . . . . . .65 . . . . . .81 Average Gain Per Play . . . . . . . . . . . . . . . . . . . . .5.1 . . . . .4.8 Fumbles: Number-Lost . . . . . . . . . . . . . . . . . . . . .0-0 . . . . .1-0 Penalties: Number-Yards . . . . . . . . . . . . . . . . . . . .1-5 . . . .8-63 PUNTS-YARDS . . . . . . . . . . . . . . . . . . . . . . . . .4-181 . . . .5-191 Average Yards Per Punt . . . . . . . . . . . . . . . . . . .45.2 . . . . .38.2 Net Yards Per Punt . . . . . . . . . . . . . . . . . . . . . .38.0 . . . . .37.6 Inside 20 . . . . . . . . . . . . . . . . . . . . . . . . . . . . . . .1 . . . . . . .1 50+ Yards . . . . . . . . . . . . . . . . . . . . . . . . . . . . . .2 . . . . . . .0 Touchbacks . . . . . . . . . . . . . . . . . . . . . . . . . . . . . .0 . . . . . . .0 Fair catch . . . . . . . . . . . . . . . . . . . . . . . . . . . . . . .1 . . . . . . .0 KICKOFFS-YARDS . . . . . . . . . . . . . . . . . . . . . . .4-272 . . . .4-243 Average Yards Per Kickoff . . . . . . . . . . . . . . . . .68.0 . . . . .60.8 Net Yards Per Kickoff . . . . . . . . . . . . . . . . . . . . .34.2 . . . . .42.8 Touchbacks . . . . . . . . . . . . . . . . . . . . . . . . . . . . . .1 . . . . . . .1 Punt returns: Number-Yards-TD . . . . . . . . . . . . .2-3-0 . . .2-29-0 Average Per Return . . . . . . . . . . . . . . . . . . . . . . .1.5 . . . . .14.5 Kickoff returns: Number-Yds-TD . . . . . . . . . . . .3-52-0 . .3-115-0 Average Per Return . . . . . . . . . . . . . . . . . . . . . .17.3 . . . . .38.3 Interceptions: Number-Yds-TD . . . . . . . . . . . . . .1-0-0 . . .2-10-0 Fumble Returns: Number-Yds-TD . . . . . . . . . . . .0-0-0 . . . .0-0-0 Miscellaneous Yards . . . . . . . . . . . . . . . . . . . . . . . . .0 . . . . . . .0 Possession Time . . . . . . . . . . . . . . . . . . . . . . . .24:32 . . . .35:28 1st Quarter . . . . . . . . . . . . . . . . . . . . . . . . . . . 7:36 . . . . 7:24 2nd Quarter . . . . . . . . . . . . . . . . . . . . . . . . . . 5:34 . . . . 9:26 3rd Quarter . . . . . . . . . . . . . . . . . . . . . . . . . . . 6:32 . . . . 8:28 4th Quarter . . . . . . . . . . . . . . . . . . . . . . . . . . . 4:50 . . . .10:10 Third-Down Conversions . . . . . . . . . . . . . . . . .4 of 13 . .13 of 20 Fourth-Down Conversions . . . . . . . . . . . . . . . . .2 of 4 . . . .0 of 1 Red-Zone Scores-Chances . . . . . . . . . . . . . . . . . . .2-3 . . . . .3-5 Touchdowns . . . . . . . . . . . . . . . . . . . . . . . . . . .1-3 . . . . .3-5 Field goals . . . . . . . . . . . . . . . . . . . . . . . . . . . . .1-3 . . . . .0-5 Sacks By: Number-Yards . . . . . . . . . . . . . . . . . . . .0-0 . . . . .1-9 PAT Kicks . . . . . . . . . . . . . . . . . . . . . . . . . . . . . . .1-1 . . . . .3-3 Field Goals . . . . . . . . . . . . . . . . . . . . . . . . . . . . . .1-1 . . . . .0-1 TEAM STATISTICS Rushing MD -- Brown 9-124, 1TD; Meggett 18-86, 1TD; Pickett 10-33; McCree 1-14; Tyler 1-0; O’Brien 1 (-9) GT -- Washington 32-120, 2TD; Sims 14-83; Smith 4-41, 1TD; Lyons 4-14; Zenon 2-12; Jones 2-6 Passing MD -- Brown 4-17, 36, INT; O’Brien 1-6, 17, INT; Logan 1-1, 34 GT -- Washington 6-19, 114, INT Receiving MD -- Dorsey 2-44; Tyler 2-26; Boykins 1-17; Pickett 1-0 GT -- S. Hill 2-50; Smith 2-37; Melton 2-27
RAMBLINWRECK.COM
GAME #7 (12/12) Georgia
Virginia
Tech 21 24
October 15, 2011 | Charlottesville, Va. Scott Stadium | 47,692 The Virginia Cavaliers beat No. 12 Georgia Tech at its own game, 24-21. Georgia Tech (6-1, 3-1), off to its best start since 1966, came in with one of the nation's top offenses, but it was held to just two pass completions and a season-low 296 yards by a Virginia defense that made the most of an extra week to prepare. The Cavaliers (4-2, 1-1 ACC) sealed the victory by holding onto the ball for the final 6 minutes, making five first downs to get inside the Yellow Jackets' 5. But they didn't need to score, and when quarterback Michael Rocco took a knee for a 3-yard loss on the game's final play, thousand of fans surged onto the field at Scott Stadium. Kevin Parks ran for one touchdown for Virginia, Rocco hit Tim Smith for a 37-yarder and Clifton Richardson had a 22-yard run, all in the first half, as Virginia built a 24-14 lead. Georgia Tech almost struck very quickly to start the second half, with Tevin Washington running 85 yards on the first play from scrimmage, but the play was called back by a penalty. The Yellow Jackets then did it the hard way, using 19 plays and converting two fourth-and-1 plays and a fourth-and-5 before Washington scored on a 1-yard run. The fourth-and-5 was initially a fourth-and-10, but defensive tackle Nick Jenkins was called for being offsides, and Washington ran for 23 yards on the next play to the Cavaliers' 5 and scored two plays later. The teams traded punts the rest of the way until Virginia took over at its 23 with just under 6 minutes left. Jones started with runs of 11 and eight yards, caught an 18-yard pass from Rocco to convert a third-and-6 from the Virginia 49 and the Cavaliers never gave it up. Virginia gained 407 yards against former coach Al Groh's 34 defense. The Yellow Jackets erased a 14-0 deficit with two touchdowns in 98 seconds in the second quarter. Washington capped an 80yard drive with a 7-yard touchdown run, and Rod Sweeting intercepted a Rocco pass three plays later and returned in 32 yards for the tying touchdown. Freshman David Watford came on at quarterback for one series for Virginia, and led a 72-yard scoring drive. He bulled his way for a first down on third-and-1, and also carried it the last 22 yards for the go-ahead touchdown. When Chase Minnifield intercepted a deep pass by Washington on the ensuing series, Rocco came back and led them 41 yards in eight plays to Robert Randolph's 36-yard field goal. Virginia struck quickly at the start with two touchdowns in the first 8:20. The Cavaliers drove 73 yards after the opening kickoff, a drive kept alive by Rocco's 8-yard pass to Tim Smith on third-and-3 from the 23. Two plays later, Parks took it in from the 6. The Yellow Jackets were penalized twice on their opening series, riling up the small crowd at Scott Stadium, and when Rocco hit Smith for 37 yards and a 14-0 lead, it got really loud. Score by Quarters Georgia Tech Virginia
VA VA GT GT VA VA GT
Qtr 1st 1st 2nd 2nd 2nd 2nd 3rd
Time 09:07 06:40 10:02 08:24 04:00 00:14 05:29
1 0 14
2 14 10
3 7 0
4 0 0
Score 21 24
Scoring Play Conversion Parks,K 6 yd run Randolph,R kick Smith 37 yd pass from Rocco Randolph,R kick Washington, T. 7 yd run Moore, Ju. kick Sweeting 32 yd INT return Moore, Ju. kick Richardson,C 22 yd run Randolph,R kick Randolph,R 36 yd field goal Washington, T. 1 yd run Scully, D. kick
GT FIRST DOWNS . . . . . . . . . . . . . . . . . . . . . . . . . . .17 Rushing . . . . . . . . . . . . . . . . . . . . . . . . . . . . . . .16 Passing . . . . . . . . . . . . . . . . . . . . . . . . . . . . . . . .1 Penalty . . . . . . . . . . . . . . . . . . . . . . . . . . . . . . . . .0 NET YARDS RUSHING . . . . . . . . . . . . . . . . . . . . .272 Rushing Attempts . . . . . . . . . . . . . . . . . . . . . . . .53 Average Per Rush . . . . . . . . . . . . . . . . . . . . . . . .5.1 Rushing Touchdowns . . . . . . . . . . . . . . . . . . . . . . .2 Yards Gained Rushing . . . . . . . . . . . . . . . . . . . .290 Yards Lost Rushing . . . . . . . . . . . . . . . . . . . . . . .18 NET YARDS PASSING . . . . . . . . . . . . . . . . . . . . . . .24 Completions-Attempts-Int . . . . . . . . . . . . . . . .2-8-2 Average Per Attempt . . . . . . . . . . . . . . . . . . . . . .3.0 Average Per Completion . . . . . . . . . . . . . . . . . .12.0 Passing Touchdowns . . . . . . . . . . . . . . . . . . . . . . .0 TOTAL OFFENSE YARDS . . . . . . . . . . . . . . . . . . . .296 Total offense plays . . . . . . . . . . . . . . . . . . . . . . . .61 Average Gain Per Play . . . . . . . . . . . . . . . . . . . . .4.9 Fumbles: Number-Lost . . . . . . . . . . . . . . . . . . . . .1-0
2011 GEORGIA TECH FOOTBALL
VA . . . . . .21 . . . . . .15 . . . . . . .6 . . . . . . .0 . . . . .272 . . . . . .47 . . . . .5.8 . . . . . . .2 . . . . .288 . . . . . .16 . . . . .135 . . .9-19-1 . . . . . .7.1 . . . . .15.0 . . . . . . .1 . . . . .407 . . . . . .66 . . . . .6.2 . . . . .2-0
Penalties: Number-Yards . . . . . . . . . . . . . . . . . . .5-40 . . . .4-25 PUNTS-YARDS . . . . . . . . . . . . . . . . . . . . . . . . .4-137 . . . .2-79 Average Yards Per Punt . . . . . . . . . . . . . . . . . . .34.2 . . . . .39.5 Net Yards Per Punt . . . . . . . . . . . . . . . . . . . . . .31.0 . . . . .31.5 Inside 20 . . . . . . . . . . . . . . . . . . . . . . . . . . . . . . .0 . . . . . . .1 50+ Yards . . . . . . . . . . . . . . . . . . . . . . . . . . . . . .0 . . . . . . .0 Touchbacks . . . . . . . . . . . . . . . . . . . . . . . . . . . . . .0 . . . . . . .0 Fair catch . . . . . . . . . . . . . . . . . . . . . . . . . . . . . . .2 . . . . . . .0 KICKOFFS-YARDS . . . . . . . . . . . . . . . . . . . . . . .4-251 . . . .5-327 Average Yards Per Kickoff . . . . . . . . . . . . . . . . .62.8 . . . . .65.4 Net Yards Per Kickoff . . . . . . . . . . . . . . . . . . . . .38.2 . . . . .48.2 Touchbacks . . . . . . . . . . . . . . . . . . . . . . . . . . . . . .0 . . . . . . .2 Punt returns: Number-Yards-TD . . . . . . . . . . . .1-16-0 . . .1-13-0 Average Per Return . . . . . . . . . . . . . . . . . . . . . .16.0 . . . . .13.0 Kickoff returns: Number-Yds-TD . . . . . . . . . . . .3-46-0 . . .4-98-0 Average Per Return . . . . . . . . . . . . . . . . . . . . . .15.3 . . . . .24.5 Interceptions: Number-Yds-TD . . . . . . . . . . . . .1-32-1 . . . .2-0-0 Fumble Returns: Number-Yds-TD . . . . . . . . . . . .0-0-0 . . . .0-0-0 Miscellaneous Yards . . . . . . . . . . . . . . . . . . . . . . . . .0 . . . . . . .7 Possession Time . . . . . . . . . . . . . . . . . . . . . . . .29:59 . . . .30:01 1st Quarter . . . . . . . . . . . . . . . . . . . . . . . . . . . 6:12 . . . . 8:48 2nd Quarter . . . . . . . . . . . . . . . . . . . . . . . . . . 6:25 . . . . 8:35 3rd Quarter . . . . . . . . . . . . . . . . . . . . . . . . . .13:21 . . . . 1:39 4th Quarter . . . . . . . . . . . . . . . . . . . . . . . . . . . 4:01 . . . .10:59 Third-Down Conversions . . . . . . . . . . . . . . . . .6 of 14 . . .7 of 13 Fourth-Down Conversions . . . . . . . . . . . . . . . . .3 of 3 . . . .0 of 1 Red-Zone Scores-Chances . . . . . . . . . . . . . . . . . . .2-2 . . . . .2-4 Touchdowns . . . . . . . . . . . . . . . . . . . . . . . . . . .2-2 . . . . .1-4 Field goals . . . . . . . . . . . . . . . . . . . . . . . . . . . . .0-2 . . . . .1-4 Sacks By: Number-Yards . . . . . . . . . . . . . . . . . . . .1-6 . . . . .0-0 PAT Kicks . . . . . . . . . . . . . . . . . . . . . . . . . . . . . . .3-3 . . . . .3-3 Field Goals . . . . . . . . . . . . . . . . . . . . . . . . . . . . . .0-1 . . . . .1-2 TEAM STATISTICS Rushing GT -- Washington 26-115, 2TD; Peeples 4-37; Sims 11-35; Jones 428; O. Smith 5-24; S. Hill 1-24; Lyons 1-5; Melton 1-4 VA -- Jones 18-149; Parks 17-86, 1TD; Richardson 5-32, 1TD; Watford 2-15; Rocco 2 (-5) Passing GT -- Washington 2-8, 24, 2INT VA -- Rocco 8-14, 118, 1TD, INT; Watford 1-5, 17 Receiving GT -- O. Smith 1-21; Melton 1-3 VA -- Jones 3-37; T. Smith 2-45, 1TD; Milien 2-20; Burd 1-30; Freedman 1-3
GAME #8 (20/19) Georgia
Tech
Miami
7 24
October 22, 2011 | Miami Gardens, Fla. Sun Life Stadium | 43,716 JoJo Nicholas recovered a fumbled punt for a touchdown plus added an interception, Lamar Miller ran for 93 yards and a score and Miami's banged-up defense was dominant as the Hurricanes topped No. 20 Georgia Tech 24-7 -- holding the high-octane Yellow Jackets more than 300 yards and nearly 36 points below their season averages entering the game. Mike James also had a touchdown run for Miami (4-3, 2-2 Atlantic Coast Conference), which won consecutive games for the first time this season and has now beaten Georgia Tech three straight times. Georgia Tech (6-2, 3-2) came into Saturday averaging 517 yards of offense. The Yellow Jackets got only 211 on Saturday, their lowest total since a loss to Iowa in the Orange Bowl after the 2009 season. In its last 35 games, Georgia Tech has rushed for less than 200 yards only three times, all at Sun Life Stadium-95 at Miami in 2009, 143 in the Orange Bowl and 134 in this one. Washington threw right to Nicholas on the Yellow Jackets' first offensive snap of the game, a mistake that set Miami up at the Georgia Tech 46. It was doubly costly for the Yellow Jackets, with center Jay Finch going down with what appeared to be a knee injury and eventually getting carted off the sideline for evaluation. The Hurricanes needed 12 plays to score from there, Harris extending the drive with a 13-yard pass to Phillip Dorsett on fourth-and-3 from the 39, and James later capping it with a 2yard run for a 7-0 Miami lead. With 10:17 left in the half, Nicholas found himself again in the right place at the right time for Miami. Zach Laskey dropped back to receive a punt for Georgia Tech, the bouncing ball coming straight at him as he stood at the 9yard line. He tried to grab it as a horde of Hurricanes sprinted toward him, misplayed it and could only watch as the football kept going into the end zone. Nicholas dove on it just past the goal line for a touchdown that put Miami up 14-0.
In the first half alone, Georgia Tech failed on a fake-punt attempt, had the interception to help create one Miami touchdown and then the blown punt return to give the Hurricanes seven more points. Nonetheless, with 1:02 left in the half, the Yellow Jackets were within 14-7. A 20-play, 92-yard drive for Georgia Tech on the scoreboard. Washington completed all three of his attempted passes during the marathon possession, plus rushed the ball nine times for 22 yards--including a 1-yard touchdown plunge. Travis Benjamin ran the ensuing kickoff back 48 yards, and Harris hit Tommy Streeter with a 32-yard gain on first down to get Miami to the Georgia Tech 14. Two plays later, Miller ran up the middle for a touchdown from there with 25 seconds left in the half, restoring the 14-point cushion and getting help from a sealing block by guard Jon Feliciano. It was a costly celebration. Feliciano got hurt jumping around after the score, leaving the game with a leg injury. He rejoined his teammates on the sideline late in the third quarter, on crutches and wearing a walking boot on his left ankle. An X-ray was negative, but Golden is not sure of Feliciano's status. Score by Quarters Georgia Tech Miami
UM UM GT UM UM
Qtr 1st 2nd 2nd 2nd 4th
Time 08:17 10:17 01:02 00:25 13:55
1 0 7
2 7 14
3 0 0
4 0 3
Score 7 24
Scoring Play Conversion James, M. 2 yd run Wieclaw, J. kick Nicolas 0 yd fumble rec. Wieclaw, J. kick Washington, T. 1 yd run Moore, Ju. kick Miller, L. 14 yd run Wieclaw, J. kick Wieclaw, J. 39 yd field goal
GT UM FIRST DOWNS . . . . . . . . . . . . . . . . . . . . . . . . . . .14 . . . . . .14 Rushing . . . . . . . . . . . . . . . . . . . . . . . . . . . . . . . .9 . . . . . . .8 Passing . . . . . . . . . . . . . . . . . . . . . . . . . . . . . . . .5 . . . . . . .6 Penalty . . . . . . . . . . . . . . . . . . . . . . . . . . . . . . . . .0 . . . . . . .0 NET YARDS RUSHING . . . . . . . . . . . . . . . . . . . . .134 . . . . .122 Rushing Attempts . . . . . . . . . . . . . . . . . . . . . . . .48 . . . . . .41 Average Per Rush . . . . . . . . . . . . . . . . . . . . . . . .2.8 . . . . .3.0 Rushing Touchdowns . . . . . . . . . . . . . . . . . . . . . . .1 . . . . . . .2 Yards Gained Rushing . . . . . . . . . . . . . . . . . . . .150 . . . . .148 Yards Lost Rushing . . . . . . . . . . . . . . . . . . . . . . .16 . . . . . .26 NET YARDS PASSING . . . . . . . . . . . . . . . . . . . . . . .77 . . . . .140 Completions-Attempts-Int . . . . . . . . . . . . . . . .7-14-1 . . .8-23-1 Average Per Attempt . . . . . . . . . . . . . . . . . . . . . .5.5 . . . . .6.1 Average Per Completion . . . . . . . . . . . . . . . . . .11.0 . . . . .17.5 Passing Touchdowns . . . . . . . . . . . . . . . . . . . . . . .0 . . . . . . .0 TOTAL OFFENSE YARDS . . . . . . . . . . . . . . . . . . . .211 . . . . .262 Total offense plays . . . . . . . . . . . . . . . . . . . . . . . .62 . . . . . .64 Average Gain Per Play . . . . . . . . . . . . . . . . . . . . .3.4 . . . . .4.1 Fumbles: Number-Lost . . . . . . . . . . . . . . . . . . . . .3-2 . . . . .1-0 Penalties: Number-Yards . . . . . . . . . . . . . . . . . . .2-10 . . . . .1-5 PUNTS-YARDS . . . . . . . . . . . . . . . . . . . . . . . . .5-185 . . . .4-186 Average Yards Per Punt . . . . . . . . . . . . . . . . . . .37.0 . . . . .46.5 Net Yards Per Punt . . . . . . . . . . . . . . . . . . . . . .37.4 . . . . .43.8 Inside 20 . . . . . . . . . . . . . . . . . . . . . . . . . . . . . . .0 . . . . . . .2 50+ Yards . . . . . . . . . . . . . . . . . . . . . . . . . . . . . .1 . . . . . . .2 Touchbacks . . . . . . . . . . . . . . . . . . . . . . . . . . . . . .0 . . . . . . .1 Fair catch . . . . . . . . . . . . . . . . . . . . . . . . . . . . . . .3 . . . . . . .0 KICKOFFS-YARDS . . . . . . . . . . . . . . . . . . . . . . .2-134 . . . .5-349 Average Yards Per Kickoff . . . . . . . . . . . . . . . . .67.0 . . . . .69.8 Net Yards Per Kickoff . . . . . . . . . . . . . . . . . . . . .33.0 . . . . .52.8 Touchbacks . . . . . . . . . . . . . . . . . . . . . . . . . . . . . .1 . . . . . . .2 Punt returns: Number-Yards-TD . . . . . . . . . . . . .1--9-0 . . .1--2-0 Average Per Return . . . . . . . . . . . . . . . . . . . . . .-9.0 . . . . .-2.0 Kickoff returns: Number-Yds-TD . . . . . . . . . . . .3-45-0 . . .1-48-0 Average Per Return . . . . . . . . . . . . . . . . . . . . . .15.0 . . . . .48.0 Interceptions: Number-Yds-TD . . . . . . . . . . . . . .1-5-0 . . . .1-0-0 Fumble Returns: Number-Yds-TD . . . . . . . . . . . .0-0-0 . . . .0-0-1 Miscellaneous Yards . . . . . . . . . . . . . . . . . . . . . . . . .0 . . . . . . .0 Possession Time . . . . . . . . . . . . . . . . . . . . . . . .29:24 . . . .30:36 1st Quarter . . . . . . . . . . . . . . . . . . . . . . . . . . . 4:44 . . . .10:16 2nd Quarter . . . . . . . . . . . . . . . . . . . . . . . . . .11:53 . . . . 3:07 3rd Quarter . . . . . . . . . . . . . . . . . . . . . . . . . . . 9:33 . . . . 5:27 4th Quarter . . . . . . . . . . . . . . . . . . . . . . . . . . . 3:14 . . . .11:46 Third-Down Conversions . . . . . . . . . . . . . . . . .8 of 15 . . .5 of 14 Fourth-Down Conversions . . . . . . . . . . . . . . . . .0 of 2 . . . .2 of 3 Red-Zone Scores-Chances . . . . . . . . . . . . . . . . . . .1-1 . . . . .3-4 Touchdowns . . . . . . . . . . . . . . . . . . . . . . . . . . .1-1 . . . . .2-4 Field goals . . . . . . . . . . . . . . . . . . . . . . . . . . . . .0-1 . . . . .1-4 Sacks By: Number-Yards . . . . . . . . . . . . . . . . . . . .0-0 . . . . .2-4 PAT Kicks . . . . . . . . . . . . . . . . . . . . . . . . . . . . . . .1-1 . . . . .3-3 Field Goals . . . . . . . . . . . . . . . . . . . . . . . . . . . . . .0-0 . . . . .1-2 TEAM STATISTICS Rushing GT -- Washington 20-36, 1TD; Sims 10-29; O. Smith 5-28; Jones 316; Peeples 4-14; Lyons 2-9; Thomas 1-2; Days 2-1 UM -- Miller 27-93, 1TD; James 8-24, 1TD; Harris 4-7 Passing GT -- Washington 6-12, 63, INT; Days 1-2, 14 UM -- Harris, 8-23, 140, INT Receiving GT -- O. Smith 3-26; Peeples 1-16; Melton 1-14; Sims 1-12; Hill 1-9 UM -- Streeter 3-96; Dorsett 2-32; Benjamin 2-4; Clements 1-8
RAMBLINWRECK.COM
GAME #9 (rv/rv) Georgia
Tech
31 17
(6/6) Clemson October 29, 2011 | Atlanta, Ga. Bobby Dodd Stadium | 55,646
Tevin Washington rushed for 176 yards and broke the two longest runs of his career, leading Georgia Tech to a 31-17 upset of No. 6 Clemson and likely snuffing out the Tigers' national title hopes. The Yellow Jackets (7-2, 4-2 Atlantic Coast Conference) raced to a 24-3 halftime lead and held off Clemson (8-1, 5-1) which was off to its best start since 2000. The Tigers had climbed to fifth in the BCS standings. The Yellow Jackets snapped a two-game losing streak behind their junior quarterback, who had runs of 46 and 56 yards and touchdown among his 27 carries. Clemson, which had scored 115 points in its two previous games, turned it over four times. Tajh Boyd threw for 295 yards, and freshman Sammy Watkins had 10 catches for 159 yards and a touchdown. Clemson drove right down the field on its first possession before Georgia Tech stiffened at its own 16. Chandler Catanzaro came on to knock through a 34-yard field goal. But the tide swung toward the Yellow Jackets when D.J. Howard caught a pass out of the backfield, but lost the ball just before he hit the ground. The officials initially ruled him down, but changed the call after a video review. Rod Sweeting was credited with a recovery at the Clemson 19, and the Georgia Tech offense took it the rest of the way, Orwin Smith going in from the 1 on fourth down. After forcing a Clemson punt, Washington broke off the 46yard run -- the longest of his career, though that mark wouldn't last long -- and Georgia Tech stretched its lead to 10-3 on Justin Moore's 23-yard field goal. The Yellow Jackets went 80 yards in 10 plays to make it 173 on Smith's 3-yard TD run. Stephen Hill stretched out with both arms to make a diving catch, pulling the ball into his body with the left hand before slamming into the turf. He rolled over and did a little dance with his arms, celebrating the 44-yard completion. Two plays later, Washington ran it in from the 3 to push the lead to 24-3 with just 37 seconds left in the half. Coming out of halftime, the Tigers took the kickoff and needed only four plays to reach the end zone for the first time. Boyd hooked up with Watkins on a 48-yard touchdown pass to make it 24-10. But Georgia Tech quickly answered. With Georgia Tech facing third-and-6 and the Clemson defense waving their arms to rev up a sizable contingent of orange-clad fans, Washington spotted a hole up the middle and took off for the 56-yard gain. David Sims finished the drive with an 11-yard touchdown run, restoring Georgia Tech's 21-point lead. Score by Quarters Clemson Georgia Tech
CU GT GT GT GT CU GT CU
Qtr 1st 1st 2nd 2nd 2nd 3rd 3rd 4th
Time 08:45 02:59 12:01 05:44 00:37 13:34 11:30 14:47
1 3 7
2 0 17
3 7 7
Scoring Play Catanzaro 34 yd field goal Smith, O. 1 yd run Moore, Ju. 23 yd field goal Smith, O. 3 yd run Washington, T. 3 yd run
4 7 0
Score 17 31
Conversion Moore, Ju. kick
Moore, Ju. kick Moore, Ju. kick Watkins 48 yd pass from Boyd Catanzaro kick Sims, D. 11 yd run Moore, Ju. kick Thomas 0 yd fumble rec. Catanzaro kick
CU FIRST DOWNS . . . . . . . . . . . . . . . . . . . . . . . . . . .18 Rushing . . . . . . . . . . . . . . . . . . . . . . . . . . . . . . . .4 Passing . . . . . . . . . . . . . . . . . . . . . . . . . . . . . . . .14 Penalty . . . . . . . . . . . . . . . . . . . . . . . . . . . . . . . . .0 NET YARDS RUSHING . . . . . . . . . . . . . . . . . . . . . .95 Rushing Attempts . . . . . . . . . . . . . . . . . . . . . . . .24 Average Per Rush . . . . . . . . . . . . . . . . . . . . . . . .4.0 Rushing Touchdowns . . . . . . . . . . . . . . . . . . . . . . .1 Yards Gained Rushing . . . . . . . . . . . . . . . . . . . .115 Yards Lost Rushing . . . . . . . . . . . . . . . . . . . . . . .20 NET YARDS PASSING . . . . . . . . . . . . . . . . . . . . . .304 Completions-Attempts-Int . . . . . . . . . . . . . . .24-41-2 Average Per Attempt . . . . . . . . . . . . . . . . . . . . . .7.4 Average Per Completion . . . . . . . . . . . . . . . . . .12.7 Passing Touchdowns . . . . . . . . . . . . . . . . . . . . . . .1 TOTAL OFFENSE YARDS . . . . . . . . . . . . . . . . . . . .399 Total offense plays . . . . . . . . . . . . . . . . . . . . . . . .65 Average Gain Per Play . . . . . . . . . . . . . . . . . . . . .6.1 Fumbles: Number-Lost . . . . . . . . . . . . . . . . . . . . .3-2 Penalties: Number-Yards . . . . . . . . . . . . . . . . . . .5-30 PUNTS-YARDS . . . . . . . . . . . . . . . . . . . . . . . . .3-115 Average Yards Per Punt . . . . . . . . . . . . . . . . . . .38.3
2011 GEORGIA TECH FOOTBALL
GT . . . . . .22 . . . . . .20 . . . . . . .1 . . . . . . .1 . . . . .383 . . . . . .67 . . . . .5.7 . . . . . . .4 . . . . .394 . . . . . .11 . . . . . .60 . . . .4-9-1 . . . . .6.7 . . . . .15.0 . . . . . . .0 . . . . .443 . . . . . .76 . . . . .5.8 . . . . .1-1 . . . .4-23 . . . .3-132 . . . . .44.0
Net Yards Per Punt . . . . . . . . . . . . . . . . . . . . . .36.0 . . . . .44.0 Inside 20 . . . . . . . . . . . . . . . . . . . . . . . . . . . . . . .1 . . . . . . .1 50+ Yards . . . . . . . . . . . . . . . . . . . . . . . . . . . . . .1 . . . . . . .0 Touchbacks . . . . . . . . . . . . . . . . . . . . . . . . . . . . . .0 . . . . . . .0 Fair catch . . . . . . . . . . . . . . . . . . . . . . . . . . . . . . .2 . . . . . . .2 KICKOFFS-YARDS . . . . . . . . . . . . . . . . . . . . . . .4-263 . . . .6-361 Average Yards Per Kickoff . . . . . . . . . . . . . . . . .65.8 . . . . .60.2 Net Yards Per Kickoff . . . . . . . . . . . . . . . . . . . . .50.2 . . . . .39.5 Touchbacks . . . . . . . . . . . . . . . . . . . . . . . . . . . . . .0 . . . . . . .0 Punt returns: Number-Yards-TD . . . . . . . . . . . . .0-0-0 . . . .1-7-0 Average Per Return . . . . . . . . . . . . . . . . . . . . . . .0.0 . . . . . .7.0 Kickoff returns: Number-Yds-TD . . . . . . . . . . .6-124-0 . . .3-62-0 Average Per Return . . . . . . . . . . . . . . . . . . . . . .20.7 . . . . .20.7 Interceptions: Number-Yds-TD . . . . . . . . . . . . .1-26-0 . . . .2-2-0 Fumble Returns: Number-Yds-TD . . . . . . . . . . . .0-0-0 . . . .0-0-0 Miscellaneous Yards . . . . . . . . . . . . . . . . . . . . . . . . .0 . . . . . . .0 Possession Time . . . . . . . . . . . . . . . . . . . . . . . .21:00 . . . .39:00 1st Quarter . . . . . . . . . . . . . . . . . . . . . . . . . . . 8:17 . . . . 6:43 2nd Quarter . . . . . . . . . . . . . . . . . . . . . . . . . . 3:57 . . . .11:03 3rd Quarter . . . . . . . . . . . . . . . . . . . . . . . . . . . 6:49 . . . . 8:11 4th Quarter . . . . . . . . . . . . . . . . . . . . . . . . . . . 1:57 . . . .13:03 Third-Down Conversions . . . . . . . . . . . . . . . . .5 of 13 . . .7 of 14 Fourth-Down Conversions . . . . . . . . . . . . . . . . .0 of 0 . . . .1 of 2 Red-Zone Scores-Chances . . . . . . . . . . . . . . . . . . .2-3 . . . . .5-6 Touchdowns . . . . . . . . . . . . . . . . . . . . . . . . . . .1-3 . . . . .4-6 Field goals . . . . . . . . . . . . . . . . . . . . . . . . . . . . .1-3 . . . . .1-6 Sacks By: Number-Yards . . . . . . . . . . . . . . . . . . . .1-1 . . . .2-19 PAT Kicks . . . . . . . . . . . . . . . . . . . . . . . . . . . . . . .2-2 . . . . .4-4 Field Goals . . . . . . . . . . . . . . . . . . . . . . . . . . . . . .1-2 . . . . .1-1 TEAM STATISTICS Rushing CU -- Bellamy 8-67; Howard 7-22; Watkins 1-7; Boyd 8(-1); Thomas 0-0, 1TD GT -- Washington 27-176, 1TD; Sims 15-68, 1TD; Jones 4-52; Lyons 9-42; Smith 7-37, 2TD; Peeples 2-16; S. Hill 1(-2) Passing CU -- Boyd 23-40, 295, 1TD, 2INT; Watkins 1-1, 9 GT -- Washington 4-9, 60, 1INT Receiving CU -- Watkins 10-159, 1TD; Hopkins 6-66; Allen 4-32; Ja. Brown 226; Meeks 1-17; Howard 1-4 GT -- Hill 2-47; Melton 2-13
GAME #10 (20/19) Georgia (10/9) Virginia
Tech 26 Tech 37
November 10, 2011 | Atlanta, Ga. Bobby Dodd Stadium | 50,140 Virginia Tech's towering quarterback Logan Thomas proved to be extremely difficult to tackle as No. 10 Virginia Tech took a huge step toward the Atlantic Coast Conference championship game, beating Georgia Tech (No. 21 BCS, No. 20 AP) 37-26. The 6-foot-6, 254-pound sophomore accounted for five touchdowns, while David Wilson rushed for a career-best 175 yards as the No. 10 Hokies eliminated 20th-ranked Georgia Tech from the ACC race. Thomas threw three touchdown passes and ran for two more scores. Wilson had his seventh straight 100-yard game, already the longest streak of Beamer's quarter-century as coach. The teams went back and forth through the second and third quarters, scoring on eight of nine possessions in one stretch. But Virginia Tech (9-1, 5-1 ACC) took advantage with ten points in the fourth quarter. The Yellow Jackets (7-3, 4-3) were eliminated from the Coastal Division race. Georgia Tech quarterback Tevin Washington ran for three touchdowns, but the Hokies took the lead for good on Thomas' 12-yard run in the final minute of the third quarter. The play was typical for the big QB, who lowered his head and bulled his way to the end zone. The Yellow Jackets decided to go for it on fourth-and-1 at his own 31. Washington tried to get it on a keeper, but he was stopped about a foot short. From there, Virginia Tech moved in and converted their own fourth-and-1, but that was an easier to call with make with Thomas to carry it. He made his way for a 5-yard gain, then hooked up with Chris Drager for his first career touchdown, a 14-yard pass on third down that made it 34-26. Cody Journell sealed the victory, knocking through a 23-yard field goal with 3:02 remaining. After a wild final minute to the second quarter, in which the teams combined for three scores that left Virginia Tech with a 21-13 lead, the Yellow Jackets took the second-half kickoff and drove it right down the field. Washington broke off a 35-yard run and also benefited from a personal foul penalty on Jack Tyler, who whacked Embry
Peeples as he was running out of bounds, sending him flying toward the Yellow Jackets bench while yellow flags flew in from all directions. Washington finished it off with a 1-yard touchdown run, but he was stuffed on a 2-point conversion to leave Georgia Tech trailing 21-19. With the Hokies driving for another score, Wilson had the ball stripped away by Burnett and Isaiah Johnson recovered at the 16 for the Yellow Jackets. Back came Georgia Tech, reclaiming the lead with lightningquick 84-yard drive that took only seven plays. Peeples went down the sideline for a 39-yard run and Washington nearly took it in with a 29-yard gain, before finishing it off with his third TD of the night on a 1-yard dive. Score by Quarters Virginia Tech Georgia Tech
GT VT VT GT VT GT GT GT VT VT VT
Qtr 1st 2nd 2nd 2nd 2nd 2nd 3rd 3rd 3rd 4th 4th
Time 04:54 08:38 04:21 01:00 00:44 00:00 11:17 04:29 00:32 09:49 03:02
1 0 7
2 21 6
3 6 13
Scoring Play Washington, T. 2 yd run Thomas, L 1 yd run Boykin 9 pass from Thomas Moore, Ju. 41 yd field goal Coale 63 pass from Thomas Moore, Ju. 36 yd field goal Washington, T. 1 yd run Washington, T. 1 yd run Thomas, L 12 yd run Drager 14 pass from Thomas Journell, C 23 yd field goal
4 10 0
Score 37 26
Conversion Moore, Ju. kick Journell, C kick Journell, C kick Journell, C kick rush failed Moore, Ju. kick pass failed Journell, C kick
VT GT FIRST DOWNS . . . . . . . . . . . . . . . . . . . . . . . . . . .20 . . . . . .16 Rushing . . . . . . . . . . . . . . . . . . . . . . . . . . . . . . .13 . . . . . .10 Passing . . . . . . . . . . . . . . . . . . . . . . . . . . . . . . . .6 . . . . . . .3 Penalty . . . . . . . . . . . . . . . . . . . . . . . . . . . . . . . . .1 . . . . . . .3 NET YARDS RUSHING . . . . . . . . . . . . . . . . . . . . .267 . . . . .243 Rushing Attempts . . . . . . . . . . . . . . . . . . . . . . . .52 . . . . . .49 Average Per Rush . . . . . . . . . . . . . . . . . . . . . . . .5.1 . . . . .5.0 Rushing Touchdowns . . . . . . . . . . . . . . . . . . . . . . .2 . . . . . . .3 Yards Gained Rushing . . . . . . . . . . . . . . . . . . . .295 . . . . .281 Yards Lost Rushing . . . . . . . . . . . . . . . . . . . . . . .28 . . . . . .38 NET YARDS PASSING . . . . . . . . . . . . . . . . . . . . . .209 . . . . . .97 Completions-Attempts-Int . . . . . . . . . . . . . . . .7-13-0 . . .5-11-0 Average Per Attempt . . . . . . . . . . . . . . . . . . . . .16.1 . . . . .8.8 Average Per Completion . . . . . . . . . . . . . . . . . .29.9 . . . . .19.4 Passing Touchdowns . . . . . . . . . . . . . . . . . . . . . . .3 . . . . . . .0 TOTAL OFFENSE YARDS . . . . . . . . . . . . . . . . . . . .476 . . . . .340 Total offense plays . . . . . . . . . . . . . . . . . . . . . . . .65 . . . . . .60 Average Gain Per Play . . . . . . . . . . . . . . . . . . . . .7.3 . . . . .5.7 Fumbles: Number-Lost . . . . . . . . . . . . . . . . . . . . .3-1 . . . . .3-0 Penalties: Number-Yards . . . . . . . . . . . . . . . . . . .6-56 . . . .3-35 PUNTS-YARDS . . . . . . . . . . . . . . . . . . . . . . . . . .2-69 . . . .3-112 Average Yards Per Punt . . . . . . . . . . . . . . . . . . .34.5 . . . . .37.3 Net Yards Per Punt . . . . . . . . . . . . . . . . . . . . . .24.5 . . . . .37.3 Inside 20 . . . . . . . . . . . . . . . . . . . . . . . . . . . . . . .1 . . . . . . .0 50+ Yards . . . . . . . . . . . . . . . . . . . . . . . . . . . . . .0 . . . . . . .0 Touchbacks . . . . . . . . . . . . . . . . . . . . . . . . . . . . . .1 . . . . . . .0 Fair catch . . . . . . . . . . . . . . . . . . . . . . . . . . . . . . .0 . . . . . . .0 KICKOFFS-YARDS . . . . . . . . . . . . . . . . . . . . . . .7-482 . . . .5-314 Average Yards Per Kickoff . . . . . . . . . . . . . . . . .68.9 . . . . .62.8 Net Yards Per Kickoff . . . . . . . . . . . . . . . . . . . . .47.4 . . . . .44.8 Touchbacks . . . . . . . . . . . . . . . . . . . . . . . . . . . . . .4 . . . . . . .0 Punt returns: Number-Yards-TD . . . . . . . . . . . . .0-0-0 . . . .0-0-0 Average Per Return . . . . . . . . . . . . . . . . . . . . . . .0.0 . . . . .0.0 Kickoff returns: Number-Yds-TD . . . . . . . . . . . .5-90-0 . . .3-70-0 Average Per Return . . . . . . . . . . . . . . . . . . . . . .18.0 . . . . .23.3 Interceptions: Number-Yds-TD . . . . . . . . . . . . . .0-0-0 . . . .0-0-0 Fumble Returns: Number-Yds-TD . . . . . . . . . . . .0-0-0 . . . .0-0-0 Miscellaneous Yards . . . . . . . . . . . . . . . . . . . . . . . . .0 . . . . . . .0 Possession Time . . . . . . . . . . . . . . . . . . . . . . . .34:13 . . . .25:47 1st Quarter . . . . . . . . . . . . . . . . . . . . . . . . . . . 8:21 . . . . 6:39 2nd Quarter . . . . . . . . . . . . . . . . . . . . . . . . . . 8:00 . . . . 7:00 3rd Quarter . . . . . . . . . . . . . . . . . . . . . . . . . . . 7:50 . . . . 7:10 4th Quarter . . . . . . . . . . . . . . . . . . . . . . . . . .10:02 . . . . 4:58 Third-Down Conversions . . . . . . . . . . . . . . . .10 of 16 . . .5 of 13 Fourth-Down Conversions . . . . . . . . . . . . . . . . .2 of 2 . . . .0 of 2 Red-Zone Scores-Chances . . . . . . . . . . . . . . . . . . .5-7 . . . . .4-4 Touchdowns . . . . . . . . . . . . . . . . . . . . . . . . . . .4-7 . . . . .3-4 Field goals . . . . . . . . . . . . . . . . . . . . . . . . . . . . .1-7 . . . . .1-4 Sacks By: Number-Yards . . . . . . . . . . . . . . . . . . .5-36 . . . . .1-2 PAT Kicks . . . . . . . . . . . . . . . . . . . . . . . . . . . . . . .4-4 . . . . .2-2 Field Goals . . . . . . . . . . . . . . . . . . . . . . . . . . . . . .1-1 . . . . .2-2 TEAM STATISTICS Rushing VT -- Wilson 23-175; Thomas 18-70, 2TD; Oglesby 9-24 GT -- Peeples 3-84; Washington 24-77, 3TD; Sims 8-32; Lyons 7-26; O. Smith 4-17; Jones 3-7 Passing VT -- Thomas 7-13, 209, 3TD GT -- Washington 5-10, 97 Receiving VT -- Coale 2-97, TD; Coles 2-56; Boykin 2-42, TD; Drager 1-14, TD GT -- Melton 2-55; S. Hill 2-43; Peeples 1(-1)
RAMBLINWRECK.COM
GAME #11 (rv/23) Georgia
Tech
38 31
Duke November 19, 2011 | Durham, N.C. Wallace Wade Stadium | 18,747
David Sims rushed for two touchdowns, quarterback Tevin Washington added 136 yards rushing and a long, late scoring run, and Georgia Tech held on to beat Duke 38-31. Washington finished 6 of 13 for 185 yards passing and ran 39 yards for a late touchdown for the Yellow Jackets (8-3, 5-3 ACC). They rolled up 549 total yards, scored on four straight possessions and held off Duke's late charge. Sean Renfree matched a career high with four touchdown passes for the Blue Devils (3-8, 1-6). His 10-yard TD to Cooper Helfet -- his second of the day to the tight end--pulled Duke within seven points with 6:37 left. Duke forced a fumble from Charles Perkins and took over at its 34 with 3:44 left. Renfree's deep pass for Helfet was intercepted by Jemea Thomas with 2:20 left. Washington and Georgia Tech then ran out the clock to seal their eighth straight win in the series. Renfree finished 26 of 42 for 250 yards with touchdown passes covering 15 yards to Conner Vernon, 12 yards to Donovan Varner and 3 yards to Helfet for Duke, which lost its sixth straight. Washington showed once again just how capable he is of coming up with big plays both with his feet and his arm. He broke a pair of tackles during his long scoring run, which came 3 minutes after Duke had pulled within 31-24. Four of his completions covered at least 29 yards. Sims had scoring runs of 4 yards and 1 yard, while Roddy Jones and Embry Peeples had 1-yard touchdown runs for the Yellow Jackets, who entered having lost three of four-including an 11-point loss to Virginia Tech that took them out of the Coastal Division race. Georgia Tech looked to have taken control of this one by scoring on its final four possessions of the first half. None of those drives took longer than 5 1/2 minutes. Sims powered in from 4 yards out to tie it at 7. One series later, Washington hit Tyler Melton for 31 yards and raced 21 yards to set up Jones' short scoring run that put the Yellow Jackets ahead to stay. Washington's 46-yard pass to Embry Peeples then set up Sims' second TD run to make it 21-7 barely 3 minutes into the second quarter. After Duke pulled within a touchdown, Washington lofted a 56-yard pass to Stephen Hill that set up Peeples' TD on the final play of the half to make it 28-14. Score by Quarters Georgia Tech Duke
DU GT GT GT DU GT DU GT DU GT DU
Qtr 1st 1st 1st 2nd 2nd 2nd 3rd 3rd 4th 4th 4th
Time 12:48 06:36 03:22 11:55 05:24 00:00 09:38 01:56 12:29 09:31 06:37
1 14 7
2 14 7
3 3 3
4 7 14
Score 38 31
Scoring Play Conversion Vernon 15 yd pass Renfree Snyderwine kick Sims, D. 4 yd run Moore, Ju. kick Jones, R. 1 yd run Moore, Ju. kick Sims, D. 1 yd run Moore, Ju. kick Varner 12 yd pass Renfree Snyderwine kick Peeples, E. 1 yd run Moore, Ju. kick Snyderwine, W 35 yd field goal Moore, Ju. 25 yd field goal Helfet 3 yd pass Renfree Snyderwine kick Washington, T. 39 yd run Moore, Ju. kick Helfet 10 yd pass Renfree Snyderwine kick
GT FIRST DOWNS . . . . . . . . . . . . . . . . . . . . . . . . . . .22 Rushing . . . . . . . . . . . . . . . . . . . . . . . . . . . . . . .17 Passing . . . . . . . . . . . . . . . . . . . . . . . . . . . . . . . .5 Penalty . . . . . . . . . . . . . . . . . . . . . . . . . . . . . . . . .0 NET YARDS RUSHING . . . . . . . . . . . . . . . . . . . . .364 Rushing Attempts . . . . . . . . . . . . . . . . . . . . . . . .58 Average Per Rush . . . . . . . . . . . . . . . . . . . . . . . .6.3 Rushing Touchdowns . . . . . . . . . . . . . . . . . . . . . . .5 Yards Gained Rushing . . . . . . . . . . . . . . . . . . . .374 Yards Lost Rushing . . . . . . . . . . . . . . . . . . . . . . .10 NET YARDS PASSING . . . . . . . . . . . . . . . . . . . . . .185 Completions-Attempts-Int . . . . . . . . . . . . . . . .6-13-0 Average Per Attempt . . . . . . . . . . . . . . . . . . . . .14.2 Average Per Completion . . . . . . . . . . . . . . . . . .30.8 Passing Touchdowns . . . . . . . . . . . . . . . . . . . . . . .0 TOTAL OFFENSE YARDS . . . . . . . . . . . . . . . . . . . .549 Total offense plays . . . . . . . . . . . . . . . . . . . . . . . .71 Average Gain Per Play . . . . . . . . . . . . . . . . . . . . .7.7 Fumbles: Number-Lost . . . . . . . . . . . . . . . . . . . . .3-2 Penalties: Number-Yards . . . . . . . . . . . . . . . . . . .7-59 PUNTS-YARDS . . . . . . . . . . . . . . . . . . . . . . . . . .2-87 Average Yards Per Punt . . . . . . . . . . . . . . . . . . .43.5 Net Yards Per Punt . . . . . . . . . . . . . . . . . . . . . .40.5 Inside 20 . . . . . . . . . . . . . . . . . . . . . . . . . . . . . . .0
2011 GEORGIA TECH FOOTBALL
DU . . . . . .21 . . . . . . .5 . . . . . .14 . . . . . . .2 . . . . .101 . . . . . .24 . . . . .4.2 . . . . . . .0 . . . . .110 . . . . . . .9 . . . . .250 . .26-44-1 . . . . .5.7 . . . . .9.6 . . . . . . .4 . . . . .351 . . . . . .68 . . . . .5.2 . . . . .1-0 . . . .5-46 . . . .4-156 . . . . .39.0 . . . . .35.5 . . . . . . .2
50+ Yards . . . . . . . . . . . . . . . . . . . . . . . . . . . . . .0 Touchbacks . . . . . . . . . . . . . . . . . . . . . . . . . . . . . .0 Fair catch . . . . . . . . . . . . . . . . . . . . . . . . . . . . . . .0 KICKOFFS-YARDS . . . . . . . . . . . . . . . . . . . . . . .6-375 Average Yards Per Kickoff . . . . . . . . . . . . . . . . .62.5 Net Yards Per Kickoff . . . . . . . . . . . . . . . . . . . . .40.7 Touchbacks . . . . . . . . . . . . . . . . . . . . . . . . . . . . . .1 Punt returns: Number-Yards-TD . . . . . . . . . . . .1-14-0 Average Per Return . . . . . . . . . . . . . . . . . . . . . .14.0 Kickoff returns: Number-Yds-TD . . . . . . . . . . . .6-82-0 Average Per Return . . . . . . . . . . . . . . . . . . . . . .13.7 Interceptions: Number-Yds-TD . . . . . . . . . . . . . .1-7-0 Fumble Returns: Number-Yds-TD . . . . . . . . . . . .0-0-0 Miscellaneous Yards . . . . . . . . . . . . . . . . . . . . . . . . .0 Possession Time . . . . . . . . . . . . . . . . . . . . . . . .32:10 1st Quarter . . . . . . . . . . . . . . . . . . . . . . . . . . . 9:02 2nd Quarter . . . . . . . . . . . . . . . . . . . . . . . . . . 8:29 3rd Quarter . . . . . . . . . . . . . . . . . . . . . . . . . . . 6:28 4th Quarter . . . . . . . . . . . . . . . . . . . . . . . . . . . 8:11 Third-Down Conversions . . . . . . . . . . . . . . . . .6 of 10 Fourth-Down Conversions . . . . . . . . . . . . . . . . .1 of 1 Red-Zone Scores-Chances . . . . . . . . . . . . . . . . . . .5-5 Touchdowns . . . . . . . . . . . . . . . . . . . . . . . . . . .4-5 Field goals . . . . . . . . . . . . . . . . . . . . . . . . . . . . .1-5 Sacks By: Number-Yards . . . . . . . . . . . . . . . . . . . .0-0 PAT Kicks . . . . . . . . . . . . . . . . . . . . . . . . . . . . . . .5-5 Field Goals . . . . . . . . . . . . . . . . . . . . . . . . . . . . . .1-1
. . . . . . .0 . . . . . . .0 . . . . . . .2 . . . .6-358 . . . . .59.7 . . . . .46.0 . . . . . . .0 . . . .1-6-0 . . . . .6.0 . .5-111-0 . . . . .22.2 . . . .0-0-0 . . . .0-0-0 . . . . . . .0 . . . .27:50 . . . . 5:58 . . . . 6:31 . . . . 8:32 . . . . 6:49 . . .5 of 13 . . . .3 of 3 . . . . .5-5 . . . . .4-5 . . . . .1-5 . . . . .0-0 . . . . .4-4 . . . . .1-1
TEAM STATISTICS Rushing GT -- Washington 17-136, TD; Sims 13-66, 2TD; Peeples 7-64, TD; Perkins 12-45; Jones 4-37, TD; Zenon 3-20 DU -- Varner 2-42; Scott 10-27; Thompson 4-24; Renfree 3-7; Kurunwune 2-1; Vernon 2-1; Hollingsworth 1(-1) Passing GT -- Washington 6-13, 185 DU -- Renfree 26-42, 250, 4TD, INT; Boone 0-2 Receiving GT -- Melton 3-54; Hill 1-56; Peeples 1-46; Perkins 1-29 DU -- Vernon 9-92, TD; Helfet 6-45, 2TD; Varner 5-47, TD; Braxton 3-54; Scott 2-4; Deaver 1-8
GAME #12 (25/21) Georgia
Tech 17 (13/14) Georgia 31 November 26, 2011 | Atlanta, Ga. Bobby Dodd Stadium | 54,925 From the first snap, the biggest plays just didn't fall for Paul Johnson and Georgia Tech. Georgia Tech, best known for its option running game, tried to surprise Georgia with a trick play when receiver Tyler Melton took the ball on a reverse, stopped and threw deep for running back Embry Peeples. Melton's pass floated and fell incomplete. It was only the first missed opportunity for No. 25 Georgia Tech in Saturday's 31-17 loss to No. 13 Georgia. Johnson's Yellow Jackets couldn't stay close in losing the state bragging rights for the third straight year and the 10th time in the past 11 years. Another telling sequence came later in the first half when Johnson called a timeout just before Georgia's Blair Walsh was about to try a 41-yard field goal. Johnson called timeout only to see Walsh miss the attempt after a high snap. Thanks to Johnson's timeout, Walsh had another chance, and this time he made the kick to give the Bulldogs a 17-10 lead. Added Johnson: "Trust me, if I'd have known they would have a bad snap, I wouldn't have called timeout." Georgia's second chance for the field goal looked big when the game was still close in the second quarter. Johnson would have been second-guessed if the Bulldogs had won by only three points. Instead, Georgia led by three touchdowns in the fourth quarter. Johnson won his first game in the rivalry in 2008, but has lost three straight to Mark Richt's Bulldogs. Georgia (10-2) scored 17 straight points to lead 31-10 before Georgia Tech (8-4) scored its only points of the second half on Orwin Smith's 16-yard run with 6:32 remaining. Georgia Tech's other touchdown came on David Sims' 5-yard run in the second quarter. Aaron Murray threw four touchdown passes for Georgia, which will play top-ranked LSU in next week's Southeastern Conference championship game in the Georgia Dome. Murray said the Bulldogs were careful to put the SEC championship game aside until taking care of the state rivalry game. Johnson said a key was his defense's inability to reach Murray, who was sacked only once. Murray extended his school record for touchdown passes in a season to 32, hooking up with Michael Bennett and Chris Con-
ley in the first half, and Tavarres King and Aron White in the third quarter. Georgia Tech rushed for 243 yards, but just 79 after halftime. Freshman Synjyn Days replaced quarterback Tevin Washington in the fourth quarter and completed 3 of 5 passes for 78 yards, including a 36-yard pass to Stephen Hill to set up Smith's touchdown run. Georgia won without freshman star tailback Isaiah Crowell, who was in uniform but didn't play because of a left ankle injury. The Bulldogs improvised. Defensive backs Branden Smith and Brandon Boykin both lined up in the backfield, with Smith getting five carries. Alexander Ogletree broke off a key 21-yard gain on the first carry by a Georgia fullback this season. Receiver Malcolm Mitchell had a 20-yard run. Score by Quarters Georgia Georgia Tech
GA GT GA GT GA GA GA GT
Qtr 1st 2nd 2nd 2nd 2nd 3rd 3rd 4th
Time 02:23 12:16 08:20 01:13 00:03 13:24 02:57 06:32
1 7 0
2 10 10
3 14 0
Scoring Play Bennett 15 yd pass Murray Moore, Ju. 22 yd field goal Conley 14 yd pass Murray Sims, D. 5 yd run Blair Walsh 41 yd field goal King 3 yd pass Murray White 3 yd pass Murray Smith, O. 16 yd run
4 0 7
Score 31 17
Conversion Blair Walsh kick Blair Walsh kick Moore, Ju. kick Blair Walsh kick Blair Walsh kick Moore, Ju. kick
GA GT FIRST DOWNS . . . . . . . . . . . . . . . . . . . . . . . . . . .18 . . . . . .20 Rushing . . . . . . . . . . . . . . . . . . . . . . . . . . . . . . . .7 . . . . . .14 Passing . . . . . . . . . . . . . . . . . . . . . . . . . . . . . . . .10 . . . . . . .5 Penalty . . . . . . . . . . . . . . . . . . . . . . . . . . . . . . . . .1 . . . . . . .1 NET YARDS RUSHING . . . . . . . . . . . . . . . . . . . . .128 . . . . .243 Rushing Attempts . . . . . . . . . . . . . . . . . . . . . . . .28 . . . . . .53 Average Per Rush . . . . . . . . . . . . . . . . . . . . . . . .4.6 . . . . .4.6 Rushing Touchdowns . . . . . . . . . . . . . . . . . . . . . . .0 . . . . . . .2 Yards Gained Rushing . . . . . . . . . . . . . . . . . . . .145 . . . . .264 Yards Lost Rushing . . . . . . . . . . . . . . . . . . . . . . .17 . . . . . .21 NET YARDS PASSING . . . . . . . . . . . . . . . . . . . . . .252 . . . . .112 Completions-Attempts-Int . . . . . . . . . . . . . . .19-29-1 . . .6-17-2 Average Per Attempt . . . . . . . . . . . . . . . . . . . . . .8.7 . . . . .6.6 Average Per Completion . . . . . . . . . . . . . . . . . .13.3 . . . . .18.7 Passing Touchdowns . . . . . . . . . . . . . . . . . . . . . . .4 . . . . . . .0 TOTAL OFFENSE YARDS . . . . . . . . . . . . . . . . . . . .380 . . . . .355 Total offense plays . . . . . . . . . . . . . . . . . . . . . . . .57 . . . . . .70 Average Gain Per Play . . . . . . . . . . . . . . . . . . . . .6.7 . . . . .5.1 Fumbles: Number-Lost . . . . . . . . . . . . . . . . . . . . .1-0 . . . . .1-0 Penalties: Number-Yards . . . . . . . . . . . . . . . . . . .6-45 . . . .5-36 PUNTS-YARDS . . . . . . . . . . . . . . . . . . . . . . . . .3-130 . . . .3-131 Average Yards Per Punt . . . . . . . . . . . . . . . . . . .43.3 . . . . .43.7 Net Yards Per Punt . . . . . . . . . . . . . . . . . . . . . .36.7 . . . . .42.3 Inside 20 . . . . . . . . . . . . . . . . . . . . . . . . . . . . . . .2 . . . . . . .1 50+ Yards . . . . . . . . . . . . . . . . . . . . . . . . . . . . . .1 . . . . . . .1 Touchbacks . . . . . . . . . . . . . . . . . . . . . . . . . . . . . .1 . . . . . . .0 Fair catch . . . . . . . . . . . . . . . . . . . . . . . . . . . . . . .0 . . . . . . .0 KICKOFFS-YARDS . . . . . . . . . . . . . . . . . . . . . . .6-396 . . . .4-260 Average Yards Per Kickoff . . . . . . . . . . . . . . . . .66.0 . . . . .65.0 Net Yards Per Kickoff . . . . . . . . . . . . . . . . . . . . .47.8 . . . . .39.0 Touchbacks . . . . . . . . . . . . . . . . . . . . . . . . . . . . . .4 . . . . . . .1 Punt returns: Number-Yards-TD . . . . . . . . . . . . .2-4-0 . . . .0-0-0 Average Per Return . . . . . . . . . . . . . . . . . . . . . . .2.0 . . . . .0.0 Kickoff returns: Number-Yds-TD . . . . . . . . . . . .3-84-0 . . .1-29-0 Average Per Return . . . . . . . . . . . . . . . . . . . . . .28.0 . . . . .29.0 Interceptions: Number-Yds-TD . . . . . . . . . . . . . .2-0-0 . . . .1-0-0 Fumble Returns: Number-Yds-TD . . . . . . . . . . . .0-0-0 . . . .0-0-0 Miscellaneous Yards . . . . . . . . . . . . . . . . . . . . . . . . .0 . . . . . . .0 Possession Time . . . . . . . . . . . . . . . . . . . . . . . .29:21 . . . .30:39 1st Quarter . . . . . . . . . . . . . . . . . . . . . . . . . . . 7:18 . . . . 7:42 2nd Quarter . . . . . . . . . . . . . . . . . . . . . . . . . . 5:06 . . . . 9:54 3rd Quarter . . . . . . . . . . . . . . . . . . . . . . . . . . . 7:59 . . . . 7:01 4th Quarter . . . . . . . . . . . . . . . . . . . . . . . . . . . 8:58 . . . . 6:02 Third-Down Conversions . . . . . . . . . . . . . . . . .4 of 10 . . .7 of 16 Fourth-Down Conversions . . . . . . . . . . . . . . . . .0 of 0 . . . .1 of 2 Red-Zone Scores-Chances . . . . . . . . . . . . . . . . . . .4-4 . . . . .3-3 Touchdowns . . . . . . . . . . . . . . . . . . . . . . . . . . .4-4 . . . . .2-3 Field goals . . . . . . . . . . . . . . . . . . . . . . . . . . . . .0-4 . . . . .1-3 Sacks By: Number-Yards . . . . . . . . . . . . . . . . . . .2-11 . . . .1-13 PAT Kicks . . . . . . . . . . . . . . . . . . . . . . . . . . . . . . .4-4 . . . . .2-2 Field Goals . . . . . . . . . . . . . . . . . . . . . . . . . . . . . .1-2 . . . . .1-1 TEAM STATISTICS Rushing GA -- Nakcine 12-39; Murray 4-22; Ogletree 1-21; Smith 5-20; Mitchell 1-20; Thomas 5-6 GT -- Jones 11-72; O. Smith 7-46, TD; Washington 13-41; Sims 1236, TD; Peeples 2-28; Days 6-17; Lyons 1-4 Passing GA -- Murray 19-29, 252, 4TD, INT GT -- Washington 3-10, 34, 2 INT; Days 3-5, 78 Receiving GA -- Charles 5-95; King 3-26, TD; Mitchell 2-33; Conley 2-29, TD; Bennett 2-20, TD; Smith 2-13; Boykin 1-28; Thomas 1-5; White 13, TD GT -- S. Hill 3-78; O. Smith 1-20; Sims 1-8; Jones 1-6
RAMBLINWRECK.COM