What made you fall in love with the British countryside? Whether it was the call of a curlew or a day spent with a loved one that sparked your love for the countryside, your gift will ensure that future generations can experience the same joy and wonder.
REVIEW OF 2022 Game & Wildlife Conservation Trust
A full report of the activities of the Game & Wildlife Conservation Trust (Registered Charity No. 1112023) during the year Issue 54
Printed on Elemental Chlorine Free (ECF) fibre sourced from well managed forests.
GAME & WILDLIFE CONSERVATION TRUST CHARITABLE OBJECTS
To promote for the public benefit the conservation of game and its associated flora and fauna.
To conduct research into game and wildlife management (including the use of game animals as a natural resource) and the effects of farming and other land management practices on the environment, and to publish the useful results of such research.
To advance the education of the public and those managing the countryside in the effects of farming and management of land which is sympathetic to game and other wildlife.
To conserve game and wildlife for the public benefit including: where it is for the protection of the environment, the conservation or promotion of biological diversity through the provision, conservation, restoration or enhancement of a natural habitat; or the maintenance or recovery of a species in its natural habitat on land or in water and in particular where the natural habitat is situated in the vicinity of a landfill site.
Council
as of 1 January 2023
Patron HM King Charles III
Chairman of the Trustees The Rt Hon Sir Jim Paice DL FRAgS
Vice-Chairmen of the Trustees The Marquess of Downshire, John Shields
Elected Trustees
Bertie Hoskyns-Abrahall, The Earl of Carnarvon, Claire Zambuni, Jeremy Young, Anthony Daniell, Bernard Taylor CBE DL FRSC, Jules Gibbs, Preben Prebensen, The Rt. Hon. Robert Goodwill Appointed Trustees
Ex-Officio Trustees
Advisory Members
Peter Misselbrook, Owen Williams, James Corbett
Stephen Morant, Jeremy Finnis DL, The Marquess of Downshire, David Mayhew CBE, Peter Misselbrook, John Shields, Stephen Catlin
Simon West, George Davis, Prince Albrecht Fürst zu Oettingen-Spielberg, David Pooler, Alex Hogg
President and Vice-Presidents
President The Most Hon the Marquess of Salisbury KG KCVO PC DL Vice-Presidents
Henry Hoare, Baron van Tuyll van Serooskerken, Sir Rudolph Agnew FIMgt, John Marchington FRICS , Colin Stroyan, James Bowdidge ARICS, Andrew Christie-Miller FRAgS, The Earl Peel GCVO DL, Sir Mark Hudson KCVO FRAgS, Ian Haddon, Robert Miller, Richard Wills, The Duke of Northumberland DL, Bruce Sargent, The Duke of Norfolk DL, David Flux, Ian Yates, Jonathan Kennedy BSc FRICS, The Rt Hon The Earl of Dalhousie DL, Ian Coghill, The Hon Philip Astor, Hugh Oliver-Bellasis FRAgS, Dr Anthony Hamilton, Ron Beck, Richard Chilton, The Rt Hon Sir Nicholas Soames, James Keith, The Duke of Westminster
Chairmen of GWCT county committees
Bedfordshire Edward Phillips
Berkshire no chair
Bristol & Tom Hyde
North Somerset
Buckinghamshire Andrew Knott
Cambridgeshire Sam Topham
Cheshire Richard Goodwin
Cornwall Gary Champion
Cumbria William Johnson
Derbyshire & Mark Parramore
South Yorkshire
Devon Stewart Priddle (Ed Nicholson)
Dorset no chair
Essex Mark Latchford
Gloucestershire Mark Ashbridge
Hampshire George Browne (Colin Elwell)
Herefordshire Luke Freeman
Hertfordshire Neil Macleod
Isle of Wight no chair
Kent Will Oakes
Lancashire Nicholas Mason
Leicestershire & Thomas Cooper
Rutland
Lincolnshire George Tinsley
London no chair
Norfolk Carlo Fountaine (Charlie MacNicol)
Northamptonshire Antony Sykes
Northumberland no chair
& County Durham (Willie Browne-Swinburne)
Nottinghamshire Chris Butterfield
Oxfordshire Chris Robinson
Shropshire Charlotte Marrison
Somerset Christopher Norfolk
Staffordshire Brendan Kiely
Suffolk Tom Verrill
Surrey no chair
Sussex Jamie Evans-Freke
Warwickshire & Edward Beale
West Midlands (Rod Bird)
Wiltshire Colin Elwell (Sid Vincent)
Worcestershire Mark Steele
East Yorkshire no chair
Names in brackets were chairmen that stepped down during 2022
North Yorkshire Harry Scrope
West Yorkshire no chair
Scotland
Edinburgh & SE Malcolm Leslie
Scotland
Fife & Kinross Kathryn Bontoft
Grampian Andrew Wright
Highland James MacphersonFletcher
East Tayside Michael Clarke
West Tayside Guy Spurway
West of Scotland David MacRobert
Scottish Auction Tim Wishart
Wales
Wales Chairman Owen Williams
Ceredigion Dr Susan Loxdale
North-East Wales Richard Thomas
North-West
Wales No chair
Powys Tom Till
South-East Wales Roger Thomas
South-West Wales Amanda Harris-Lea
CONTENTS Review of 2022
WELCOME
2 GWCT council and county chairmen
4 Bringing natural capital into landscape management
5 Spreading the word
6 Tackling policy challenges
8 Using GWCT science
9 Under scrutiny
10 Natural Capital Advisory
12 Raising our game
14 World-class conservation research
15 Thank you once again
WETLAND RESEARCH
16 Breeding woodcock in the UK
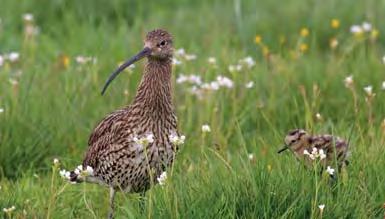
18 Understanding curlew
PARTRIDGE AND BIOMETRICS
RESEARCH
20 Partridge Count Scheme
22 PARTRIDGE – socio-economic aspects
26 PARTRIDGE – monitoring breeding songbirds
30 NGC: trends in woodcock, woodpigeon & corvids
UPLANDS RESEARCH
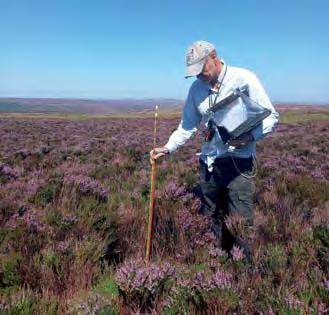
34 How heather cutting affects blanket bog habitat
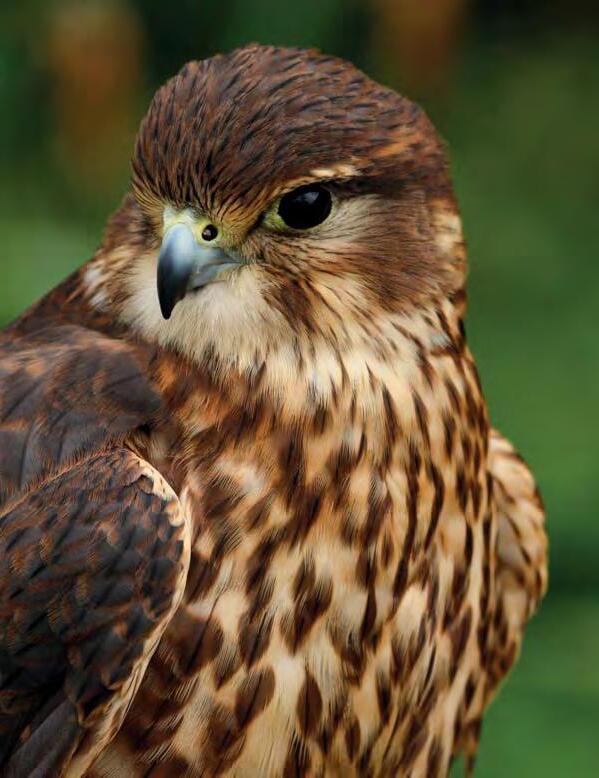
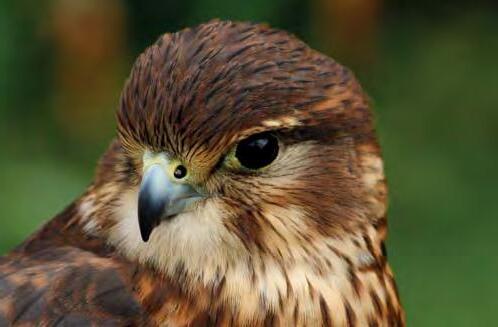
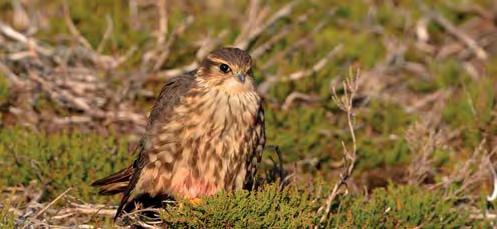
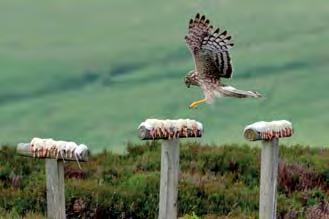
36 Understanding merlin breeding requirements
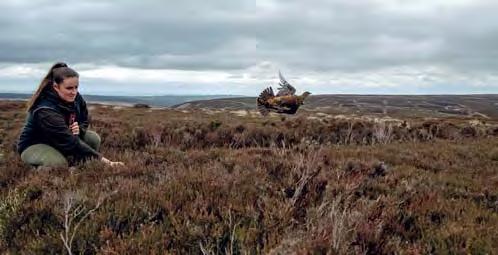
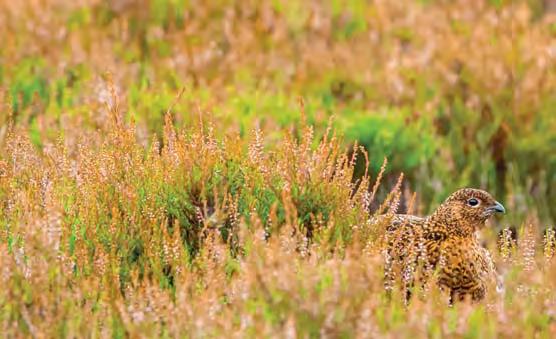
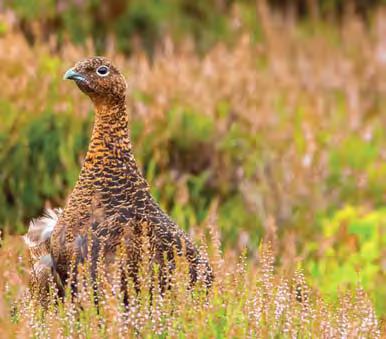
38 Exploring the maternal condition of red grouse
40 Red grouse density on Langholm Moor
FARMLAND RESEARCH
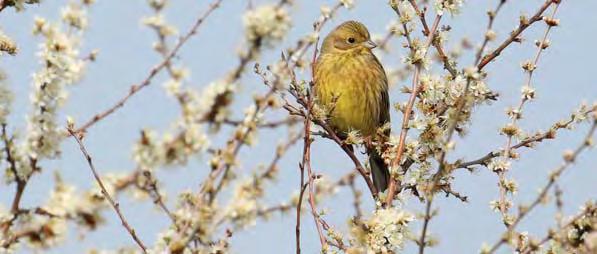
44 Concentrating resources to help yellowhammers
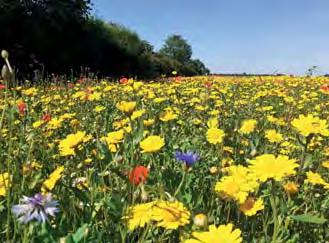
46 Wild plants and insect pollination
RESEARCH AND DEMONSTRATION FARMS
48 Allerton Project: game and songbirds
50 Allerton Project: the farming year
54 Allerton Project: carbon cycling in long-term direct-drill plots
56 Allerton Project: Conservation Agriculture
58 Auchnerran: biodiversity monitoring
60 Auchnerran: the farming year
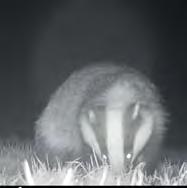
62 Auchnerran: badger predation on wader nests
PREDATION RESEARCH
64 Fox genetics
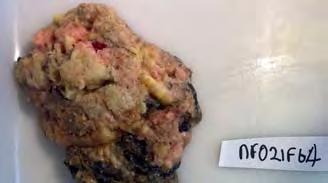
66 Anthropogenic food in fox diets in the New Forest
FISHERIES RESEARCH
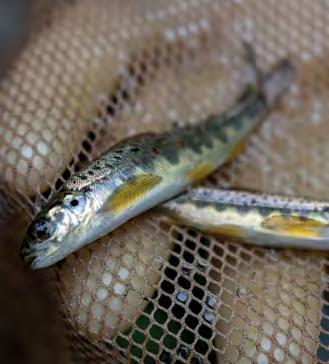
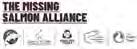
68 River Frome Atlantic salmon population
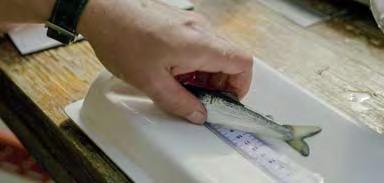
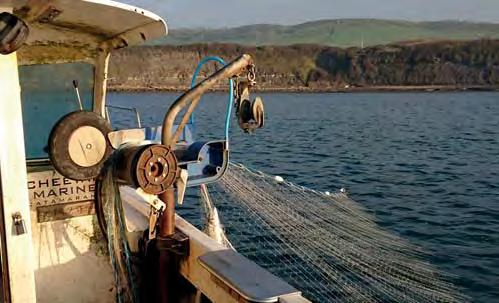
70 Smolt mortality
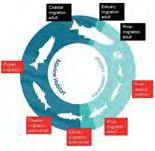
72 SAMARCH – shaping policy recommendations
74 The aims of the Missing Salmon Alliance
LOWLAND GAME RESEARCH
76 Gamebird releasing and foxes
WALES
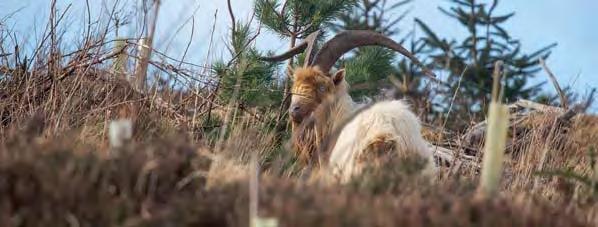
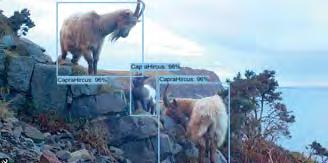
80 Feral goat numbers at Nant Gwrtheyrn
GWCT ROUNDUP
82 GWCT research projects 2022
86 GWCT scientific publications 2022
88 GWCT financial report 2022
92 GWCT staff 2022
94 External committees with GWCT representation
Bringing natural capital into landscape management Welcome
Establishing a farmer-led co-operative
The Environmental Farmers Group aims are to achieve ambitious environmental outcomes while ensuring that farmers are fairly rewarded for their efforts.
Teresa Dent CBE, Chief Executive
Launch of new Natural Capital subsidiary and Environmental Farmers Group.
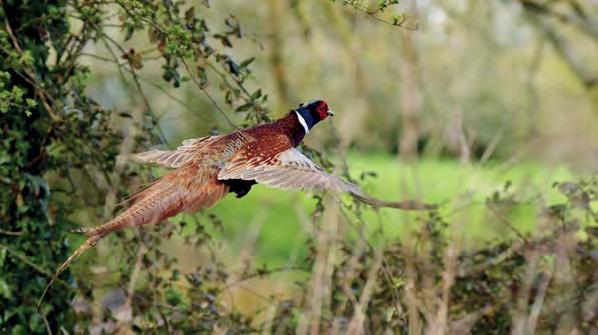
Key research into pheasant releasing impacts.
Thank you to all our staff, trustees, donors and members for their continuing support in 2022.
In 2022, the GWCT underwent significant changes expanding its work into the natural capital arena by launching a new trading subsidiar y called Natural Capital Advisory. This new entity was established alongside the existing trading subsidiary Game & Wildlife Advisory, which all members are likely to be familiar with.
The GWCT’s natural capital work has included the initiation of the Environmental Farmers Group in the Hampshire Avon catchment. The group brought together farmers from seven existing Farmer Clusters in the catchment to establish a farmer-led and farmer-owned co-operative. Its twin aims are to achieve ambitious environmental outcomes while ensuring that farmers are fairly rewarded for their efforts.
The environmental outcomes the farmers have committed to achieving include restoring biodiversity, achieving species recovery in the catchment, having cleaner water in the River Avon and aiming to achieve net carbon zero farming by 2040. The co-operative currently has 102 full members, with a further 60 farmers expressing interest in joining. It covers 43,000 hectares and is expanding quickly, providing significant scope to deliver the environmental targets set.
The GWCT initiated the co-operative to maintain the conservation work that had been started by the existing Farmer Clusters in the face of the loss of an estimated £37 million per annum when the Basic Payment Scheme (BPS) ceases at the end of 2027. The co-operative is designed to deliver significantly improved environmental outcomes across large parts of the British countryside and to find blended financial rewards for farmers.
In 2022, the Westminster Government set out its now legally binding environmental targets. The GWCT supports the Government’s ambition to reverse declines in species abundance by 2030. However, it will need to harness the environmental delivery of the farmers and land managers, the Working Conservationists, who look after 72% of land that is in private stewardship in the UK. The RSPB says that only 8% of the UK is ‘managed for nature’, and while nature reserves are wonderful, they cannot deliver at the scale needed to achieve the Government’s targets.
Thanks to generous funding from BASC, we started a long-awaited piece of work focusing on whether gamebird releasing supports locally high populations of generalist predators (see page 76). This has been a topic of constant debate, with many conservation organisations believing, on little or no evidence, that released gamebirds subsidise
populations of generalist predators, which in turn damage the breeding success of birds of conservation concern. We hope to publish results of this work in next year’s annual Review
The Allerton Project (see page 48) marked its 30th anniversary, celebrating its many achievements with events throughout the year. The Project was featured on BBC Countryfile in February, with presenters Ellie Harrison and Matt Baker getting to grips with a wide range of the research and educational activities happening on the farm. Later in the year the Project hosted a visit from the Sustainable Agriculture Initiative Platform, a network of more than 160 major global food companies, recognising the significance of the Allerton Project as a pioneering farm in regenerative and sustainable agriculture.
The shooting community faced multiple challenges, having first navigated through Covid-19 and then facing Avian Influenza. The GWCT advisory team has provided support and advice to many shoots throughout the year.
In 2022, the GWCT published its first ecosystem report, which examined the ecosystem services delivered by grouse moors. This management scored well when compared with other upland land uses, including rewilding, forestry and farming.
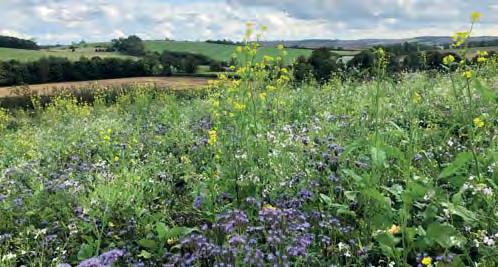
The GWCT was delighted to launch the Welsh Game Fair in September. The event took place the day after Her Majesty Queen Elizabeth II died, and the gun salute delivered in her memory made the national press. Given her lifelong love of the countryside, we hope that the Queen would have felt that this was a fitting tribute to an event that embodied so much of what brought enjoyment to her life.
Finally we would like to extend a huge thank you to our incredibly hard-working staff and to our members and supporters, who make our important work possible.
Spreading the word
Championing the importance of GWCT research
It seems that the old saying ‘out of the frying pan into the fire’ remains true. No sooner have we overcome Covid-19 than we are beset by bird flu. To see the pictures of hundreds of dead seabirds and wildfowl is horrible. The risk to other wildlife including songbirds is unclear, but it is having an impact on many aspects of rural life including cancelled or reduced shooting. However, it illustrates that the other activities of the GWCT are vitally important. This includes the development of Natural Capital Advisory and the tremendous success of our team led by Teresa Dent in convening large groups of farmers and landowners (see page 10).
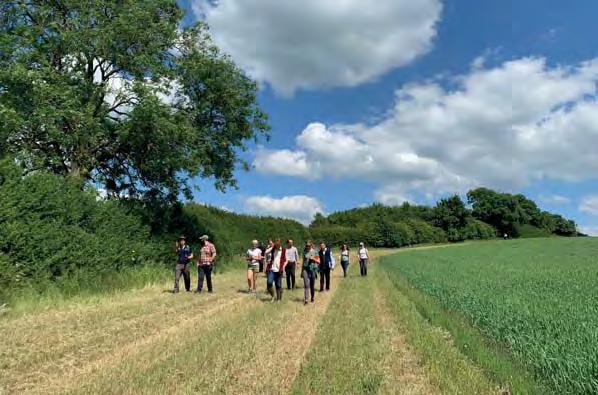
Last year I wrote about the importance of all the other activities within the GWCT but this year I want to emphasise their importance in terms of expanding our membership. Most of our members today are involved in shooting but we should also attract anyone with an interest in the countryside and wildlife, as well as farmers themselves, because of the amazing work being done at our farms at the Allerton Project and at Auchnerran in Scotland. I would like to see our county branches reach out to other local organisations for example to share farm walks or a visit to Allerton. I am constantly being told how little we are known outside shooting. Obviously, there is a role for central GWCT in promoting ourselves, but similarly, it should be possible for every member to tell someone whom they know about us. A neighbouring farmer, perhaps, or a local dog walker who constantly talks about the birds they see. Our science is second to none in the world of wildlife and farming, and we should be keen to talk about it.
As always, the Review portrays the range of our activities. All our staff are vital to it, and they need our gratitude. So too do our supporters, whether they be large landowners or beaters on a local shoot. As chairman, I am proud of what we do and I like to tell others. I hope you will too.
Sir Jim Paice GWCT Chairman
Tackling policy challenges
Evidence-led approaches to potential legislation
Our advisory, research and policy work continues to feed into legislative proposals for upland and agricultural land use.
Scottish Government consultations on grouse moor licensing, agriculture, land reform, biodiversity and hunting with dogs set policy challenges for the GWCT throughout the year.
Completion of carbon audits, land management plans and natural capital assessments at GWSDF Auchnerran established important platforms for policy and research work.
The grouse moor licensing debate culminated late in 2022 with the publication of the Wildlife Management (Grouse) Bill consultation. We continued to support the landowner task force directly engaged with Scottish Government on legal aspects. Separately, we held specific meetings with the administration on best practice and mobile app-based information recording for evidence-led approaches to potential legislation.
We welcomed the Minister for Environment and Land Reform to our policy engagement lunch at the Scottish Game Fair, along with senior representatives from NatureScot, the Cairngorms National Park, National Farmers’ Union Scotland and the Scottish Agricultural Organisation Society Ltd. Discussion focused on upland management, farmer collaboration and the balance between food production and biodiversity stewardship.
Predator control was subject to considerable scrutiny during the year, initially via the Hunting with Dogs Bill, aiming to restrict management, except under licence, to the use of two dogs to flush foxes to guns. Snaring also came under the microscope. GWCT submitted Bill responses, drafted reports and attended Scottish Parliament rural affairs committee evidence, and cross-party sessions. We pointed to our body of predation research, the risks of further biodiversity loss and the need to retain different control tools for conservation and economic good.
Work on funding and supporting the development of a new vaccine against tickborne Louping-Ill disease progressed with the Moredun Research Institute. However, its work to find a commercialisation partner remains challenging.
During 2022, carbon and natural capital assessments facilitated significant engagement with NatureScot through knowledge exchange events at our Scottish Demonstration farm, the PARTRIDGE project site in Fife and with the West Loch Ness Farmer Cluster. GWCT now sits on NatureScot’s ‘Farming with Nature’ External Advisory Group and is involved with its landscape-scale natural capital project. These allow us to feed into Scottish agricultural and land use policy development.
We continue to work with Scottish sporting and land management organisations via the Rural Environment and Land Management (RELM) group.
ENGLAND
Post-Brexit environment policy taking shape. New Land-Use Strategy for England under discussion. ‘Bottom-up’ initiatives vital to encourage maximum engagement.
Environmental policy has largely been under EU jurisdiction until now. In 2022, the Government advanced a number of new domestic policies, which it has actively been consulting upon. These include nature recovery, environmental targets and biodiversity net gain, all part of the Government’s move towards considering natural capital in a broader policy context; and more specific policies on lead shot and deer management.
We responded to the Trade and Agriculture Commission’s inquiry on the Australian Trade Agreement, expressing our concerns about food produced at lower welfare and environmental standards than permitted in the UK. We highlighted concerns about the negative impacts of trade deals on marginal livestock producing areas which are often of high landscape and biodiversity value due in part to current extensive management. If imports undermine the viability of these farms any resulting repurposing of the land will have wider effects on rural communities, for example loss of livestock markets, and cause a reduction in conservation effort through there being fewer farmers managing the land.
We also responded to select committee inquiries on food security, onshore solar, sustainable timber production and progress of the Environmental Land Management Scheme (ELMS), giving oral evidence at one of the sessions in this inquiry. Less publicly we have been engaging with Defra to help ensure ELMS has the options included in it to enable farmers and landowners to be central to the delivery of the Government’s 2030 environmental targets. This is key as 72% of our landscape is farmed. However, one of the most interesting Select Committee inquiries of the year was a special House of Lords Committee set up to consider the need for a Land Use Strategy in England. This lies at the heart of what we have been saying in other inquiries that have only considered land use in isolation. We emphasised that multi-functional land management is possible with trade-offs and the acceptance that overall outputs are optimised rather than individual ones maximised, and that a key component is management. This need not be ‘intensive’ but we were keen to point out that an excessive trend towards extensification in our opinion risks the delivery of desired outcomes. What is needed is a land-use framework that supports bottom-up initiatives, vital to encourage maximum engagement, rather than any top-down strategy. We therefore await the Government’s land use strategy due in 2023 with interest.
Alastair Leake, Director of Policy and Parliamentary Affairs
GWCT presents evidence in the face of mounting political pressure.
Welsh Farming Community launched.
First GWCT Welsh Game Fair received with great enthusiasm.
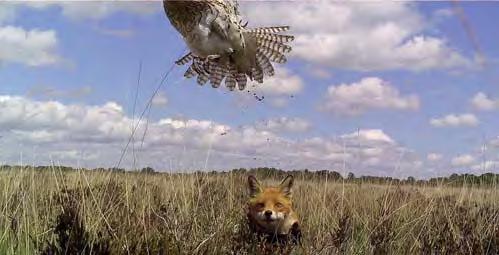
Political and policy issues continue to mount. The proposed ban on snares, which includes Humane Cable Restraints (HCR), was announced on 26 September in the Agriculture Bill. We presented written evidence to the Economy Trade and Rural Affairs Committee for Stage 1 scrutiny of the general principles of the Agriculture (Wales) Bill, particularly concerned about the loss of HCRs for their use in the conservation of species such as curlew. These highly-engineered and GWCT-designed devices are for holding the fox only and were used in our LIFE Waders for Real project to catch foxes for GPS tagging, to explore their movements in wet grassland habitats used by breeding waders.
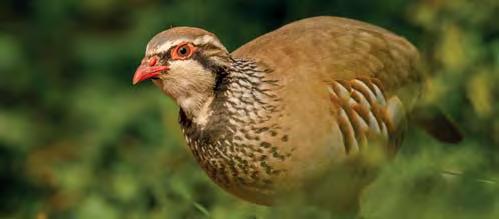
We responded to a call for evidence to inform the development of Natural Resources Wales’ (NRW) approach to regulating the release of gamebirds (common pheasant and red-legged partridge) in Wales. Unlike in England, where the Government considered regulation over protected sites, in Wales it is looking at the potential need for regulation across the whole country. NRW has indicated that any new approach will be confirmed in 2023, with a view to it coming into force for releases during the 2024/5 shooting season.
The details for the Future Sustainable Farming Scheme were released in time for the Royal Welsh Show where we launched our Welsh Farming Community. This provides the opportunity for farmers to show their support for the GWCT approach to conservation, and benefit from engagement with other like-minded farmers.
Following a petition mounted last year to stop the shooting of red- and amberlisted birds we saw the start of the Pen Llyn woodcock project which will collect vital data on these species in Wales.
Avian Flu across the whole country has been a significant worry this year and we fed into the Welsh Wild Birds Avian Influenza Strategic Response Group in October.
On a brighter note we held the first-ever GWCT Welsh Game Fair at Y Faenol near Bangor, North Wales, in September, the day after the sad passing of Her Majesty Queen Elizabeth II. More than 10,000 people attended, 68% of whom had never been to a Game Fair before. Many lessons have been learnt from this inaugural event which will be put into action for this year’s two-day event on 9-10 September welshgamefair.org.
Game management is under scrutiny and some of the tools employed by game managers have been restricted.
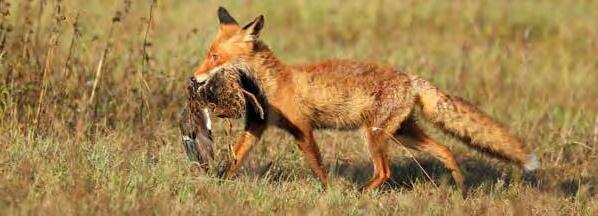
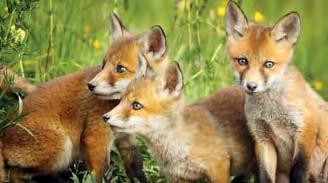
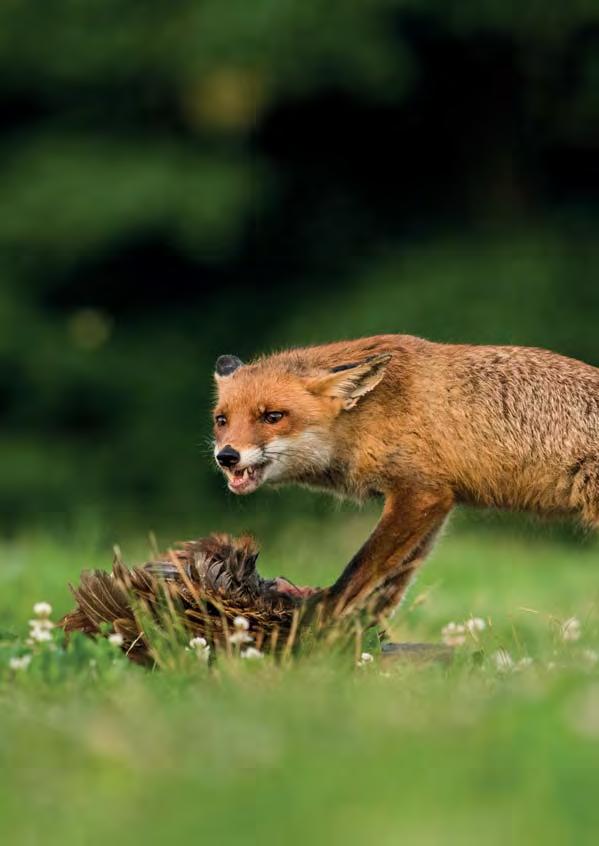
Understanding the effects of gamebird releasing and predator control by shoots on fox numbers is important.
Quantifying the physical and biological responses to heather burning and cutting on moorland is essential to ensuring the best outcomes for upland landscapes.
The Review highlights the work of our research teams, from conducting fundamental science on species’ ecology through to addressing specific environmental and wildlife management issues. There is now much speculation in conservation circles about the role of gamebird releases in supporting generalist predators in the UK, but no direct evidence. Given the sustained increase in the numbers of pheasants and red-legged partridges released until 2020, it is essential that we better understand how releasing influences the distribution and abundance of predators such as foxes and how legal predator control on shoots might mitigate any effect. This issue is explored in more detail in the article on pages 76-79 and I am pleased to report good progress with a new, large-scale study collecting data on the seasonal abundance of gamebirds and key predators at 18 sites in southern England in 2022. This work will continue in 2023 and, with a PhD study examining fox population dynamics that commenced in autumn 2021, will start to yield answers in 2024.
In the uplands, the burning of heather on blanket peat is a contentious issue and ongoing science is starting to reveal the complexity of responses to this form of habitat management. Our long-term cut and burn experiment across five sites (see Review of 2021, pages 38-39) revealed further variation in treatment responses between sites in 2022 and started to suggest different timescales in vegetation recovery between treatments. As a result of the restrictions on heather burning on blanket bog by Natural England in 2021, we have seen a large increase in the extent of heather cutting. In this year’s Review we report on a new study to quantify the effects of cutting on the vegetation, particularly the all-important blanket bog mosses (see pages 34-35). The work is at an early stage, but it looks likely that there is scope for further refinement of the technique to ensure optimal environmental outcomes.
We need to understand how gamebird releasing influences the distribution and abundance of predators such as foxes.
2022 was a successful first year for Natural Capital Advisory (NCA).
Roger Draycott, Director of Advisory & Education
The advisory team has 10 advisors that can undertake audits using the Defra Biodiversity Metric.
NCA has helped set up and service two farmer environmental co-operatives.
Our new subsidiary Natural Capital Advisory (NCA) had a successful first year in 2022. The business sits alongside the long-established Game & Wildlife Advisory Ltd, which provides NCA’s biodiversity auditing and monitoring services. NCA has already become a key point of contact in the natural capital sector thanks to the GWCT’s help setting up the Environmental Farmers Group (EFG) in the Hampshire Avon catchment and the Peakland Environmental Farmers (PEF) in the Peak District, as well as its work with industry and Government institutions, such as the Green Finance Institute.
These new co-operatives are an evolution of the Farmer Cluster model invented by the GWCT and the principle that by working together on a landscape scale, neighbouring farms can achieve the environmental outcomes we all want to see. Given farmers manage 72% of the UK landmass they will be critical to delivering the Government’s national environmental targets.
Funding for new catchment-scale conservation projects run by EFG and PEF will be a blend of public and private funding brokered by NCA. Until now individual farmers
have struggled to take advantage of green finance as they were operating on too small a scale to navigate complex emerging natural capital markets and attract investment. In NCA, investors now have a single point of contact representing a large group of landowners, and collectively farmers have the power to negotiate fair financial reward for the ecosystem services they provide. Furthermore, thanks to the NCA’s land management expertise and access to specialist equipment, they offer value-for-money environmental gain with public and private investment supporting local rural communities rather than going to outside agencies.
NCA is currently providing environmental biodiversity baselining services to farms and estates. These on-the-ground audits provide farms and estates with a detailed understanding of the current value of biodiversity and potential opportunities for improving their natural assets. They are essential for land managers to be able to access environmental trades and offset markets. The GWCT’s advisory team have 10 advisors who are competent in the use of the Defra metric, which is the statutory measure by which biodiversity units are calculated.
The fact that NCA can draw on the work of both the GWCT’s research department and our Allerton Project demonstration farm at Loddington, guarantees investors high quality cutting-edge environmental services. A good example is the establishment of the new Hedgerow Carbon Code, which is based on a metric developed by the Allerton Project in association with Defra. NCA is well placed to establish other national registries to underpin natural capital trading and is working with a range of partners looking at how best to measure carbon capture, soil and water quality improvement and increased biodiversity.
The GWCT’s experienced and respected team of advisors offer bespoke Biodiversity Assessments providing an independent expert report on best practice and biodiversity gain on individual farms and estates. For more information please see naturalcapitaladvisory.co.uk or contact the advisory team on 01425 651013.
Raising our game
Henrietta Appleton explains why the raising of the game, not just the gun, is vital for species conservation
The subtleties of the GWCT’s role in promoting and documenting best practice in game management and shooting are often misunderstood. Our work focuses on how game management can be optimised to improve the conservation quality of the shoot, through, for example, woodland planting and management that supports native flora and fauna, rather than just the ‘raising of the gun’ itself. It is often in the overlap between game management and wildlife conservation that the threats to shooting are most evident, and 2022 has seen various challenges in this field. The devolution of agricultural and environmental policy has added to these pressures, as the debates are now occurring on four different fronts with often different emphases within each country. There are several threats to shooting that we are addressing at the moment, not least possible restrictions on releasing (an area where we continue to do research as highlighted in the spring 2023 Gamewise). But in this overview, I would like to focus on some of the threats to wild gamebird shooting.
Let’s take fox control, for example. The imminent ban in Wales and the recommendation to ban snaring in Scotland by the Scottish Animal Welfare Commission (SAWC) has resulted in calls for England to follow suit. But it seems to us that the decision made by the Welsh Government was not grounded in science nor based on the need for humane cable restraints to remain a tool to support conservation objectives. In addition, the science to which SAWC referred in its call for a ban based on welfare concerns cited evidence from before 2010. Since then additional safety features have been
built into snare design, alongside specific requirements under the Wildlife and Natural Environment (Scotland) Act, which is generating welfare improvements via training and accreditation.
GWCT has invested considerable time and research into achieving an ‘Agreement on International Humane Trapping Standards’ (AIHTS) approved humane cable restraint, which is now the hardware recommended in the Defra-endorsed Code of Practice. The addition of a breakaway clip, two swivels (mid-way and anchor), and a stop at 26 centimetres from the running eye to the existing free-running snare significantly improves its humaneness and selectivity. It is vitally important that legislators understand the difference between older generation free-running snares, which failed AIHTS humaneness testing during the Defra snares study, and the modern designs of free-running live-capture snares with selectivity advantages. These devices are more widely known by the international wildlife management community as humane cable restraints.
While GWCT research has demonstrated the importance of fox control using humane cable restraints in wildlife conservation (grey partridge, brown hare, and curlew in particular come to mind), it has also shown how training to improve humane cable restraint operator practice is the most important determinant of welfare outcomes. For example, the ‘old’ practice of setting snares on fence lines is proven to increase the chances of entanglement and suspension resulting in injury, possibly fatal. In line with the Code of Practice, the GWCT Fox Control course emphasises the importance of setting humane cable restraints on runs used by foxes but which are devoid of risks of entanglement such as trees, heavy
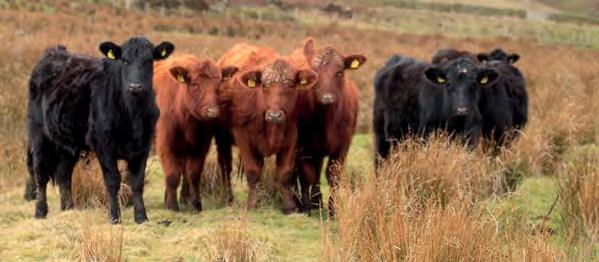
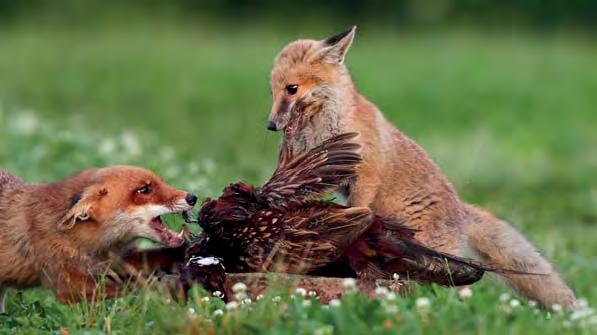
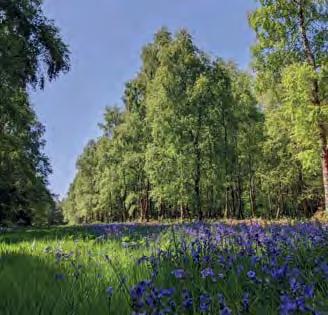
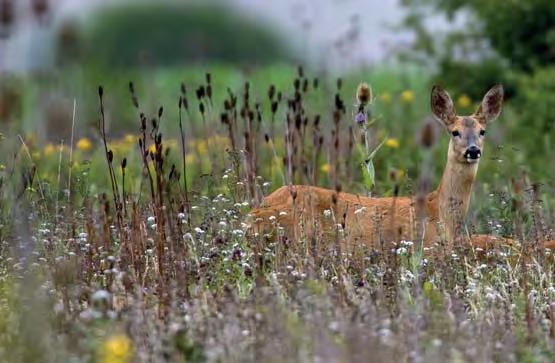
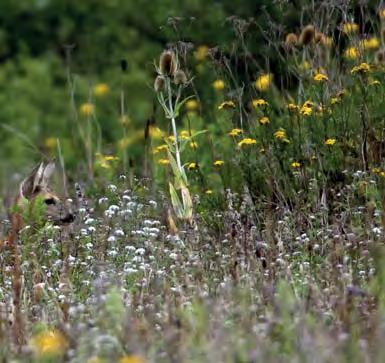
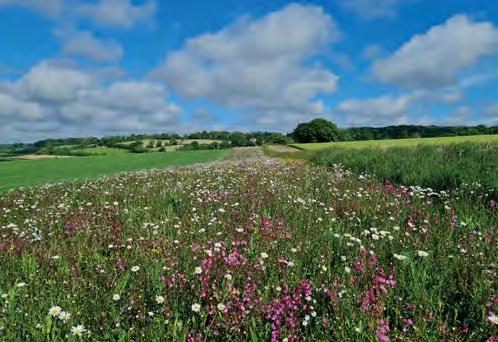
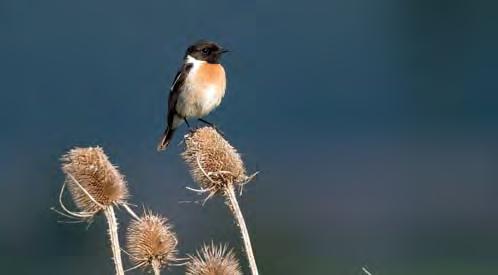
(Above) Game management encourages the provision of suitable habitat, benefiting a wide range of species.
Henrietta Appleton, our policy officer (England), believes our role in promoting best practice game management is vital, but often misunderstood.
The influence of game management on species is usually focused on the shooting of the game and not the investment by the shooting community in the management of the habitat
brash, or fencing, or where there is evidence of use by vulnerable non-targets. If you combine advances in hardware with appropriate training, then the selectivity and humaneness of this practice increases further. It seems time, therefore, to persuade stakeholders, the devolved administrations, and Defra that only humane cable restraints (not older generation free running snares) should be used in fox control, and these should only be available to a user who has been certified as receiving recognised training.
The influence of game management on species is usually focused on the shooting of the game and not the investment by the shooting community in the management of the habitat. This is exemplified by the recent debate over a change to the shooting season for woodcock, following calls for a total ban in 2021. The raison d'etre for both was that the numbers of Britishbreeding woodcock are in decline, and shooting them should be stopped or limited. The decline in the number of our resident breeding woodcock is likely driven by habitat change as woodland becomes increasingly fragmented and less well-managed. While woodland cover in Britain has increased since the 1940s, the type of woodland has changed, with a reduction in the area of the young, multi-species woodland favoured by woodcock during the breeding season. We believe that
In Brief
WOODCOCK SURVEY
THE NATIONAL GWCT/BTO BREEDING Woodcock Survey, taking place in 2023, is part of a decennial assessment of population size. But if you have an interest in woodcock, we recommend surveying your local breeding population using the same roding count method on a more regular basis. If you want to start annual monitoring of your breeding woodcock population, please get in touch by emailing woodcock@gwct.org.uk to learn more.
the most effective way of supporting resident woodcock populations is to ensure that woodland management practices are providing enough suitable nesting and brood-rearing habitat.
In response to GWCT best practice advice to reduce the impact of shooting on resident woodcock, shooting pressure has reduced. Enforcing a shooting ban rather than continuing with the current approach of voluntary restraint risks removing the justification for the provision of suitable habitat, including managing woodland, thereby potentially impacting woodcock conservation efforts. A classic case of ‘conservation through wise use’.
I will end with an emerging topic, and that is wildfire. 2022 saw the greatest number of wildfires yet in England and Wales, including some at the rural-urban interface, which resulted in properties lost and people evacuated. Thankfully no human lives were lost, but this is not the experience in other closely-aligned European countries such as Portugal. What is the relevance to shooting, I hear you ask? The threats to grouse moor management will affect the management of vegetation and the availability of ‘fuel for the fire’ in important upland ecosystems. As we continue to experience changes in our climate (such as drier summers), the mantra ‘managing the fire by managing the fuel’ will become increasingly relevant.
Policy engagement with Scottish Government dominated 2022. Research capacity was substantially enhanced during the year.
Developments in Scotland in 2022 were shaped by the debate around climate change and biodiversity loss, with land use and reform issues at the heart of considerable Scottish Government policy consultation. We strived hard to advance evidence-led and practical perspectives from Working Conservationists for representation to Scottish Government. During the year, the Scottish team refined our ‘Best Practice with Proof’ initiative for land managers. We have been very encouraged by the uptake of mobile app recording, particularly among upland estates committed to demonstrating their environmental credentials. Alongside compliance aspects, data recorded by farms and estates is collated by our Advisory team and used to produce detailed reports to aid planning and management.
A key focus for GWCT Scotland has been to increase research output. This was substantially advanced in 2022 by the appointment of Dr Louise de Raad, who joined us as head of research and director of the Scottish Demonstration Farm at Auchnerran to develop it as a leading research and practice facility.
Alongside our research, advisory and policy capacity, communication of our work is essential. The GWCT Scottish Game Fair remains vital and at last year’s event, we launched ‘Listen to the Land’, a book fair and discussion forum, which saw 29 speakers present in three themed tents over the course of the Fair. This provided educational opportunities for all age groups, covering topics such as regenerative farming, rewilding, woodcock and barn owl research. During 2022, we also increased social media output and embarked on exciting filmmaking opportunities.
Producing world-class conservation research in Scotland is central to our objectives, blending this with coherent policy and pragmatic advisory services. Communicating this work to members, practitioners, policymakers and the wider public is crucial. We look forward to developing these aims in 2023.
Thank you once again
We are extremely grateful for your continuing support
ENGLAND
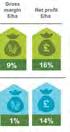
Major donor income at £1.64 million.
£254,000 from GCUSA (subject to exchange rate).
County committees projected at £775,000.
London events at £220,000.
The county committees, GCUSA and the wider fundraising department have had another solid year despite auction lots being much harder to secure. We owe a particular debt of gratitude to those auction lot donors who did give despite myriad uncertainties. More than £1 million of the above is from volunteers – we are extremely grateful for this continuing support.
The major donor total is another best-ever year thanks in large part to the amazing generosity of our President’s Club members. The New York auction was once again light on really attractive lots, but our US trustees have again shown real generosity under the leadership of Ron Beck and Robyn Hatch.
County committees for the most part returned to something like business as usual, but the above total was buoyed by an amazing contribution from events held at Warter Priory.
The forty-second annual Ball at the British Museum was a great success, due in no small part to the work of the Ball committee, once again led by our chairman, His Grace The Duke of Roxburghe. We also celebrated the return of the ever-popular Le Gavroche Sporting auction and were able to hold a number of smaller events as well.
On behalf of all at the GWCT, sincere thanks to all of you who contributed to the above numbers in 2022.
‘Roding counts’ are now an established method used to monitor resident woodcock in Britain during May to June. Male woodcock do not defend exclusive territories, but instead compete for the attention of females by performing wandering roding flights over large areas of woodland and intervening habitat (more than 100 hectares (ha) may be covered in a single evening). A human observer, watching these displays from a suitable count point, can record the number of times a woodcock is seen or heard in a defined survey period, and from this we can calculate how many males are present (see Review of 2003, available online, for more details of this method).
Background
In 2003, the GWCT, in conjunction with the British Trust for Ornithology (BTO), conducted the first national survey of Britain’s resident woodcock, estimating the British breeding population at 78,346 males. In 2013, a repeat survey estimated the population to be 55,241 males – a decline of 29%. These represent the most accurate estimates of woodcock population size available, but practical constraints mean a survey of this scale can only be conducted at 10-year intervals. To put these large-scale estimates into context, and monitor annual fluctuations in population size, the GWCT and BTO run a programme of smallerscale, volunteer-led surveys across a subsample of sites.
This simple survey format has underpinned two national surveys conducted in 2003 and 2013. Each of the national surveys covers a sample of around 800 randomlyselected sites. The scale of the national surveys means that they can only take place once every 10 years, but some volunteer surveyors have continued to survey their sites on a more regular basis. This provides data that allow us to understand annual population trends outside of the 2003 and 2013 survey years. Since 2014, an average of 156 sites have been surveyed each spring.
Any site surveyed in more than one year can contribute to our assessment of annual variation, but these become more accurate the more times the site is visited. Surveyors make dusk visits to their chosen site three times during May-June, and count woodcock registrations for 75 minutes. From their maximum count, we estimate trend using a generalised linear model (GLM) which allows us to produce an index of woodcock abundance for each survey year, while accounting for variation between sites and the changing makeup of the sample. This index provides a measure of woodcock activity or abundance relative to a particular year (eg. 2003 = 1 or 2013 = 1) and associated confidence intervals.
The annual count data support wider evidence of declines, but also demonstrate that the rate of decline does not appear to be constant over time. From 2013 to 2019 there had been a largely stable trend, with the exception of an unusually high count in 2016 (see Figure 1). But there have been further declines between 2019 and 2020. At first, we had suspected this to be an artefact of the atypical 2020 survey season, when many counts were understandably disrupted by the coronavirus pandemic, but the indices for 2021 and 2022 remain low. Generally, we expect counts of displaying adults to be influenced by productivity during the previous breeding seasons and overwinter survival, so the sudden decline observed in 2020 is very unlikely to be driven by changes to human behaviour in response to Covid-19 or associated travel restrictions.
There are some limitations to this method. Although these squares are mostly derived from the random sample associated with the original national survey, about 18% of the squares included are self-selected survey sites where no random site was available close to a prospective surveyor. Volunteers are also more likely to continue to survey on a yearly basis if woodcock are frequently seen and, consequently, the sample is biased towards sites that have had higher counts. As such, the annual counts give a year-by-year snapshot of how trend varies among a relatively consistent sample of sites, but does not provide the same statistical power as the very large, stratified, random sample available from the all-important national surveys. The GWCT/BTO Breeding Woodcock Survey was repeated in spring 2023.
Figure 1
Annual change in the number of woodcock registrations between 2013 and 2022. The number of registrations is given as an index where the level observed in 2013 = 1. Error bars show 95% confidence intervals
Roding surveys are conducted from woodland clearings, and can be moved slightly if the location’s suitability changes over time.
Key findings
Annually, an average of 156 sites have been monitored using roding counts since the last national GWCT/BTO Breeding Woodcock Survey in 2013. Although these initially showed a stabilisation of woodcock numbers, there has been only a small recovery from the marked drop in numbers between 2019 and 2020. On average, woodcock counts are currently approximately 20% lower than those recorded in the 2003 national survey. These annual counts set the 10-year national surveys in context, but the limited and less random sample means that the national surveys remain important.
Acknowledgements
We would like to thank all the volunteers who have taken part in the GWCT/BTO Breeding Woodcock Survey, especially those who undertake annual counts. We thank our collaborators at the British Trust for Ornithology, especially Greg Conway and David Norfolk, for helping maintain and manage the surveys.
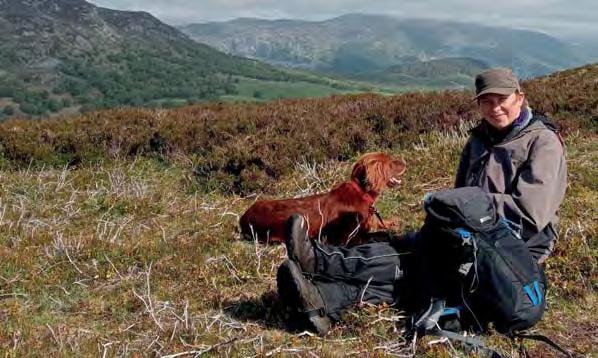
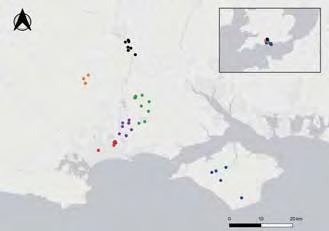
Eurasian curlew are declining in the UK, but the severity of their decline may be partially masked by the species’ long lifespan and tendency to return to breeding sites regardless of low productivity at these sites in previous years. Our aim was to determine links between curlew breeding sites in northern England and wintering sites. We used GPS-GSM tags to track migratory movements of curlew, focusing on migration routes, stop-over locations, and habitat selection in the non-breeding period. Protecting both curlew wintering sites and migratory stop-over sites is important to maintain adult survival while measures are developed to address poor breeding success.
Although the curlew’s decline is likely to be driven by poor breeding success, understanding year-round habitat use and the migratory ecology of British-breeding curlew will shed light on factors that may interact with breeding success, such as overwinter survival or pre-breeding body condition. Identifying habitats utilised as breeding, wintering and stop-over sites can inform where conservation measures should be focused. To improve our understanding of behaviour and habitat use at different sites, we tracked the movements of 14 curlew, caught in northern England, during their migration from breeding to wintering grounds.
In May-June 2022, we nest-trapped breeding curlew, shortly before clutches hatched, and fitted each with a 10.5 gramme Ornitela OT-E10 GPS-GSM tag (conducted under BTO licence). Ten curlew (six male, four female) were tagged in South Tynedale and West Allendale in Northumberland, over four neighbouring estates. We tagged a further four curlew (two male, two female) on the Abbeystead Estate, Lancashire. The tag batteries were recharged by a raised solar panel. Periodic two-way communication via the mobile phone network enabled the download of stored data and provided an opportunity to update the tags’ recording schedules.
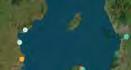
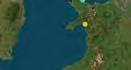
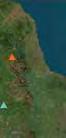
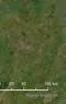
All tagged curlew had left their breeding sites by 21 July. As expected, female curlew left earlier than males as they take a smaller role in chick-rearing, on average leaving nine days earlier than males (see Figure 1). All Northumbrian curlew moved westward at the end of the breeding season, despite their breeding sites being equally close to England’s east coast (see Figure 2). This may reflect milder conditions on the west coast during winter due to the warming effect of the Gulf Stream. Half of the Northumbrian curlew settled in Northern Ireland or Ireland, with the remainder in north Wales (Anglesey and Glaslyn Estuary) or south-west Scotland (Solway Firth). The Lancastrian curlew also moved westward, with one settling in Morecambe Bay, one on Anglesey, and two in County Louth, Ireland.
Journey times averaged 39 hours but ranged from 1.5 hours (Abbeystead to the Lancashire coast) to nearly six days (Northumbria to County Wexford, Ireland), with three Northumbrian birds known to make stopovers of up to 17 hours in the Solway Firth before moving on. Three of the seven Irish-wintering curlew travelled via the Isle of Man. The two curlew travelling to Ireland’s west coast made direct overland flights across Ireland, rather than following the coast. These were the two furthest-travelled curlew, making migrations of 534 kilometres (km) (County Clare) and 459km (County Galway). Given the relatively short total journey times and distances, the timing of stopovers was likely driven by environmental factors eg. feeding opportunities or weather, rather than physiological drivers.
Cumulative frequency of departure dates showing the points at which male and female curlew left their breeding sites
Acknowledgements
We are grateful to the estates that provided access, assistance and financial support, and to the Northern Pennines Moorland Group. We thank Rob Foster, Pete Potts, Dave Scott and associated nest-finders working across the tagging sites.
During winter, tagged curlew appear to be highly site-faithful, limiting their movements to relatively small home ranges. Home-range sizes were calculated using fixed-radius localised convex hulls (radius = 2km) for the eight curlew which transmitted regularly during October, November and December. This method estimated 95% home ranges that averaged 902 hectares (ha) (526-1,311ha) during OctoberDecember, despite extended cold spells in December 2022. All of the curlew utilised coastal regions in winter, and all but two foraged in estuaries during the winter, such as the Solway Firth and Carlingford Lough.
In winter, when solar recharge was less effective, we adjusted the data transmission of the GPS tags from every 15 minutes to every two hours to economise battery life. Most GPS tags held a steady charge, but the battery life of four of our tags declined slowly, reaching 0% in September. This was likely due to feather shading and reduced sunlight intensity. Identifying GPS tag battery limitations offers the opportunity for development of more efficient tag recording schedules in the future. In time, as we add to the dataset, we will have the opportunity to compare breeding and post-breeding movements and habitat use of curlew successfully breeding in the English uplands with those faring less well in parts of southern England, such as the New Forest (see Review of 2021, page 66-67).
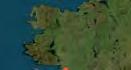
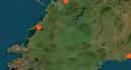
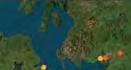
Figure 2
The wintering locations (December 2022) of 14 GPS-tagged curlew tagged in South Tynedale and West Allendale, Northumbria (orange triangle) and the Forest of Bowland, Lancashire (blue triangle). Marker colours correspond to tagging locations and sex (males = darker, females = lighter)
We nest-trapped breeding curlew, shortly before clutches hatched, and fitted each with a tag.
Determining links between curlew breeding sites and wintering sites will help us understand more about their decline
Key findings
Curlew moved west at the end of the breeding season, with seven of the 14 curlew tagged in northern England settling in Northern Ireland or Ireland. Total journey times averaged 39 hours but ranged from 1.5 hours to nearly six days and varied from 16km to 534km.
Of the seven curlew that settled in Ireland, three stopped over on the Isle of Man.
The majority of curlew made direct and relatively continuous migrations to estuaries and rapidly settled into consistent feeding and roosting routines. These migratory behaviours are likely driven by prior experience, but site fidelity will only become clear in successive years of tracking.
Chris Heward
Anna Thompson
Andrew Hoodless
Partridge & Biometrics
Join the PCS
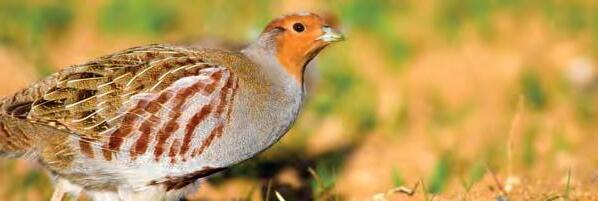
Wild grey partridges benefit from landowners and managers being able to better identify and address their needs. Join the Partridge Count Scheme to help secure the future of our native partridge. Find out more at gwct.org.uk/pcs
National average spring pair density on PCS sites remained stable at 4.4 pairs per 100ha. Summer productivity, measured as Young-to-Old ratio, rose to 2.7 young birds per adult. Nationally, the average autumn density increased 15%.
Neville Kingdon Julie Ewald
In 2022, the Partridge Count Scheme (PCS) received 502 counts in spring (see Table 1), 24 fewer counts than in 2021. The spring count recorded a total of 6,195 pairs of grey partridges across 158,700 hectares (ha), down 882 pairs (-13%) across all regions, compared with spring 2021. Average spring pair density nationally remained stable at 4.4 pairs per 100ha. Regionally, only southern England and Scotland saw a pair density increase, but northern and eastern England continued to record the highest regional pair densities of 6.3 and 5.5 pairs per 100ha, respectively.
Winter 2021/22 was milder than average, and in January and February we experienced the effects of five storms in quick succession. New Year’s Day 2022 was the warmest on record, and every subsequent month was warmer than historic averages. Calculating grey partridge over-winter survival (OWS) requires PCS sites to return both an autumn count and a subsequent spring count. National OWS remained stable at 55%, but this figure masks regional OWS declines in southern England, the Midlands and Scotland. However, eastern and northern regions of England saw improved average OWS, achieving 67% and 52% respectively.
The long-term index of grey partridge density since 1960 (see Figure 1) illustrates the changes of ‘long-term’ sites (participating prior to 1999) and ‘new’ sites (joined since 1999). In spring 2022 long-term sites recorded an average index in national spring pair density of 5.3 pairs per 100ha, an average 3% decrease from the density in spring 2021. The trend of much of the past decade shows that the long-term sites, despite their historic focus on game and habitat management and certain sites doing particularly well, have yet to improve spring densities sufficiently across enough sites to recover at a large scale from the exceptionally wet summer in 2012. New sites also recorded a 2% decrease, holding at an average index of 3.7 pairs per 100ha.
1
Trends in the grey partridge spring pair density, controlling for variation in different count areas
Acknowledgements
We are extremely grateful to GCUSA for its ongoing support of our grey partridge work.
TABLE 1
Grey partridge counts
Densities of grey partridge pairs in spring and autumn 2021 and 2022, from contributors to our Partridge Count Scheme
The number of sites includes all that returned information, including zero bird counts. The young-to-old ratio is calculated where at least one adult grey partridge was counted. Autumn density was calculated from sites that reported the area counted. No counts were made in Northern Ireland. *Small sample size.
Summer 2022 was dominated by an extended period of extremely high temperatures that brought three heatwaves: three days in June, three days in July and six days in August. As a result, the UK recorded its highest ever temperature of 40.3°C in Coningsby, England, while Wales broke its previous record with 37.1°C in Hawarden, Flintshire, as did Scotland when it hit 34.8°C at Charterhall, Berwickshire.
The PCS received 432 autumn counts in 2022, only 2% fewer than in autumn 2021 (see Table 1). The total number (old and young) of grey partridges recorded nationally was 21,390. The total area counted covered 132,420ha, 6% less than the 143,000ha counted in autumn 2021, and the average area counted by PCS sites was 312ha (down from 331ha in 2021). Average national autumn grey partridge densities increased 15% from an average of 19 birds per 100ha in 2021 to 22 birds per 100ha in 2022.
By differentiating between the old and young in coveys, PCS participants recorded an increase in productivity. The average Young-to-Old ratio (Y:O – a straightforward measure of summer productivity) across all sites rose 17% to 2.7 young for every adult, up from 2.3 in 2021. Encouragingly, all regions were well above the minimum 1.6 Y:O necessary for a stable population, with the Midlands, northern England and Scotland regions achieving a Y:O of 3.0 or greater. However, at a county level, higher productivity was obvious in northern England (north of the Wirral-Humber line) and Scotland, with lower productivity seen in more counties in the southern half of the UK. This divide may be related to the length and intensity of temperatures that were encountered in the northern half of the country. Here temperatures may have peaked at a level that remained tolerable for better productivity, unlike temperatures in more southerly counties, where extremes faced by grey partridges, broods, or their chickfood insects meant that partridges were less able to endure the hot, dry conditions for that length of time.
This north-south divide is also reflected in the autumn bird density where, despite the national density increasing 15% to 22 birds per 100ha, it was in Scotland and northern England that autumn density increased. The southern and Midland regions of England recorded decreases in density, while the autumn density in the eastern region remained stable. Given ongoing climate change, hotter, drier summers are expected to become increasingly common in the UK. Indeed, of the UK’s top 20 warmest years since records began in 1884, 15 have all occurred in this century. Although the summer of 2022 had an overall positive outcome nationally for grey productivity, it looks to have become polarised north-south. As 2022 was the 10th year in a row that global temperature was at least 1°C above average, it is the reality that the negative effects on wildlife will increasingly outweigh any temporary benefits. Despite these challenges, habitats and management remains crucial for partridge recovery.
Background
Partridge counts offer valuable insight into how well your partridges breed, survive and benefit from your habitat and management provision throughout the year. Each count (spring and autumn) is easy to carry out and helps assess the previous six months without the need for continual monitoring. How to count:
Spring: Ensure winter coveys have broken up and breeding pairs have formed – typically in February and March. Record all pairs and any single birds.
Autumn: Wait until most of the har vest has finished – ideally between mid-August and mid-September. Record adult males, adult females and young birds in each covey separately. Don’t assume a covey is two adults and some young. Use a high 4WD to cover more area in less time. Drive each field perimeter and then criss-cross using tramlines to minimise crop damage. Binoculars help when examining each pair or covey.
gwct.org.uk/pcs
PARTRIDGE - socio-economic aspects
Background
The PARTRIDGE project is an Interreg North Sea Region project, running from 2016 to 2023, with 12 European partners in six participating countries (Belgium-Flanders, Denmark, England, the Netherlands, Germany- Lower Saxony, and Scotland). The GWCT is the lead partner of PARTRIDGE. The project seeks to provide practical solutions for the countries within the North Sea Region to help them achieve their 2030 Biodiversity Targets on arable farmland. A key element of this is the need to improve the existing national Agri-Environment (AE) schemes and widen their uptake by farmers.
How to improve the take up and implementation of Agri-Environment (AE) schemes? This question occupies the minds of many of us seeking to improve the conservation of farmland wildlife. As part of the PARTRIDGE project we have undertaken face-toface interviews and surveyed farmers and stakeholders online across the North Sea Region (Belgium, Denmark, England, Germany, the Netherlands and Scotland) to help answer this question. This has revealed some similar experiences and suggestions for improvements of AE schemes across the area – resulting in broad recommendations to help increase the number of farmers involved and improve the way schemes are implemented. It has also highlighted differences between countries. We highlight both here.
Our initial interviews with farmers (both those who had AE schemes and those who did not – eight in each country) and other stakeholders (including policymakers, farming representatives, researchers – seven in each country) took place in autumn/ winter of 2018 into 2019. Across all countries farmers indicated a desire for targeted advice that was free to them and for the results of AE schemes (more flora and fauna) to be monitored. A need for greater flexibility was mentioned by interviewees across all countries. Increased flexibility was seen in a desire for the simplification of the process of applying to join a scheme and in inspections, as well as in management of AE options (timing of planting, weather-related issues, seed mixtures, length of agreements). Support for farmers to work together, such as through Farmer Clusters in England or in collectives, as in the Netherlands, was found across all five countries.
Two big issues for farmers in the UK at that time, but not in other countries, were concerns about receiving payments (reflecting the problems the Rural Payments Agency was dealing with at the time of the interviews) and a real feeling of anxiety about the effects of Brexit – which was on the horizon but with little detail on how it was going to affect farmers at the time of the interviews.
All our respondents were motivated by an interest in wanting to help nature and the environment.
In spring 2021 we followed up our interviews with an online survey. The survey questions were designed to explore more fully what our interviewees told us in 2018/2019 and compare how farmers with an AE scheme differed to those without one, across five countries (total of 886 respondents, excluding Denmark as it did not, at the time, have an AE scheme). We had 199 respondents from England and 62 from Scotland. The goal was to find practical ways for those designing AE schemes to improve scheme uptake and effectiveness. We considered aspects of what we found in our interviews: advice and who should pay for it, details of options directed towards arable farmland that are offered through AE schemes (most popular, how to improve, other options of interest) and payment levels.
Our respondents (both those in and not yet in schemes) were mainly motivated by an interest in wanting to help nature and the environment – acknowledging this will go a long way to encouraging involvement in AE schemes. Overall, there were few differences between farmers with and without AE schemes across all countries. These were:
1. The length of AE scheme agreements they preferred – those without AE schemes preferred shorter agreements (see Figure 1). This was less pronounced in England and Scotland where respondents without AE schemes were equally divided between annual, short (less than five years) and medium-length contracts (five-10 years). Those in AE schemes preferred contracts of medium length (England 44%, Scotland 60%).
2. Whether farmers are prepared to pay for advice – although a majority of both those with and without AE schemes thought advice should be funded by the Government, a significant proportion of those with AE schemes were open to funding it themselves. This was especially the case for over half the respondents in schemes in England and Scotland.
3. How often they wanted advice – both groups thought advice was needed when starting a scheme but those with AE schemes wanted advice more often. In England and Scotland over 50% of our respondents preferred to get advice when they requested it.
Key findings
Farmers report a lack of flexibility. This current inflexibility extends to how AE options are managed, the types of options available in schemes and lengths of scheme agreements. Shorter, more flexible schemes will encourage those without the experience of an AE scheme to join one. Access to advice, with Governmental funding for this, is important, though there is some evidence that farmers in the UK are prepared to pay for this advice. Increasing payment levels would help expand AE scheme participation but was not the only consideration. We asked specifically about the level of payment for Wild Bird Seed Mixes. A third of respondents thought these were too low. In Scotland and England farmers suggested an increase of 25-34% in the level of payment.
Julie Ewald, Francis Buner, Cameron Hubbard, Dave Parish, Fiona Torrance, Frans van Alebeek, Lisa Dumpe, Lene Midtgaard, Frank Stubbe
Figure 1
Respondents wanted advice more often, not just when starting a scheme.
4. Who should pay for AE schemes? Again, a majority of both those with and without AE schemes thought funding for them should come from the Government. However, there was a significant proportion of those with AE schemes who thought private funding (carbon or biodiversity offsetting) could be a source of funding for schemes. This was especially the case in England, where 33% of those not in a scheme and 59% of those in a scheme thought private sources could provide funding.
5. Flexibility in the way AE options are managed – both groups thought that there should be more flexibility in how AE options are managed. For those not in AE schemes, more were concerned about flexibility in aspects of agricultural management (herbicide use, manure spreading, etc.) than those in AE schemes. Management flexibility can raise concerns, however, as this shouldn’t weaken the biodiversity impacts of AE options. Examples of this would be earlier mowing that destroys nests of ground-nesting birds, or the planting of seed mixtures chosen by the farmers
themselves, resulting in measures that do not maximise the habitat needs for the targeted wildlife. Seed mixtures should therefore be designed by experts, based on the results of research. There should be scope for farmer involvement.
We asked respondents with AE schemes what other options they were interested in undertaking and asked those without AE schemes what options they would select if they were to join an AE scheme. These lists were similar, with floristically-enhanced grass margins, permanent wildflower cover, and supplementary overwintering food the most selected by both groups. Most of our respondents expressed an interest in predation control as a possible option, whether through habitat changes or through lethal, legal means – 85% of respondents in England and 80% in Scotland.
Regarding payment levels, we asked whether the level of payment for wild bird seed mix (£550/ha to £650/ha at the time of the survey) was enough. A subset of around a third of farmers thought this level was too low. We asked what payment level would be more accurate. Across all countries, they suggested payment increases of 18% to 29%, on average. In England respondents suggested an increase of 34% and 25% in Scotland.
Recommendations
To recruit those not currently in an AE scheme, we recommend that there should be an option for shorter contracts – of one or two years in duration, which allow farmers to experience being in an AE scheme. These schemes could include options with slightly less onerous requirements in terms of agricultural management conditions (restrictions on herbicides, manure, fertiliser use), although care needs to be taken to ensure that these options still provide for the environment. It is also important to provide free, targeted Government-paid advice and ensure fair payment levels.
To encourage enhanced engagement with AE schemes for existing participants, targeted Government-paid advice, longer contracts (five to 10 years), more options (including support for predation control), private sector funding, higher payments, addressing problems, building on experience and public recognition are important.
Reports on both the face-to-face interviews and the online survey can be found on the PARTRIDGE output library northsearegion.eu/partridge/output-library/
There should be more flexibility in how AE options are managed. Seed mixtures should be designed by experts, based on the results of research, with scope for farmer involvement
Farmers across all countries wanted the results of AE schemes to be monitored.
The PARTRIDGE project, led by the GWCT, part-funded by Interreg North Sea Region runs from 2016 to 2023, with 12 European partners in six participating countries (Belgium, Denmark, England, Germany, the Netherlands and Scotland). The project seeks to showcase at 10 demonstration sites (500ha in size, two in each country, except Denmark) how best practice and novel management solutions can be used to enhance biodiversity on arable farmland to help achieve the EU’s and the UK’s 2030 Biodiversity Targets. The project’s locally-adapted management plans are tailored to the grey partridge, because existing evidence shows that partridge-friendly measures, in particular wild bird seed mixes and wild-flower blocks, benefit farmland biodiversity in general.
During the PARTRIDGE project, we increased the amount of good- to high-quality (ie. wildlife-friendly) habitats by 4.1% on average across 10 demonstration sites (see Review of 2021, p.22-25). The project’s key high-quality measure is the PARTRIDGE wildflower plot, which provides suitable habitat year-round for the grey partridge and a wide range of other farmland wildlife. An important element of the project is to provide evidence that the project’s approach delivers more biodiversity and hence several indicator species were monitored throughout the project, including songbirds on farmland during the breeding season. Habitat measures tailored at grey partridge conservation were implemented, and monitoring took place, on each demonstration site, with monitoring also undertaken at 10 paired 500 hectare (ha) reference sites. The aim of the bird monitoring was to quantify the difference made by the habitat measures implemented at the demonstration sites to breeding densities and species diversity.
Breeding songbird numbers were monitored using a well-tested, but slightly adapted territory mapping method, originally developed in the Netherlands. At each of the 10 demonstration and reference sites, we surveyed all farmland birds along a six to seven kilometre (km) transect, five times between early April and the end of June, from 2017 to 2022. Each transect was surveyed on foot between sunrise and no later than 10am. In Scotland, the two demonstration sites are Balgonie and Whitburgh, while in England they are Rotherfield and Loddington. Observations were recorded on a handheld tablet with GPS using the AVIMAP app developed by SOVON (the Dutch equivalent of the British Trust for Ornithology) and data were uploaded to a server for analysis by INBO (the Research Institute for Nature and Forest in Flanders), our project’s data managing partner.
Across all sites, the number and diversity of farmland songbird species varied greatly between the different demonstration and reference sites, making direct comparisons between countries difficult. Nevertheless, there were three main findings: 1) Of the 12 farmland songbird species (skylarkr , yellow wagtailr , tree sparrowr , linnetr , yellowhammerr , common whitethroata (hereafter referred to as whitethroat), rooka , white wagtail, meadow pipit, stonechat, lesser whitethroat and
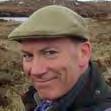
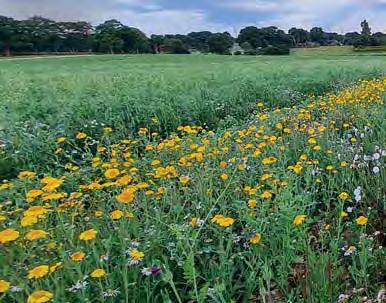
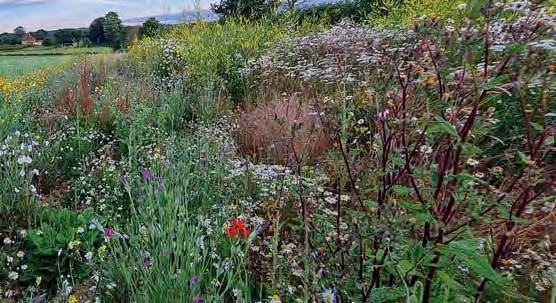
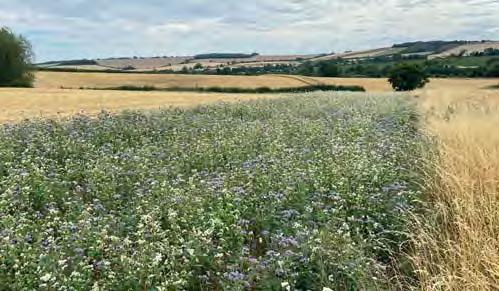
The project successfully promoted wildlifefriendly habitats, such as this PARTRIDGE wildflower block, to encourage farmland birds and insects.
goldfinch; R = UK red-listed, A = UK amber-listed, species ordered by red-list status and taxonomy) recorded across most demonstration sites, six (skylarkr , linnetr , yellowhammerr , whitethroata , lesser whitethroat and goldfinch) had, on average, significantly higher territory densities across all demonstration sites compared to the control sites. For two species (tree sparrowr and meadow pipit) there was a tendency for densities to be higher, while the two wagtail species (yellow and pied) showed similar densities. The stonechat was a new coloniser at Oude Doorn (the Netherlands), Nesselröden (Germany) and Rotherfield (England) during the course of our project; numbers were too low for statistical analysis, but at all sites they nested and foraged in our PARTRIDGE flower blocks.
2) Overall, farmland songbird species diversity was significantly higher at the demonstration sites (mean = 22.9 ± 0.1 SE) compared with the control sites (19.4 ± 0.1).
3) Across the six-year period and across all sites, the average annual rate of increase in numbers of territories for linnetr and whitethroata was significantly higher overall at our demonstration sites than our reference sites. These two species appear to have benefited the most from the new measures implemented by the project. Furthermore, the tree sparrowr , meadow pipit, lesser whitethroat and stonechat showed a strong but non-significant tendency for a higher increase at the demonstration sites, possibly because our time series of seven years was still too short to pick up significant trends.
Across all demonstration sites, the following songbirds were observed nesting (n) or foraging (f) in our PARTRIDGE flower blocks during the breeding season: skylarkr (n,f), marsh warblerr (n,f), whitethroata (n,f), stonechat (n,f), yellow wagtailr (n,f), bluethroat (n,f), reed bunting (n,f), linnetr (f), yellowhammerr (f), goldfinch (f), greenfinchr (f), yellow wagtail (f), chiffchaff (f), willow warblera (f), dunnocka (f), blackbird (f), song thrusha (f). Non-passerines included grey partridger (n,f), pheasant (n,f), quail (n,f), kestrela (f), sparrowhawka (f), tawny owla (f), barn owl (f), little owl (f) and lapwingr (f). Further records in PARTRIDGE flower blocks from outside our project areas included corncraker (n,f), corn buntingr (n,f) and grasshopper warblerr (n,f).
Overall, wildlife-friendly habitats covered more than 10% of the 500-ha demonstration areas (excluding urban areas but including woodland) at seven of the 10 sites (including Rotherfield in England), with 7-9% of wildlife-friendly habitat on two sites (Loddington, England and Balgonie, Scotland) and 5% on one, (Whitburgh, Scotland). All except one reference site had less than 5% of its area in wildlife-friendly habitat. Our results provide good evidence that arable farmland areas with at least 7% wildlifefriendly habitat provision, are a suitable way to recover farmland songbirds of conservation concern, in line with the EU’s and UK’s Biodiversity Targets for farmland.
Key findings
Across all 10 demonstration sites, six of 12 songbird species found on farmland (three of which are red-listed) had significantly higher numbers of breeding territories than at the 10 reference sites. Overall, farmland songbird diversity was significantly higher at the demonstration sites than at the reference sites.
Linnet and whitethroat, two species of conservation concern, had a significant increase across all 10 demonstration sites. Among the four UK demonstration sites, Rotherfield had the highest density of territories of farmland songbirds of conservation concern, which increased by 90% during the project period, while at Loddington the trend remained stable for the same species. In Scotland, the farmland songbirds of conservation concern present at the two demonstration sites increased by 70% at Balgonie and 40% at Whitburgh.
Francis Buner
Fiona Torrance John Szczur
Luc De Bruyn
The stonechat was a new coloniser at Oude Doorn (NL), Nesselröden (D), and Rotherfield (England) during the course of our PARTRIDGE project.
TABLE 1
Breeding territory densities of farmland songbirds of conservation concern recorded at the four UK PARTRIDGE project demonstration areas at the beginning of the project in 2017 for Rotherfield and Loddington, and 2018 for Balgonie and Whitburgh, compared with the end of the project in 2022
Territories per 100 hectares
mean (95 CI)*
Only species with high enough numbers to allow comparison included (R = UK red-listed, A = UK amber-listed). *From BTO Breeding Bird Survey (BBS).
Across the four UK demonstration sites the results varied greatly, reflecting the different geographical areas, farming systems, amounts of available wildlife-friendly habitat and predation management systems implemented.
1) The demonstration site that had the highest density of breeding UK red-listed farmland songbird territories was Rotherfield (mean = 185 ± 27 SE per 100ha, calculated from 2020-2023 data). Across our four UK sites, we recorded 10 farmland songbird species that are included in the UK farmland bird indicator (skylarkr , yellow
Acknowledgements
This project would not be possible without the help of hundreds of supporters. We thank all participating GWCT staff (in particular Dave Parish, Chris Stoate, Steve Moreby and Beth Brown), the PARTRIDGE co-ordinating partner organisations BirdLife NL, the Flemish Land Agency (VLM), INBO, the University of Göttingen and the Danish Hunters Association together with their local PARTRIDGE partner organisations, all the participating farmers, hunters, volunteers, NGOs and Government agencies, the Steering Committee members, and, last but not least, the NSR Interreg Secretariat in Denmark.
wagtailr , starlingr , tree sparrowr , linnetr , yellowhammerr , greenfinchr , whitethroata , rooka and goldfinch). Comparing the two English sites, the number of red-listed farmland birds (only the five songbird species with more than two territories per 100ha included) roughly doubled at Rotherfield during the project period (+90%), while at Loddington they remained unchanged (-1%). In Scotland, the same species increased by +70% at Balgonie compared with +40% at Whitburgh (see Table 1). UK-wide, the population trends between 2015-2020 (BTO bird trends) were: skylark (+8%), linnet (+2%), yellowhammer (-10%), whitethroat (-7%) and tree sparrow (-9%). The combined population trend of the red-listed species described in Table 1 was significantly better at all our UK sites (average +50%) compared with the national trend (-16%) during similar time periods.
2) Overall, species diversity of UK farmland songbirds was similar between Rotherfield (eight species) and Loddington (nine species), with Balgonie and Whitburgh both having seven species. Farmland bird diversity did not increase at any of the four UK sites during the project period.
3) Across the six-year period, the average annual rates of change in the number of territories of linnetr , greenfinchr , whitethroata and goldfinch at Rotherfield increased significantly (+17% to +32%) compared with the same species at its reference site where there was no change (-0.02% to -0.09%). At the other three UK sites, the average rates of change on the demonstration areas were higher for some farmland songbird species than on the corresponding reference areas, but none of the differences were significant.
Apart from regional differences, the difference in the number of red-listed farmland songbird breeding territories between the four sites may be explained by the different wildlife management strategies in place, in particular the availability of wildlife-friendly habitats and the level of predator management.
At Rotherfield, the amount of wildlife-friendly habitat increased by 3.3% from 14.8% to 18.1% between 2017 and 2022, at Loddington by 0.1% to 9.8%, at Balgonie by 2.3% to 8.2% and at Whitburgh it decreased by 2.9% from 8.2% to 5.3% of the total demonstration area. Predator management levels varied from high at Rotherfield and Whitburgh (full-time wild bird keepering) to intermediate at Loddington (part-time keepering) and no predation management at Balgonie (no keepering).
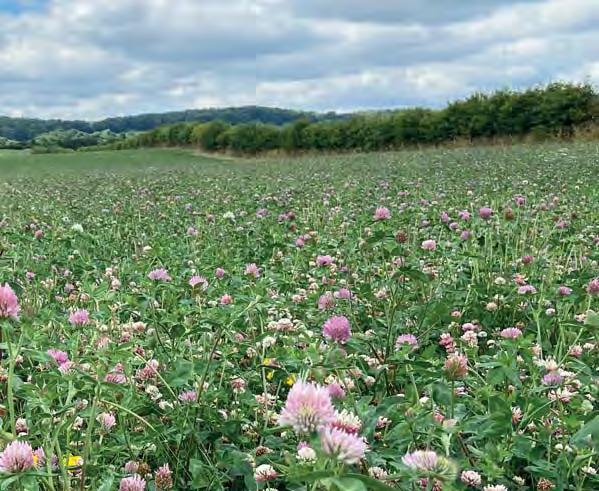
Farming with Nature
In 2020 we published a booklet that summarises the evidence upon which our project approach is based: Farming with Nature –promoting biodiversity across Europe through partridge conservation. This can be downloaded here: northsearegion.eu/partridge/ output-library/
Overall, farmland songbird diversity was significantly higher at the demonstration sites
NGC: trends in woodcock, woodpigeon & corvids
Background
The NGC was established by the GWCT in 1961 to provide a central repository of records from shooting estates in England, Wales, Scotland and Northern Ireland. The records comprise information from shooting and gamekeeping activities on the numbers of each quarry species shot annually (‘bag data’).
The National Gamebag Census (NGC) collates information on bag records from shoots and gamekeepers on 45 game and pest species, using questionnaires mailed to its participants across the UK. Providing returns is voluntary, and we are most grateful to all those who participate in the NGC. The returns are of immense value because the NGC is the only UK monitoring scheme to provide a perspective on changes in shooting at the national scale. In 2022, 514 returned questionnaires were received for the 2021/22 shooting season (80% of the 644 mailed). Trend analysis is based on sites that have returned bag data for two or more years. Year-to-year changes within sites are summarised to give an index of change related to the starting year, 1961. This means that in the graphs the first point is always set at a value of one. Increases to two indicate that the bag has doubled, decreases to 0.5 indicate a halving – all relative to the level in 1961. This year, we report on trends in woodcock, woodpigeon, crows (combining both carrion and hooded), magpie and grey squirrel.
Woodcock (Figure 1)
A total of 1,618 sites across the UK have provided information on woodcock bags since 1961. Most woodcock shot in the UK are foreign-bred birds that arrive from Scandinavia, Finland, the Baltic states and Russia in late autumn, with the result that most year-to-year variation in bags is due to breeding success or winter weather conditions in continental Europe. Colder winters on the continent result in more birds arriving in the UK, and subsequently higher bags, with reproduction affecting the number of birds produced each year. The trend in the bag index highlights the effect of the 1962/63 winter, with a decline in woodcock numbers across Europe. Subsequent increases reflect the recovery of the species, with the bag stable to slightly increasing from 1980 to 2010. The high indices in 2008/09 and 2009/10 reflect increases in the number of woodcock wintering in the UK during these very cold continental winters. The index has declined and then stabilised since, perhaps reflecting calls to limit woodcock shooting to December-January to protect local-bred birds, and the decision of many to not shoot woodcock at all. The low average index in 2020/21 results from covid restrictions on human movement, which curtailed shooting generally. In 2020/21, the bag was a third of that in 1961 and the lowest recorded in the intervening 60 years. Excluding the unusual 2020/21 value, the average annual bag index since 2011 is equal to the level seen in 1961, the first year of the NGC records.
Woodpigeon (Figure 2)
Woodpigeon are shot both for pest control and, in some UK countries, for sport; they are covered under General Licence (currently, England: GL42; Wales: WCA/
1
Index of the numbers of woodcock shot per square kilometre in the UK, 1961-2021
Figure
Figure 2
Index of the numbers of woodpigeon shot per square kilometre in the UK, 1961-2021
GEN/001/2023; Scotland: GL02/2023 – where they are shot for pest control only; Northern Ireland: TPG2) and can be controlled throughout the year for the prevention of serious damage to crops and feedstuffs. In the 60 years of the NGC reported here, 1,514 sites have contributed records on woodpigeon bags. The effect of the harsh 1962/63 winter can be seen in the annual bag index, when the bag declined by a third, with a continued slow decline until the early 1980s. In 1982 the bag index was nearly half the level of that recorded in 1961. From the early 1980s to 2010 there was a steady increase in the bag index, tripling over this time. Since then, with the exception of the 2017/18 and 2018/19 seasons, there has been a gradual decline, with the bag index over the past three seasons down by one sixth compared with 2010. Food availability explains much of the pattern in the annual woodpigeon bag. Early on, clover leys were crucial to woodpigeon survival overwinter, and the gradual decline in rotational ley farming through the first two decades of the NGC contributed to the decline in the bag, following the hard winter of 1962/63. Increases in the planting of winter-sown oilseed rape as a break crop, together with increases in winter-sown cereals, from the early 1980s led to increased food availability in the winter months and steady increases in the bag. The drop since 2010 coincides with an increase in trichomoniasis infection and a decline in the area planted to oilseed rape.
Key findings
The woodcock bag in the 2020/21 season was the lowest recorded in 60 years, most likely due to the covid restrictions that year.
Excluding 2020/21, the average annual woodcock bag index since 2011 is equal to that in 1961, with declines and then stabilisation since 2008/09. The bag indices of woodpigeon, magpie, carrion/hooded crow and grey squirrel did not show a decline in 2020/21, the season with covid restrictions. The last three years have seen another increase in the grey squirrel bag index, with levels 50% higher than those in the late 2000s.
Food availability explains much of the pattern in annual woodpigeon bags.
Index of the numbers of magpies culled per square kilometre in the UK, 1961-2021
NGC participants
We are always seeking new participants in our National Gamebag Census. If you manage a shoot and do not already contribute to our scheme, please contact Corinne Duggins on 01425 651019 or email ngc@gwct.org.uk
Figure 4
Index of the numbers of carrion and hooded crows culled per square kilometre in the UK, 1961-2021
Magpie (Figure 3)
Magpies are widespread across lowland UK. Their varied diet includes invertebrates, carrion, and a wide variety of plant material. They are considered a pest species owing to their predation of eggs and chicks of other birds. They are on the various General Licences throughout the devolved countries of the UK, currently covered by the following General Licences, England: GL40, GL42; Wales: WCA/GEN/001/2023; Scotland: GL01/2023, GL02/2023; Northern Ireland: TPG1, TPG2, TPG3. The allowed reason for their control differs between country – in Wales control of magpies for the purpose of conserving wild birds is no longer allowed. The trend in the bag index was calculated using bag returns from 1,284 sites since 1961. Bags increased five-fold from 1961 to 1991. The peak in 1991 coincides with the approval of Larsen traps for culling magpies. After 1991, the annual bag index declined by a fifth, and has remained approximately stable subsequently. The national trend in magpie abundance, estimated by the British Trust for Ornithology (BTO) through its Common Birds Census (CBC) and Breeding Bird Survey (BBS), shows a matching increase followed by stabilisation since around 1995, with the early increase in abundance linked to improved breeding success related to the expansion of magpies into suburban habitats.
increase in the grey squirrel index since the late 2000s
Carrion/hooded crow (Figure 4)
In the past carrion and hooded crows were considered the same species and were not always separated in historical NGC returns. We therefore used combined carrion/ hooded crow records from 1,423 sites to calculate trends since 1961. Crows are omnivorous, occur across all of the UK including the uplands, consume the eggs and chicks of many birds and can harm young livestock. They can be shot and trapped all year round under the terms of the General Licences in the devolved nations across the UK (currently, England: GL40, GL42; Wales: WCA/GEN/001/2023, WCA/ GEN/004/2023; Scotland: GL01/2023, GL02/2023; Northern Ireland: TPG1, TPG2, TPG3). The annual index of crow bags increased between 1984 and 1997, though it doubled as opposed to the five-fold increase in the bag index of magpies. Since 1997 the index has stabilised, similar to the magpie index, perhaps reflecting the fact that crows are also controlled using Larsen traps. The national trend estimated by the BTO’s CBC/BBS indicates a slightly higher increase in abundance from 1966, with long-term stability from around 2000.
Grey squirrel (Figure 5)
The grey squirrel was repeatedly introduced from the USA from the late 1800s to the early 1900s. It is now found throughout England and Wales, expanding into Scotland and Northern Ireland. It is responsible for declines in red squirrels and forestry damage across the UK. Owing to its status as an invasive species, it may be culled year-round. The trend in grey squirrel bags is based on returns from 1,169 sites over the past 60 years. Following declines in the early 1960s, the annual bag index remained fairly stable until the mid-1990s. It then increased until the late 2000s, reaching levels double those recorded in the first 30 years of the series. The last three years have seen another increase in the grey squirrel index, with levels 50% higher than those in the late 2000s. Although these increases may indicate increased efforts to remove grey squirrels to aid red squirrel conservation, BTO’s Breeding Bird Survey, which records grey squirrel abundance, indicates a 40% increase in their numbers from 1995 to 2021.
5
of the numbers of grey squirrels culled per square kilometre in the UK, 1961-2021
Index
Figure
Uplands
How heather cutting affects blanket bog habitat
Background
UK peatlands are of national and international importance for biodiversity and for their value to society and the economy. Most UK peatlands are blanket bogs, which are rain-fed, acidic, waterlogged habitats where dead plant materials naturally accumulate and eventually form peat. Blanket bogs capture and store carbon, and support specialised plants and animals, many of which are only found in these habitats and some of which are rare and declining. Beside heather and other taller vegetation, blanket bogs have a moss layer. This moss carpet, of which Sphagnum mosses are an important part, forms a protective layer over the peat and helps to prevent drying or erosion. The mosaic of carpet-forming and mound-forming mosses creates a hummock and hollow structure, allowing wet pools to form and creating a surface-level microclimate that can reduce rates of water evaporation and run-off.
Until recently, prescribed burning has been a widely used tool to manage vegetation on heather-dominated moorlands. In 2021 English regulations were updated to restrict burning of heather on blanket bogs following research reporting negative impacts of this burning. There is still uncertainty about some of these impacts but the restriction on heather burning has led to an increase in heather cutting. This method of management is relatively under-researched, with only a few studies looking at its effects, and even fewer looking at those effects on deep peat habitats. The increasing reliance on heather cutting means that more research is needed to understand better its effects.
In spring 2021 we conducted a study of plots that had been cut that winter (2020-21) to consider the short-term effects of heather cutting on blanket bog vegetation, focusing particularly on the depth, and variation in depth, of the moss layer. We collected data from two blanket bog sites in northern England, hereafter referred to as site A and site B, where heather had been cut in the winter of 2020/21.
On each site, we randomly selected 10 cut plots (minimum 5 metres (m) x 8m) with an uncut ‘control’ plot immediately next to each cut plot. We measured moss depth, taking measurements along four transects within each plot. We used the difference between adjacent values of moss depth to calculate an index of moss microtopography (‘hummocks and hollows’). We also recorded height and species composition of all the vegetation from five 1m2 quadrats within each plot, recording percentage cover of heather (Calluna vulgaris), other vascular plants, and Sphagnum, acrocarpous (usually have little or no branching and typically grow in erect tufts or mounds) and pleurocarpous (usually branched and tend to form spreading carpets) mosses.
The uncut plots revealed site-based differences. Vegetation height on uncut plots was on average 10cm higher on site A than on site B, while percentage cover of Sphagnum mosses was almost 20 times greater on site B than on site A. Conversely, pleurocarpous moss cover on site B was half that on site A. The percentage cover of acrocarpous mosses on both sites was low, just 5% (site A) and 2% (site B).
Moss depth, the index of microtopography, vegetation height and the percentage cover of pleurocarpous mosses were all significantly lower on cut plots than on control plots and, with the exception of the index of moss microtopography, this effect was consistent between sites. Overall, moss depth was almost 40% lower on cut plots (see Figure 1), and vegetation height was 60% less.
Cutting also had a significant effect on the index of moss microtopography at both sites but this effect was greater at site B (33% reduction) than at site A (13% reduction), resulting in a similar post-cutting index on both sites (see Figure 2).
This study showed that in the six months following management, heather cutting led to an immediate decrease in depth and structural variation of the moss layer. While
the heavy machinery used for cutting likely caused some compression of the moss layer, it was clear that cutting had ’scalped’ some of the hummock-forming Sphagnum mosses while pleurocarpous mosses, which usually form a carpet close to the peat surface, had been completely removed in some places. Damage to the Sphagnum mosses, by removing their growing tips, may limit the ability of the moss layer to regenerate. However, if the cut material is left scattered on the plot there is potential for regeneration from the remaining moss fragments. Regardless of the size or complexity of the moss hummock and hollow structure that was present before cutting, the machinery left behind a largely flat, uniform surface.
Given how important healthy moss layers are to functioning blanket bogs, it is vital that long-term monitoring of cut plots is conducted. Further research is needed to find out if altering the cutting height can reduce impacts on the moss layer while still removing enough of the heather canopy to stimulate the production of new shoots. As cutting becomes a more widely used management method, it is also important to consider the influence of machinery type, heather age and cutting frequency on carbon capture, water storage, and plant and animal communities.
1
Mean moss depth for cut and control plots on Site A and Site B. Data are based on 10 plots per treatment per site
2
Mean index of moss microtopography for cut and control plots on Site A and Site B. Data are based on 10 plots per treatment per site
Key findings
Heather cutting resulted in a 60% reduction in vegetation height.
Moss depth was 40% lower in plots that had been cut, when compared with adjacent un-cut control plots.
An index of moss microtopography was also significantly lower in the cut plots than in the control plots.
On cut plots, some of the Sphagnum moss hummocks had been ‘scalped’, and percentage cover by pleurocarpous moss was significantly lower than in the control plots.
Further research is needed to understand the longer-term effects of cutting and to consider other factors such as cut height, heather age and cut frequency.
Kimberley Holmes Siân Whitehead
Figure
Figure
Understanding merlin breeding requirements
Background
Our 20-month project is funded by the Green Recovery Challenge Fund, a multi-million-pound boost for green jobs and nature recovery in England, developed by Defra and related Governmental departments. The project aims to improve our understanding of merlin breeding requirements on managed grouse moors in northern England. It brings together different groups with a shared passion for merlin and differing perspectives on how to drive their recovery. The project engages with an audience that includes grouse keepers, raptor workers and the wider public through a range of channels, from peer-reviewed scientific journals to blogs, popular articles, workshops, presentations and a dedicated project website.
In northern England, grouse moors are important breeding sites for merlin. Here, they nest on the ground and appear to benefit from predator control conducted by grouse keepers. However, it has been suggested that some recent declines in parts of Scotland have been attributed to increases in heather burning on grouse moors, which reduces the availability of tall heather for nesting and may have knock-on impacts on the abundance of meadow pipits and skylarks, both important prey species for merlin. To explore this further, we made measurements of merlin breeding sites at moors in the North York Moors National Park, North Pennines AONB and Yorkshire Dales National Park, all Special Protection Areas for merlin.
Help with finding nests came from grouse keepers and British Trust for Ornithology (BTO)-licenced merlin workers in all three regions. In total, 52 nest sites were visited shortly after chicks had fledged to measure vegetation composition and height, overhead cover at the nest and to record the area of the heather patch in which the nest was located. All sample nests were in heather. Birds nested in heather which was on average 58 centimetres (cm) tall in the North York Moors, but only 40cm and 35cm tall in the Yorkshire Dales and North Pennines respectively (see Figure 1), with 83% of the nests being in heather patches less than 0.25 hectare. We quantified how much suitable tall heather for nesting occurred within each of 66 breeding territories, defined as within one kilometre (km) radius of the nest, by measuring heather cover and height every 50 metres (m) along four parallel, equally-spaced transects. Equivalent measurements were also made within 60 randomly-selected apparently unoccupied territories, with similar habitat composition and at similar altitudes. Wherever heather height was >35cm, ie. the height within which three-quarters of known merlin nested, the size of that heather patch was also recorded.
We surveyed the abundance of small passerines, predominantly meadow pipits and skylarks, within the occupied and unoccupied territories using standardised Breeding Bird Survey methods of two parallel 1km-transects to determine whether avian food availability could be limiting merlin distribution and breeding success. The first visit in April/May considered bird prey abundance in relation to merlin settlement patterns,
while bird abundance in the second visit in June, when most merlin had chicks, was related to merlin breeding success and specifically chick survival.
Merlin declines could also be triggered by increased over-winter mortality when birds leave the uplands to spend the winter in the lowlands. To measure this, we are using national ringing recoveries held by the BTO to calculate annual survival rates of adult and first-year birds and to consider the causes of death and their timings in relation to whether they occurred in the merlin breeding season when they are on grouse moors, or non-breeding season when on their wintering grounds.
The project team is currently processing the field data to address whether grouse moor management is a good or bad thing for breeding merlin. Our results will be within manuscripts submitted this year to peer-reviewed journals for publication. The evidence collected will be used to inform a best practice moorland management guide for merlin and we will disseminate key findings to moorland managers and practitioners at regional and national events in 2023.
For further information visit Merlin Magic gwct.org.uk/merlinmagic. Here you will find further project details, and a short guide to merlin ecology and why they need our help.
Figure 1
Mean heather height (cm) at merlin nests (n = 52) in the Yorkshire Dales and North Pennines (data combined) and the North York Moors
Yorkshire Dales & North Pennines
North York Moors
Key findings
Habitat data were collected from 52 merlin nests in northern England to establish whether increased heather burning and cutting on grouse moors may have reduced the availability of suitable nesting sites. All merlin nested in heather. Birds nested in taller heather in the North York Moors than the North Pennines and Yorkshire Dales. Most nests (83%) were in heather stands of less than 0.25ha. Results will help inform a bestpractice moorland management guide for merlin.
This project is funded by the Government’s Green Recovery Challenge Fund. The fund was developed by Defra and its Arm’s-Length Bodies. It is being delivered by The National Lottery Heritage Fund in partnership with Natural England, the Environment Agency and the Forestry Commission.
Exploring the maternal condition of red grouse
We started this study in March 2022 when 70 red grouse hens were caught, 10 at each of seven sites in Upper Teesdale distributed along an altitudinal transect from 250 to 650 metres (m) covering 17 kilometres (km). Body size (wing length, weight) and condition (breast muscle index) were measured from each hen. Caecal samples were obtained by individually boxing hens overnight from which strongyle parasite indices were derived. Many birds were thin, and the derived mean number of worms varied more than three-fold across sites from 500 to 1,700, averaging 1,150, quite a high value for early spring. Prior to release, birds were fitted with a radio transmitter.
Background
In recent years, there have been several poor breeding seasons for red grouse. Causes have differed between years but have included severe cold spring weather caused by the ‘Beast from the East’, poor heather quality following heather beetle outbreaks, high strongyle worm infestations and delayed emergence of craneflies needed by chicks. We wished to see how these, and other factors may interact to influence the pre-breeding condition of hens and their ability to produce goodsized clutches.
Cotton grass flowers, an important source of early spring protein, were counted weekly for five weeks at sample plots within each site and simultaneously heather was sampled to consider changes in its nutritional quality over the same period. This year proved to be an excellent year for cotton grass flowerhead production, with almost five times more flowers per m2 than in the previous spring.
Equipping hens with radios allowed us to track them and find 63 nests, with an average clutch of 8.7 eggs. There was a tendency for hens to lay larger clutches at higher altitude sites. All eggs were measured to consider whether hens in good condition laid more or bigger eggs and ultimately whether egg size was related to subsequent chick survival. Whilst measuring eggs, we placed a tiny thermocouple (i-Button) into the nest lining that remotely measured temperature every seven minutes. We retrieved them after the eggs hatched, downloaded the data and, by looking at cooling temperatures that indicated when the hen was off the nest, we gauged the frequency of incubation breaks and established when clutches either hatched or were predated. Output from one i-Button is given in Figure 1, showing regular temperature drops of 2°C when the hen leaves the nest to feed. The steep temperature drop on 05/05/2022 at 18:53 indicated the nest had been predated. Subsequent cyclical fluctuations represent the daily rise and fall in ambient temperature. We have such data from 52 nests which show consistent patterns of four to five incubation breaks per day, each of 20-30 minutes. Further analysis will relate hen condition to the frequency and duration of her incubation breaks. Timing of breaks were synchronous across hens and sites. Of the 63 clutches monitored, 57 hatched (90%), four were predated (two by stoat, one by badger, one by an unknown predator) and two were deserted when the hens died, one from strongylosis and the other was killed by a raptor.
Hatching date did not vary significantly between sites and 50% of clutches hatched in the week 14-21 May, mean date 18 May. By measuring cranefly and other insect abundance, a vital part of chick diet, using yellow sticky fly traps, we showed that chick
Equipping hens with radio transmitters allowed us to track them and measure their eggs.
hatch was synchronous with peak cranefly (Tipula subnodicornis) emergence. This was not the case the previous spring, when the cranefly peak was a fortnight later in early June and missed by grouse chicks. We estimated chick survival when broods were two weeks old by counting the chicks, typically aided by a pointing dog, and repeated this when broods were eight weeks old. This gave us a chick survival rate between hatching and two weeks old of 57%, when reliant on insects. A further 11% of chicks died between two to eight weeks old, whilst feeding on heather. These data will enable us to relate chick survival to food availability and to compare chick survival among our radio-tagged hens with similar estimates from untagged hens in the wider study sites using data from our July counts. Of the 68 hens tagged in March whose fate was known, 204 chicks (3.0 per hen) had fledged in early July.
We are now analysing our data to establish the drivers of hen condition and how this affected breeding success. In the interim, we tentatively suggest that 2022 was a reasonable recovery year for red grouse. Concerns about hens being in poor condition and carrying moderate to high parasite burdens in March were offset by an abundance of cotton grass flowers, a timely greening of heather and emergence of craneflies broadly synchronous with the hatching of chicks resulting in good chick survival.
It proved to be an excellent year for production of cotton grass flowerheads, which are an important source of early spring protein.
Key findings
We established a study to consider the relative importance of food quality, parasites and weather in determining the pre-breeding condition of female red grouse.
Ten hens at each of the seven sites in Upper Teesdale were equipped with radio transmitters to enable nests to be found, clutches to be measured and chick survival to be monitored. Moderately high strongyle worm parasite burdens were linked to poor female condition, but good cotton grass flowerhead production and early greening of heather appeared to offset poor female condition, allowing good sized clutches to be laid.
Emergence of craneflies preferred by chicks was synchronous with their hatch leading to reasonable levels of chick survival.
This article presents an overview of the following open-access paper published in 2022: Powell, LA, Aebischer, NJ, Ludwig, SC & Baines, D (2022). Retrospective comparisons of competing demographic models give clarity from ‘messy’ management on a Scottish grouse moor. Ecological Applications 32 (e2680): 1-21. https://doi.org/10.1002/eap.2680.
We owe a big thank you to the senior author, Larkin Powell, Professor of Conservation Biology at the University of Nebraska, who came on a six-month sabbatical to work in the GWCT’s biometrics department, with funding from the University of Nebraska, USA.
From 1992 to 2019, Langholm Moor has been the focus of studies on the interactions between red grouse, moorland management and raptors, especially hen harrier. During this period, there were several overlapping forms of management (see Figure 1), and all raptors were fully protected. A team of five keepers was employed during 1992-1999 and 2008-2016, when they burned and mowed patches of heather, culled non-protected predators such as foxes and carrion crows, and deployed medicated grit to prevent strongylosis in grouse (2008-2014 only). Diversionary feeding of hen harriers took place in 1998-1999 and 2008-2015 to reduce their predation on grouse. Sheep numbers were lowered in stages to reduce grazing pressure, with effective heather recovery only after 2007. Detailed monitoring of red grouse, their management and their environment was carried out over the full 28-year period. The annual number of successful hen harrier nests fluctuated between 0 and 17. Buzzard nest monitoring was not consistent, so we used smoothed annual transect counts to categorise buzzard abundance as low (<1 buzzard sighting per 10 kilometres (km)), medium (1-1.5 sightings per 10km) or high (>1.5 sightings per 10km).
Despite considerable investment, the post-2007 management that sought to restore grouse numbers for economically viable shooting at Langholm proved unsuccessful. To understand the important drivers of this complex managed system better, we adopted a retrospective adaptive management approach (see Box on page 43) that drew on the accumulated Langholm data in scientific papers and reports. Central to the approach was capturing the level of knowledge and the uncertainties involved through the construction and comparison of mathematical population models. Where knowledge is lacking (uncertainty), different models embodied different hypotheses about the factors underlying grouse population dynamics. Hypotheses regarding drivers of change in grouse density included weather, disease (strongylosis), non-protected predators (fox, crow, stoat), protected predators (hen harrier, peregrine, buzzard) and habitat extent (amount of heather). We captured the ongoing debate over the relative
importance of habitat and predation, especially raptor predation, by establishing a hierarchy of seven stochastic models that were increasingly complex with respect to the potentially important drivers of grouse numbers:
1. Baseline Model: weather, strongyle worms, shooting, overwinter density dependence.
2. Habitat Model: baseline + effects of habitat (heather cover).
Prof. Larkin Powell (University of Nebraska – see Background box) collaborated with the GWCT to use 28 years of data published from the Langholm Study (1992-2019), to carry out retrospective modelling of red grouse population dynamics within an adaptive resource management framework. The aim of the study was to identify factors driving changes in grouse density. By the study end, models combining many factors were favoured over simpler ones, implying that grouse abundance was jointly influenced by legal predator control, hen harriers and buzzards.
As heather habitat declined from 1992 to 2007, its importance with regard to predicting grouse density increased, particularly after keepering stopped. After keepering resumed in 2008, more heather habitat did not improve predicted grouse density, implying that it became unimportant after accounting for legal predator control, hen harriers and buzzards.
After 2011, when buzzard density was high, the most favoured models included buzzard effects, implying that buzzards were active grouse predators rather than scavengers.
Nicholas Aebischer
Shooting Heather burning
Medicated grit
Sheep grazing
High buzzards
Diversionary feeding
Cool June
1
Changes in pre- and post-breeding densities of red grouse, numbers of hen harriers, buzzard abundance, keepering and other aspects of management at Langholm from 1992 to 2019. Keepering was undertaken during the two periods shaded cream. Dotted horizontal lines for other factors indicate years of lower intensity or abundance
Grouse pre-breeding
Grouse post-breeding
Successful harrier nests
The models were tied into the timings of pre-breeding (March/early April) and postbreeding (July/early August) grouse counts, and stepped from one count to the next, starting in 1992. At each step the models took the observed density as their starting point and predicted what the density would be at the next count. Initially, all models were viewed as being equally likely (given equal weights). Then, step by step, the environmental conditions and management were updated in the spirit of a real-time adaptive management programme through ‘time’. We compared model predictions with observed grouse densities at each step, updating the model weights using a statistical Bayesian process that increased model weights for accurate predictions and decreased them for poor ones. The higher the model weights, the greater the weight of evidence and the more faith could be placed in the model.
By 1999, the weights associated with the first four models had declined close to zero and remained low, indicating that these relatively simple models that ignored raptors were inadequate to explain the recorded data (see Figure 2). The last three models gained in weight until summer 1998, then the weight of the buzzard + habitat model surpassed the weights of the other two by climbing to 0.46 by 2000. It remained the most highly-weighted model until the start of the second keepered period, by which time it had declined to match the weights of the other two models. From 2010 onwards, the weight of the hen harrier model fell away to 0.1, and the buzzard model took over as the most highly weighted model, with a steady increase in weight closing near 0.5. During that final period, the buzzard + habitat model was the second most-highly weighted model, closing around 0.4.
In summary, by the end of the study, the first five models had all been downweighted in favour of the models combining many factors, thereby emphasising the dynamic complexity of the system. The greatest weight of evidence attached to the buzzard model, which included legal predator control and hen harriers as well as buzzards, indicating that all three drivers were important in determining grouse population dynamics in the last phase of the Langholm Study. The further inclusion of heather habitat did not improve model predictions, implying that over the last period of the study habitat extent was unimportant after taking into account the effects of legal predator control, hen harriers and buzzards. Earlier, however, its importance
Figure
had increased, particularly during the unkeepered period from 2000 to 2007, which included a combination of declining habitat extent, falling hen harrier numbers and low-to-medium buzzard numbers. After 2011, when buzzard numbers were high, models including buzzard effects outperformed models without buzzard effects, offering strong probabilistic evidence against the notion that buzzards only scavenged grouse killed by other predators.
Adaptive resource management
Adaptive resource management was first conceptualised some 40 years ago, in response to uncertainty in environmental management and decision-making. It is a rigorous decision process that uses management actions to achieve objectives, learn about system responses and reduce uncertainty. Crucially, it embeds scientific process, population modelling and feedback within the decision process. Interest in it grew in the 1990s, especially in North America, to help manage exploited species (fish, wildfowl, forests). Unfortunately, it has become a frequently misused buzzword, often viewed as management that incorporates past experience (‘learning by doing’), and commonly confused with a trial-and-error approach to management. In fact, a true adaptive management approach follows the systematic procedure below:
Set-up phase:
1. Stakeholder involvement and commitment.
2. Agree clear, measurable management objectives.
3. Identify potential management actions.
4. Design models that capture process uncertainty.
5. Design monitoring to track inputs and outcomes.
Iterative phase:
6. Choose management action.
7. Collect monitoring data.
8. Compare model predictions with observed changes.
9. Repeat from Step 6.
Model weights associated with seven increasingly complex models of grouse population dynamics. The accuracy of model predictions was assessed against each pre- and post-breeding count in turn. At each step, an accurate prediction led to a model gaining weight while a poor prediction led to weight loss
Baseline
Baseline & habitat
Non-protected Predator (NPP)
NPP & habitat
NPP & Hen Harrier (HH)
NPP, HH & Buzzard (BZ)
NPP, HH, BZ & habitat
After 2011, the most favoured models included buzzard effects, implying that buzzards were active grouse predators
The yellowhammer is a UK red-listed bird species whose population is in decline across much of Europe. Studies aiming to identify the factors driving farmland bird declines have tended to focus on the potential factors related to this decline individually. Our research provides new insights into the relative impacts of arable farmland habitats, nest predators and prey availability on yellowhammer nest survival.
Farmland bird populations continue to decline at a European scale due to the intensification of farming practices across the continent. Our research focused on the nesting success of one such declining species, the yellowhammer. The yellowhammer is a lowland farmland specialist that nests alongside and within field boundaries. In England, the yellowhammer is listed on schedule 41 as a species of principal importance for conservation. UK populations have declined by over 50% since the mid-1980s, with similar rates of decline being documented across Europe. Yellowhammer are dependent on grain and wild plant seed throughout their life cycle, with invertebrates also playing an essential role in the diet of their chicks due to high protein content which aids growth and development.
Our analysis examined an 11-year dataset from the GWCT’s Allerton Project research and demonstration farm in Leicestershire. This dataset contained information on 147 nests monitored between 1995 and 2007. Our focus was on providing an insight into how yellowhammer nest survival is influenced by nesting habitat (nest concealment and nest height), foraging habitats (habitat coverage within 100 metres (m) of nests), the removal of nest predators (magpie abundance as an inverse measure of avian predator removal through gamekeeping) and food availability (invertebrate abundance). This study provides new insights into the relative effects of each of these factors on yellowhammer nest survival – measured as hatching success (number of eggs which hatched) and fledging success (number of chicks which fledged from nests where at least one egg hatched).
McHugh, NM, White, PJ, Moreby, S,
J, Stoate, C, Leather, SR, & Holland, JM (2022). Linking agri‐environment scheme habitat area, predation and the abundance of chick invertebrate prey to the nesting success of a declining farmland bird. Ecological Solutions and Evidence, 3(2), e12155.
Nests were located by systematic searches in field boundaries between March and August each year. Nest contents were checked every three to four days until the nest either succeeded (at least one chick fledged) or failed (no chick fledged). During nest monitoring, a score for nest concealment was recorded on a scale from one to three (well hidden, part hidden or exposed), as was the height (to the nearest 5cm) of the nest from the ground. Invertebrate data were collected annually at fixed locations in June using a D-vac suction sampler. Each sample comprised five sucks lasting 10 seconds each and corresponded to a sampling area of 0.5m2. The abundance of yellowhammer chick food items (spiders, flies, beetles, true bugs and butterfly caterpillars) was calculated at each sampling location. Magpie abundance was recorded via territory mapping and used in the analysis as a proxy for gamekeeping effort and as a direct measure of nest predator abundance. Finally, habitat availability was mapped using a Geographic Information System.
Our results indicated that yellowhammer hatching success was negatively related to the area of invertebrate-rich agri-environment scheme (AES) habitats (grass margin, grass set-aside, beetle bank, conservation headland) within 100m of a nest, and that hatching success improved the higher nests were located off the ground. A negative relationship between hatching success and margin AES habitats was also detected in a
Szczur,
Open access paper
TABLE 1
The average abundance of yellowhammer chick-food items present in the sampled habitats between 1995 and 2007
* Aphids, plant hoppers and leafhoppers
study of tree sparrow nest success (McHugh et al., 2017). We hypothesised that the relationship may be a result of the low abundance of seed resources these habitats tend to supply for granivorous adults, resulting in poor adult condition. An alternative explanation discussed in the paper presented here is that, as with nest height, this relationship may relate to predation pressure. This is because the habitats which comprise the invertebrate-rich AES category are typically narrow, linear strips located along field edges, which are more likely to be used by foraging carnivores in agricultural environments. Conversely, fledging success increased as the coverage of the seed-rich habitat wild bird seed mixture increased within the yellowhammer’s average foraging range (100m). This was our key finding relevant to land managers and it shows that a habitat intended primarily to provide winter food resources can influence the productivity of a farmland bird during the breeding season. Chick-food abundance in wild bird seed mixture was similar to the levels recorded in broadleaf and cereal crops, we therefore expect that this habitat benefits yellowhammer by improving adult fitness. This may allow adults to forage for longer and, where necessary, further for chick-food invertebrates, resulting in increased numbers of chicks fledging successfully. The highest levels of chick-food abundance were found in beetle banks and conservation headlands. We therefore recommend that wild bird seed mixture should be provided adjacent to invertebraterich AES habitats such as beetle banks and conservation headlands, concentrating resources for this declining farmland bird.
Invertebrate-rich conservation headlands, provided adjacent to wild bird seed mixture, can provide food items important in the diet of yellowhammer chicks.
Key findings
We observed that yellowhammer hatching success was negatively related to the area of invertebrate-rich agri-environment scheme habitats within 100 metres of a nest and that both hatching and fledging success increased as nest height off the ground increased. Yellowhammer fledging success was positively influenced by the area of wild bird seed mixture within 100 metres of a nest. We recommend that invertebrate-rich agrienvironment scheme habitats (eg. beetle banks or conservation headlands) are located alongside wild bird seed mixtures to facilitate adult yellowhammer foraging for invertebrate resources important in the diet of yellowhammer chicks.
Niamh McHugh
Steve Moreby
John Szczur
Chris Stoate
Wild plants and insect pollination
Background
In recent decades, pollinating insects have declined worldwide, and a lack of pollination can negatively impact the yield of several crops, such as field beans and apples. The fall in the number of pollinators is also likely to affect wild plants which depend on pollination for reproduction. Farming practices which support pollinators, such as planting wildflower mixes, may therefore have wider benefits.
Acknowledgements
Thank you to all the landowners and managers who gave us access to their farms for this study. This work was partially funded by the BEESPOKE Interreg North Sea Region Programme (northsearegion.eu) under the Programme Priority 3 ‘Sustainable North Sea Region ̦. The programme is funded by the European Regional Development Fund (ERDF) of the European Union. Partial funding also came as part of the H3 project. H3 is part of the ‘Transforming UK food systems’ research programme funded via UKRI’s Strategic Priorities Fund (BB/ V004719/1).
Mean proportion hawthorn fruit set between groups of farms managed conventionally and using regenerative practices in two areas of England (N=34) Figure 1
The BEESPOKE (Benefiting Ecosystems through Evaluation of food Supplies for Pollination to Open up Knowledge for End users) project is funded by the EU North Sea Region Interreg programme and runs from 2019 to 2023. The project is developing crop-specific flower mixes tailored to support the types of pollinators required by the target crop, with the aim of increasing crop yield and quality. In 2021 we were granted an extension to this work to look at the wider benefits of pollinator conservation on wild plants and to look at the effect of different farming systems, specifically regenerative agriculture, on pollinators. Regenerative agriculture systems vary but always include practices that protect soil health such as reducing soil disturbance, increasing use of cover crops and using diverse crop rotations.
In the summer of 2022, we explored factors affecting the pollination of hawthorn across 31 sites in Hampshire, Wiltshire and Dorset (hereafter Southern sites) and Cambridgeshire. Hawthorn is not only a key structural component of farmland hedgerows, it is also an important winter food resource for frugivorous farmland birds. Previous work involving the GWCT (see Review of 2008, pp.56-57) demonstrated that hawthorn flowers were dependent on pollination to produce fruits (fruit set). Fruits may be lost before maturity because they have not been well-pollinated. We compared the levels of hawthorn fruit set, as well as the number of pollinators and the availability of other floral resources, between farms. The farms differed in the extent of regenerative agricultural practices used and in the number of agri-environment measures they had, including pollen and nectar mixes.
Firstly, we visited the hedges in May when the hawthorn was in flower and marked 20 groups of hawthorn flowers on a 60 metre (m) transect along the hedgerow. We counted the number of flowers in each group so that we could come back and work out how many flowers produced fruits. At this first visit, we also measured the floral resources available in the hedgerow and the hedge bank. Plant species were identified and quantified in a 1m x 2m vertical quadrat on the side of the hedgerow and in a 1m x 1m horizontal quadrat placed on the adjacent hedge bank or field margin. We also counted the number of flowers present in both quadrats, with six quadrats per hedge transect.
We then monitored the pollinator community present at each hedge. We walked along the 60m hedge transect and counted all bumblebees, solitary bees, hoverflies and butterflies. Specifically we noted which species were on the hawthorn flowers to record insects important for hawthorn pollination. The pollinator and floral resource surveys were repeated in July, after the hawthorn had finished flowering. Finally, we went back to the hedges in late September to measure mature fruit set.
We found variation in pollinators, floral resources and fruit set between farms. Initial exploration of the data suggests that fruit set of hawthorn was higher on farms with more regenerative practices (24.7% ± 1.5) compared with conventionally-managed farms (16.6% ± 1.3) in both Cambridgeshire and Southern England (see Figure 1). We would expect that the number of pollinators would also be higher on these farms. However, the relationship between farming system and the number of pollinators seen on the transects along the hedgerows depended on the pollinator group and region. More bumblebees were present along hedgerows on regenerative farms in Southern England (an average of 3.9 ± 1.6 bumblebees per hedge in regenerative farms, 0.8 ± 0.2 per hedge in conventional farms) but not in Cambridgeshire. Conversely in Cambridgeshire, more solitary bees were seen on regenerative farms than conventional farms (an average of 3.4 ± 1.2 solitary bees per hedge compared with 2.1 ± 0.8 per hedge) (see Figure 2).
It may be that the floral resources present influenced the pollinator numbers. The number of flowerheads seen in the hedge bank was much higher on regenerative farms in Hampshire, whereas in Cambridgeshire the differences between farming systems was not as clear. However, independent of broad management differences, the number and diversity of floral units/flowers available in the hedge bank varied by an order of magnitude between sites and the flower structures present likely influenced the pollinators seen foraging. For example, clovers have a long flower tube so their nectar is only accessible to long-tongued pollinators, whereas the open flower structure of umbellifers like cow parsley can provide resources for less-specialised pollinators. Further investigation is needed to disentangle the relationships between farm management, floral resources and pollinators.
We set up an experiment using hawthorn fruit set in hedgerows as a measure of wild plant pollination on farmland. We monitored fruit set on hedges on farms using either conventional or more regenerative practices.
We also measured the number of pollinators present and the availability of other floral resources near the hedges. Hawthorn pollination differed between farms – farming practices and region may have had an effect.
The numbers and types of pollinators present also varied between regions; for example, more solitary bees were seen in Cambridgeshire compared with sites in the south of England.
Lucy Capstick, Jayna Connelly, Niamh McHugh, Ruby Woollard, Seshi Humphrey-Ackumey, Madeline Kettlewell, Madeleine Baker, Ellie Ness, John Holland
Figure 2
Mean pollinator numbers per 60m of hedge transect in May between groups of farms managed conventionally and using regenerative practices (N=37)
Game and songbird numbers have been monitored annually at the Allerton Project at Loddington since it began in 1992, providing an insight into how both have been influenced by changes of management over this period. In particular, they have provided valuable information on the effects of predator control and winter feeding.
Since 2011, the shoot at the Allerton Project has been based on the release of reared pheasants, although the farm is still managed for wild gamebirds, including habitat management, winter feeding and some predation management during the nesting season. Following the GWCT guidelines for releasing densities in Sites of Special Scientific Interest (SSSI) and other woodland sites, 2,600 pheasant poults were released across the 333 hectares of farmland. Eleven driven shoots and two walked-up days were held over the 2021/22 winter.
Despite the success of the farm as a reared pheasant shoot, a population of wild pheasants has not established and breeding success, and subsequently autumn numbers pre-release, continue to be very low (see Figure 1). In previous articles, we have described how our research has indicated that disease and poor body condition of pheasants in the spring have resulted in very few nesting attempts and heavy spring mortality. The level of shooting associated with a reared pheasant shoot may also be limiting the establishment of ‘wild’ pheasants on the farm. The result is low numbers compared with the numbers present in the early phase of the project (1993-2001), when there were fewer shoot days and up to 151 breeding hen pheasants and 379 wild poults were recorded.
Breeding success of partridges is also low. Red-legged partridges have bred in six of the past 10 years, but numbers of young recorded on autumn game counts are very
feeders removed
Figure 2
Red-legged partridge numbers from 1992 to 2022
Adults
Young
Keepered periods
low (see Figure 2). Although grey partridges have been seen on the farm, our autumn game counts reveal that none have bred successfully since 2014. Loddington has always been sub-optimal habitat for grey partridges, with heavy clay soils and open farmland being confined to the edge of the farm. As a result, they have thrived only when very substantial efforts have been made to provide the right conditions in the form of nesting and brood-rearing habitat, combined with control of predators.
Brown hares have fared better than the gamebirds in recent years, indicating effective predator control and suitable habitat that supports them. In 2022, winter spotlight counts revealed that their numbers were nine times higher than the 1992 baseline year, and five times higher than at the comparison site two kilometres to the south (see Figure 3). Although hare numbers are not as high as they were in the early years of the project, reflecting reduced intensity of keepering, the management of the farm is still providing added benefits for this species, when judged against the comparison site.
We reported on changes in songbird numbers in detail in the Review of 2021. In 2022, our annual transects show that overall breeding abundance of songbirds was 81% higher than in the 1992 baseline year. The abundance of Biodiversity Action Plan (BAP) species is also 81% above the baseline.
Key findings
Breeding songbird numbers are 81% above the 1992 baseline.
Breeding success of pheasants continues to be poor.
Red-legged partridge breeding success is low and grey partridges have not bred since 2014.
Brown hare numbers are nine times higher than the 1992 baseline and five times higher than at the comparison site.
Chris Stoate
John Szczur
Amber Lole Matthew Coupe
Figure 3
Brown hare numbers from 1992 to 2021
Hallaton (comparison site)
Keepered periods
Acknowledgements
Thank you to Kings Crops who supply the seed and provide agronomy support to the Allerton Project.
The Allerton farming year
Background
The Allerton Project is based around a 333-hectare (822 acres) estate in Leicestershire. The estate was left to the GWCT by the late Lord and Lady Allerton in 1992 and the Project’s objectives are to research ways in which highly productive agriculture and protection of the environment can be reconciled. In 2022, it celebrated its 30th anniversary.
The 2021-22 season was a significant improvement on the previous year for the Allerton Project farm. Crop establishment in autumn 2021 was kind in comparison to some of the more recent annus horribilis and the winter crops got away well. However, the spectre of climate change is never far from our fields. 2022 proved to be a remarkably dry year from the off, culminating in the serious drought and record-breaking heat which led to a maximum temperature of 37.8°C here at Loddington, on the 19 July. In fact, following 12mm of rainfall on the 18 June, there was no appreciable further precipitation until a further 12mm on the 16 August – which immediately ran away into the gaping cracks in the earth which had opened-up across the farm, many running more than half a metre deep.
Despite this – and in line with the national trend – yields held up remarkably well across most crops, although our oilseed rape put in another disappointing performance as a result of pest damage through the season. Frustratingly, some of our agri-environment areas (especially those established in the spring) were badly affected by the drought, which means that some will need to be re-established. This demonstrates that – in the new world of ‘public money for public goods’ – it’s not just climate change’s impact on food crop production that will be significant, but also on the wider farmed environment. Indeed, in recent years many farmers have begun to put out water through very dry periods for farm wildlife to drink from as ditches and streams run dry, though the wider impact of such weather extremes is felt by everything from invertebrates to trees. It was interesting to note, however, that certain plant species we include in our agri-environment seed mixes, such as phacelia and buckwheat, were far more tolerant to the dry conditions than others, such as clovers. This sort of observational learning will no doubt begin to inform future varietal selection.
Our permanent pastures were, like most across the country, frazzled to the consistency of a brown snooker table, with our sheep being fed hay, which was meant for winter, in the middle of the summer. As a result of the chronic lack of fodder nationally, in August, Defra pragmatically granted a derogation to allow the grazing of agri-environmental scheme two-year legume fallows (AB15), a rotational arable option of which the only management normally allowed is mechanical topping. As a result, it has been great to see sheep in more of our arable fields than we had expected this year – and sheep being sheep, subsequently escaping and being present in our woods and village gardens too. But the valuable organic manures they bring will hopefully help turbocharge the good work of those longer-term fallow crops.
Arable gross margins (£/hectare) at the Allerton Project 2010-2022
TABLE 1
Key findings
2021-22 was an improvement on recent years in terms of crop establishment and yields. Climate change continues to impact our farming operations. Natural Capital resources as well as crops were adversely affected. Integrated Pest Management is an increasing part of our operations.
Joe Stanley Oliver Carrick
Indeed, one of the benefits of our new Mid-Tier Countryside Stewardship Scheme is that we are now being paid to establish these rotational fallow crops in arable fields. We feel greater benefit is to be had by removing them from the combinable crop rotation for two-five years rather than attempting to control weeds, especially, black grass, by increasing the use of both herbicides and cultivations. Ultimately, this is a move back towards the traditional Norfolk four-course rotation where exploitative cropping phases are balanced by restorative phases in a way which has become unfamiliar to increasingly specialised arable operations in the past two generations. This is amplified by our continuing use of over-winter cover crops preceding spring cropping, ensuring that living roots are present in the soil for as much of the year as possible to boost soil health, retain nutrients and reduce run-off and erosion.
We have been fortunate this year to have the use of a second direct-drill, a fourmetre Claydon one-pass tine seeder, kindly loaned to us on a long-term basis by the manufacturer. Through its use we have achieved some great establishment results. It does, however, move more soil than our ageing Dale EcoDrill, meaning that our main tractor lacks the horsepower to pull it up some of our more challenging slopes.
Harvest 2022 was a relatively straightforward affair, even though this year, for the first time, we had to rely on the services of a local contractor, which is never ideal from a timeliness point of view. In fact, one of the biggest challenges was not rain, but excessive heat and lack of humidity. The oilseed rape was cut into the night and early morning to ensure there was sufficient moisture to bring it above the 6% minimum threshold and to reduce the amount of ‘pod shatter’ and shed seed. In temperatures which frequently climbed into the 30s centigrade, combine harvesters across the country often had to stop work during the day, both to avoid over-hot grain going into store and to reduce the risk of field fires. More than 500 significant fire ‘incidents’ were recorded in England alone this summer.
Excessive heat and a lack of humidity was the biggest challenge to harvest 2022
The rains finally came in sufficient weight in the autumn of 2022, allowing the drilling campaign to conclude without incident. Once again winter crops and cover crops have established well, though not without a few challenges. For example, despite the use of a straw rake to ensure even distribution of the chopped residue from the previous wheat crop, conditions seemed to conspire against our tine drills operating effectively in amongst the straw. This maybe because our now healthy populations of earthworms stopped work, burrowing deep into the soil and hibernating from the drought, leaving our straw on the surface unprocessed. This necessitated the use of a disc drill borrowed from the next door farm, which over-came the problem. This demonstrates once again that progression along the ‘regenerative’ path is not linear, nor without incident, and that each season, crop and field must be treated according
Gross
to its own specific character. We can already see that drilling spring crops into the winter cover crops will be another ‘trashy’ affair, as the warm, moist autumn has enabled green covers to grow up to knee height. We might be glad to have the woolly lawnmowers back again.
Finally, along with every farm in the country, we are seeing the withdrawal of direct payments as we transition from the Common Agricultural Policy to Environmental Land Management schemes, a withdrawal which sees us receiving some 25% less in support than was the case two years ago. How to replace this money will continue to be the key question for us, and many others in the coming years, as we seek to balance profitability, food production and the environment.
Figure 3
Crop yields at the Allerton Project 2012-2022
Spring oilseed rape was sown in 2013, *winter beans, **spring oats
We are constantly seeking a balance between profitability,
Storing carbon in soils is often seen as the goal of sustainable farming, and much focus has been turned to this with recent goals set for cutting emissions from UK agriculture. Globally efforts are increasing to offset rising atmospheric carbon dioxide (CO2).
Most of the carbon found in soil is held within the soil organic matter (SOM). This is most biologically useful when it breaks down and cycles nutrients through the ecosystem. Hence, a new question for soil research is ‘Can we profit from both the storage and decay of SOM, or must it be a choice between one or the other?’ Not all soil carbon is equal, with some preferentially broken down by soil microfauna, while other fractions of carbon remain stable due to physical, chemical, and environmental conditions. By better understanding how our management affects the types of carbon stored within our soil, and the flows of carbon through the ecosystem, we can aim to use the carbon within our soil to drive essential soil processes while still protecting and building the slow-forming stocks of carbon within the soil. It is with this aim that the research into long-term direct drilling is being carried out at the Allerton Project.
Ploughing mixes up soils and allows recalcitrant patches of SOM to become mixed with oxygen and microbes, stimulating a flush of microbial activity, SOM breakdown and nutrient release. It is expected that ploughed plots would release more CO2 through these processes. Short-term (five years) direct-drilled plots at the Allerton Project released less CO2 than ploughed plots, but our long-term (>10 year) directdrill plots released more CO2 than expected (see Figure 1). One explanation for the increased CO2 release from the soil is a shift in the microbial community over the 10 years the soil has been left undisturbed. A laboratory assay called Microresp™ was used to identify whether the microbial community was more active in the long-term direct-drilled plots. This method uses fresh soil and chemical substrates similar to those the soil fauna would normally feed on. The rate at which the microbes can break down these different substrates gives an indication of the microbial community’s functional
We recorded increases in carbon dioxide released from direct-drilled plots, likely due to increased microbial community respiration. Despite an increase in soil respiration, direct drilling increased soil organic matter by 0.5%. These patterns were only seen in our long-term direct-drill site (>10 years), not in our shorter experiments running for five years.
Jenny Bussell
activity. The microbial community within the direct-drill plots was nearly twice as active as the ploughed plots, suggesting that the increased CO2 release may be due to the more active microbial population. Alongside this increase in microbial activity, a 0.6% increase in SOM (from 4.3% to 4.9% – a 14% increase) was measured in the direct-drilled plots, suggesting that the increase in CO2 release is not at the detriment of carbon stored as organic matter. Further tests showed that the change in carbon content was mostly due to an increase in the active carbon fraction, which is the proportion readily available to feed the soil microbiota (see Figure 2).
We concluded that the less disturbed plots have built up a more active microbial community, which is preferentially cycling active carbon, while repeated ploughing is stimulating the breakdown of slow-cycling carbon, diminishing SOM and reducing microbial activity within these plots. Cycling active rather than slow carbon is crucial for ensuring the continued slow release of resources for plants while protecting the stored carbon as SOM. It is vital that we understand how management alters not only carbon fluxes but also the longevity of carbon stocks within the soil, and we plan to continue this research at the Allerton Project. Understanding the changes in slow and active carbon can help elucidate the effects of long-term management on carbon dynamics and sequestration within agricultural systems.
Acknowledgements
1
Carbon dioxide flux from soil in ploughed and long-term direct-drilled plots
2
The active carbon fraction of the top soil (0-10 cm) from ploughed and long-term directdrilled plots
Figure
This research was funded by the Kildare Charitable Trust.
Plough
Direct drill
Figure
Conservation Agriculture
Background
Our Conservation Agriculture trial seeks to demonstrate the economic and environmental benefits of moving from a conventional plough-based establishment system to a reduced tillage/directdrilled system. This trial is part of a wider European project undertaken by Syngenta, a provider of agricultural science and technology. The trial has been running since 2017; it will continue until at least 2024.
Since 2017 the Allerton Project has been delighted to host a pioneering, long-term field-scale experiment in partnership with Syngenta, a major international provider of agricultural science and technology. The purpose has been to develop an understanding of a cereal cropping system based on the principles of ‘Conservation Agriculture’ to develop a better appreciation of more sustainable crop production techniques. Essentially, the key principles of Conservation Agriculture are:
Biological diversity in the rotation.
Keeping ‘living roots’ in the soil for as much of the year as possible.
Maintaining ‘soil armour’ – ie. vegetative cover – for as much of the year as possible.
Minimising soil disturbance, both mechanical and chemical.
The intention is that, by combining these four practices, we can improve the health, fertility and productivity of our soils and reduce the environmental impact of food production while (hopefully) increasing farm profitability.
The experiment is based around a five-field, five-crop rotation in the sequence; winter wheat, winter barley, winter oilseed rape, winter wheat, spring beans (following an overwinter cover crop). Into each of these five fields, three plots were then created of around one hectare, which would remain in place over the lifetime of the project. One plot would be annually ploughed, one would experience ‘minimum cultivation’, or discing, and one would be ‘direct-drilled’ each year. All three plots would otherwise be treated the same. This allowed us to discern what impact the three tillage practices would have on a range of financial, production and environmental metrics across the full rotation.
Our heavy clay soils at the Allerton Project, Loddington, are representative of some 30% of the farms in lowland England. To make this trial as informative as possible, we were paired with an arable farm in Kent, on a light, sandy soil, to see what difference soil type makes.
The results after five full years of analysis have been highly revealing. As might be expected in our more challenging soils at Loddington, when comparing the directdrilled plots to the ploughed plots we have seen a 7% reduction in yield. Cultivation, after all, provides a fine seed bed, optimal for crop establishment and growth. Yet the
cost savings from moving from annual ploughing to a direct-drill system are appreciable: a 44% reduction in fuel use; a 50% increase in work-rate; and an 11% drop in operational costs, fac toring in the savings in machinery and horsepower required between the two systems. This has led to an overall increase in profitability per hectare of 14%, despite the lower yield. In Kent, the figure is a higher 16% increase in profitability alongside a static level of yield.
There are also positive environmental data. Not only is there clearly a large carbon saving in the reduction in fuel use, but at Loddington we have also seen an 8% reduction in soil greenhouse gas emissions resulting from reduced tillage. Under ploughing, oxygen enters the soil, allowing microbes to devour the organic matter it contains, which is released as carbon dioxide. It’s this organic matter which also provides the core fertility and structure to our soils, and which tillage the world over has severely depleted in the past two generations. Overall, the carbon footprint per tonne of production has dropped by 4% here. What’s more, we’ve seen a huge difference in both the numbers of farmland birds between the ploughed and reducedcultivation plots (especially wintering lapwings, with the birds clearly favouring the increased cover and food available on the direct-drilled plots) and in earthworm numbers, which are appreciably higher in the ‘Conservation Agriculture’ plots. Earthworms are key indicators of soil health.
Overall, this project has produced valuable data to confirm the often-anecdotal observations from farmers that there seem to be significant benefits to be gained in moving from a conventional tillage system to a reduced tillage, ‘Conservation Agriculture’, system. This has implications for the environmental and financial sustainability of arable production systems going forward. It should always be stressed that farmers must retain the option to plough when the agronomic circumstances demand it, for example in the case of a blackgrass issue, where the best solution may be to bury the seed at depth, or for certain crops such as potatoes. Conditions have also been far from perfect in recent seasons, with extreme weather forcing flexibility into the rotation, with spring wheat and barley replacing the planned winter crops at times.
We are now proceeding with a new phase of the trial which will carry on the core tillage-related element of the first five years, while investigating whether we can now optimise the use of inputs such as plant protection products and fertiliser across the plots to further reduce the environmental impact of our farming operations. Excitingly, we are also integrating diverse leguminous leys and organic manures into the system to move in a more ‘regenerative’ direction. The addition of grass, livestock and manures – on top of the four principles of Conservation Agriculture – is considered to be the hallmark of a regenerative system. We will also be trialling innovative products such as biostimulants and satellite monitoring, merging the best of modern technology with traditional agricultural practice.
Farmers are increasingly being asked to produce more, with less. The reality is that we will need to increase our food production in the next 30 years to feed an additional two billion people by 2050. But we must do that in a more sustainable manner than has been the case in the past 70 years. This pioneering trial gives us the hard data with which to make good decisions about how we can best meet that challenge in the coming years, balancing profitable food production with safeguarding our natural environment.
Figure 1
Overall percentage changes in a range of environmental and farm economic measures after five years on direct-drilled plots compared to ploughed plots
Key findings
Conservation Agriculture (CA) crop establishment and yield in clay soil were lower compared with continuous plough. However, there were significant cost savings in fuel, time and machinery under CA. Overall we saw a significant increase in farm profitability under CA.
Even better results were recorded on a light soil type. There are additional significant benefits for the environment and climate metrics under CA.
Joe Stanley
Auchnerran - demonstration farm
Auchnerran: biodiversity monitoring
Background
Since 2015 a wide variety of surveys have been carried out at GWSDF to quantify the abundance and diversity of wildlife present. We have monitored red squirrels, bumblebees, game (including hares, woodcock, pheasants and partridges), raptors, rabbits, corvids, mammalian predators, ticks on sheep, soil invertebrates and birds, most notably waders. Annual monitoring of key species can be of great use in understanding fluctuations in populations and, for example, the impact that farm management changes might have. Here, we describe the findings from our wader nest monitoring (used to determine the survival of eggs laid in a nest) and our farmland bird monitoring.
Acknowledgements
We are grateful to Working for Waders for supporting our wader research and to our placement students Amy Cooke and Gemma Morgan for their invaluable assistance collecting and checking data.
This year the wader breeding season started two weeks earlier than usual, with the first lapwing nests detected on the 2 April. After recording unusually high predation rates by badgers the previous year (see Figure 1: in 2021, 22% of the 128 wader nests monitored failed due to badger predation), we considered trialling various mitigation measures such as placing electric fencing around nests or diversionary feeding the badgers to minimise predation. However, it was decided to continue monitoring as per usual, to allow us to assess whether the observed badger predation in 2021 was becoming a new ‘trend’ due to a growing badger population on the farm (GWSDF is now home to three family groups, with three main setts spread across the farm), or whether the increased predation was due to other factors. This turned out to be a good decision, as we recorded only two badger predation events this year, which is much more in line with findings pre-2021 (see page 62-63 for our results on what has driven wader nest predations by badgers). We have secured funding to carry out further research into badger diet, habitat use and their potential impact on wader productivity which is due to start in January 2024.
Fewer wading birds returned to the farm this year and it is unclear what role avian flu may have played in this. We recorded 87 lapwing, 18 oystercatcher and seven curlew nests, with an overall hatching rate of 67% across all three species (50-86%). We observed a total of 53 hatched lapwing nests from which we recorded a total of 46 fledged lapwing chicks. Our results showed that predation remained the greatest cause of failure (followed by nest abandonment n=4) with corvids (mainly rooks and jackdaws) being the main lapwing nest predators (48%). The difference in primary nest predators between years (see Figure 1) highlights the importance of continued nest monitoring and predator control on the farm, especially in key wader nesting areas.
We continued our year-round farmland bird monitoring and recorded 52 different bird species. This included several UK red-listed species, with Auchnerran farm supporting populations of greenfinch, yellowhammer and linnets, despite UK-wide declines. However, our surveys showed a decline (-14%) in our total breeding bird numbers for the second year in a row, albeit numbers are still above our records for 2019 (see Figure 2). This decline may reflect the large fluctuations in winter and spring weather conditions we have seen in recent years at Auchnerran. To support our songbird populations, in 2022 we initiated a supplementary feeding programme that runs from November to the end of March, to help birds through their so-called ‘hungry gap’. By providing additional food sources, we aim to reduce winter mortality of resident and overwintering songbirds and improve the condition of our resident
songbirds in advance of the breeding season. We deployed bird feeders with two different types of songbird seed mixes at eight locations across the farm. These feeders were monitored with trail cameras to identify which seed mix is preferred by different bird species and we hope to report increased numbers of farmland birds next year.
Not only was 2022 a year of many staff changes for the Scottish research team, but it was also a year of reflection. Reflection on our widely varying work programme, the survey protocols and the species monitored. As a result, some of our species monitoring protocols will change going forward and some surveys will not continue. More detailed results of the biodiversity monitoring that has been carried out to date, our rabbit control management plan, and a peek-preview of our new demonstration and research projects, can be found in the Auchnerran Report 2022 gwct.org.uk/ auchnerran. Looking forward to 2023, we will place more emphasis on vegetation monitoring and recording farm management, and research will focus on the efficacy of regenerative farming practices (eg. mob grazing, direct drilling, herbal leys) and their impact on biodiversity, sheep health and sheep productivity.
Figure 1
Proportion of lapwing nests taken by different predators at Auchnerran, 2018-2022. Y axis shows percentage of all nests monitored; values show total number of predated nests
2018 (n=19)
2019 (n=11)
2020 (n=17)
2021 (n=35)
2022 (n=21)
Figure 2
Change in the total number of individuals of all species observed during breeding bird surveys between 2015 and 2022, with percentage change in abundance between years shown. Maximum number of breeding birds observed in a single count
Key findings
Nest survival for lapwing, oystercatcher and curlew was higher than last year. Average hatch rate increased from 40% to 67%, leading to fewer second nesting attempts and as a result the total number of nests declined from 128 to 112. Hatch rate was 61% for lapwing (87 nests), 50% for oystercatcher (18 nests) and 86% for curlew (seven nests).
Wader nest monitoring showed that predation was the greatest cause of lapwing nest failure, accounting for 78% of the 27 failed lapwing nests. Cor vids were the dominant nest predator in 2022, predating 12% of all monitored nests. Total breeding bird abundance was down by 14% relative to 2021, although numbers were still up on 2019 levels.
Max Wright, Marlies Nicolai, Louise de Raad
Fox Badger Mustelid Hedgehog Gull Corvid
The Auchnerran farming year
Background
The Game and Wildlife Scottish Demonstration Farm (GWSDF), also known as Auchnerran Farm, is a 482 hectare farm in east Aberdeenshire, bordering the Cairngorms National Park. The GWCT took on the farm lease in 2015, with the aim to demonstrate how modern agricultural practices and livestock management can co-exist with wildlife conservation and game management to form an economically viable system in a hill-edge setting. More information about Auchnerran, including our annual reports, can be found at gwct.org.uk/auchnerran
Some big changes were seen on the farm in 2022. Louise de Raad was appointed at the start of the year as director of the GWSDF. Her task is to manage all aspects of operations, including the farming, research, and demonstration and outreach activities. Max Wright has taken over the role as research assistant from Marlies Nicolai, who will continue to run the shoots on the farm, and two new placement students started work on the farm in September. Dyfan Jenkins started as the farm’s new head shepherd in early November, taking over the role from Allan Wright who has done a fantastic job to improve the health and productivity of the sheep flock over the past years. Together, we have started to take GWSDF into its next phase, with more focus on demonstrating and trialling regenerative farming techniques to reduce inputs and greenhouse-gas emissions and to further enhance biodiversity. Alongside the new emphasis on innovative and nature-friendly farming practices, our main objective is to ensure that the farm continues to be profitable (see Figure 1).
In 2022, we experienced significant snowfall towards the end of March and April, followed by a heatwave over the summer months, which led to very dry conditions and later growth of grass than we normally see. This resulted in a reduced crop of silage (see Table 1), but together with our brassica forage crops, we have had ample forage for the sheep over winter. We continued to have a good weaning percentage in our sheep (127%) and the flock is now consistently performing at or above the QMS LFA hill ewe flock top 1/3rd benchmark.
Flock size declined significantly in the early years at Auchnerran as we improved the age structure and health of the flock by weeding out the old, sick animals, with the goal to increase productivity to viable levels. Over the last three years, a flock size of around 1,400 ewes has been maintained (see Table 1), but we will increase this number to our target flock size of 1,500 in 2023. We believe this is an optimum flock size that can be supported on the farm, managed by a single person and is appropriate for tick control on the adjacent grouse moor where the sheep graze in summer.
Ovine pulmonary adenocarcinoma (OPA) is an infectious (viral) and fatal lung disease of sheep that has been a concern since GWCT took on the farm in 2015. Overall, we have seen approximately 115 ewe deaths this year (8%), with OPA thought to be responsible for 42-70 deaths (3-5% of the flock). We actively manage to keep levels of OPA as low as possible by culling ewes that show symptoms and by not using feed blocks to help avoid bringing ewes into close contact. We are investigating ways to further improve our farm management in 2023 to minimise virus transmission.
We have continued to undertake carbon audits and natural capital assessments. This year we used NatureScot’s Natural Capital template as part of a pilot that included 50 farms. This showed us that the habitats on the farm are in good shape.
The farm emissions, which emanate largely from the sheep themselves, are countered by carbon sequestration in soil, hedges and woodlands
TABLE 1
The carbon audit was extended to include 2018-2021, and the AgreCalc Carbon Calculator being used now includes a soil sequestration element. This is especially important for a farm like Auchnerran that consists of 70% pasture of one kind or another. The farm emissions, which emanate largely from the sheep themselves (64% of our whole farm emissions come from enteric fermentation, followed by fertiliser at 22%), are countered by carbon sequestration in soil, hedges and woodlands. With soil sequestration included in the calculations, we have turned the corner from being a net producer (319 tonnes) of CO2 equivalent, to seeing a net sequestration of around 2,141 tonnes of CO2 equivalent. We have also undertaken our first whole farm soil sampling and are awaiting results. Our work in this area puts us at the table with NatureScot for discussion and development of future land management practice and payment systems.
Figure 1
Auchnerran farm profit, 2015-2022
Farm profit
Key findings
Despite ongoing challenges with ovine pulmonary adenocarcinoma (OPA), the farm continued to perform well in 2022. We weaned 1.27 lambs per ewe and produced 551 bales of silage, with an average of 24 bales per hectare. We have grown the overall flock size to 1,400 breeding ewes this year and aim to increase the flock to our target size of 1,500 in 2023. Our updated (2021) carbon audit included soil carbon sequestration for the first time, which indicated that GWSDF was a net sequester of carbon.
The GWCT took on the management of Auchnerran farm at the end of 2014 and began baseline biodiversity surveying to assess the abundance and diversity of wildlife on the site. These revealed the farm to have exceptionally high numbers of breeding waders, with nesting lapwing, oystercatcher and curlew. The farm was highlighted as a key site for breeding lapwing in Scotland, so they became a focus of research. As of 2018 survey methodology has been standardised to best monitor nests and chicks of breeding waders, primarily using trail cameras to determine threats and challenges. In 2021 this monitoring revealed abnormally high rates of nest predation by badgers. Consequently, we investigated the cause of this in 2022, leading to the findings presented here.
In the Review of 2021 (pages 58-59) we reported that the single greatest cause of clutch failure for lapwing at Auchnerran was predation by badgers. Across all three species of nesting waders, suspected badger predation, based on field signs and other evidence, was responsible for 22 nest predation events – around 18% of all wader nests in 2021. Moreover, after excluding those clutch failures where a reason for failure could not be identified, badger predation on wader nests accounted for 66% of all nest failures. We report here on further analysis of these predation events in 2021, results from 2022 and plans for further research in 2023.
Information gained in 2021 indicated that badger nest predation events happened within a specific climatic window, when it was particularly cold and dry. Firstly, over 80% of the badger predation events occurred when the temperature was at or below 5.5°C. The average daily temperature for wader nests on the day they were predated was 4.2°C (± 0.7 SE), compared to 5.9°C (± 0.7 SE) on days where nests were predated by other predators (see Figure 1). Moreover, the mean total rainfall for the 30 days prior to nest predation by badgers was 48mm (± 8 SE). This was just over half the rainfall during the 30 days up to the completion day for all other wader nests (84mm ± 6 SE). This fits our initial hypothesis that the badger predation events were associated with the abnormally cold and dry weather during that period in 2021.
This fits nicely with existing research on badger foraging behaviour. When the ground is cold and dry, they are unable to forage effectively for earthworms and other invertebrates, in part due to lower earthworm activity levels at the soil surface. Moreover, the period during which the nest predation occurred coincided with the time of year when badgers have extremely high calorific requirements, as they replenish fat reserves following torpor over winter (a form of semi-hibernation). During this period a badger’s minimum required calorific intake is roughly comparable to that of a large man, and it needs to consume large amounts of high-calorie food. Therefore, our findings indicate that due to the abnormal weather seen in 2021, the badgers at Auchnerran were likely experiencing a caloric deficit, which led to a sharp spike in the
Acknowledgements
Thanks to Bryony Tolhurst and Rachel White from the University of Brighton and Louise de Raad from GWSDF for supervision. I am also grateful to Marlies Nicolai, Dave Parish, and the undergraduate placement students of 2021 for the hard work in collecting the data.
number of predation events on wader nests. This is also supported by the evidence from the 2022 breeding season, with only two recorded badger predation events on all wader nests, despite an increase in the amount of badger activity on site. Moreover, both predated nests in 2022 were within five metres of established badger paths and likely opportunistically predated as a result. Next year, we are looking to expand our research to understand the population and foraging dynamics of our resident badgers in more detail. We are hoping to do this through GPS tracking, as well as employing novel techniques such as metabarcoding of faecal samples. We will be able to quantify badger diet and the frequency of wader eggs and chicks consumed.
Figure 1
Comparison of air temperatures (mean marked x) on the day of predation for 22 nests predated by badgers and 26 nests lost to all other predators in 2021. The box represents the interquartile range and the lines the full range of temperatures
Key findings
Badger predation on wader nests at GWSDF was high in 2021, with 83% occurring on nights with air temperature at or below 5.5°C.
Average temperature on the days that nests were predated by badgers was 4.2°C, compared with 5.9°C on the days when other predators predated nests.
Average total rainfall for the 30-day period prior to a nest being predated by a badger was around half that for nests that were not predated by badgers (48mm vs 84mm).
The most likely explanation is that badgers were unable to forage effectively for earthworms on cold and dry nights, leading to a spike in predation events on wader nests. In 2022, only two nests were predated by badgers, despite increased badger activity, reinforcing the evidence that the badger predation events were at least partially due to abnormally cold, dry spells.
Max Wright
Predation
Fox genetics
Background
Previous research on regional fox population ecology has shown high rates of fox immigration onto shooting estates where culling occurs. In the New Forest, where foxes are culled to protect breeding curlew, they are rapidly replaced by others. During the GWCT’s EU LIFE-funded Waders for Real project, which focused on lapwing and redshank recovery in the Avon Valley in Hampshire, GPS tracking has shown foxes to be living at surprisingly high densities, with individual foxes dispersing over large distances (>20 km), including to urban areas. To better understand where itinerant foxes are predominantly arriving from into protected areas, where professional wildlife managers are trying to limit fox numbers for the benefit of threatened prey species, we are examining the regional population structure of foxes by harnessing the power of genetics.
We thank the professional wildlife managers and gamekeepers who have supported this study by donating fox tissue samples for genetic analysis.
Our genetic analysis of foxes in central southern England is part of a PhD project funded by the GWCT and Bournemouth University, which aims to understand the drivers of regional fox population dynamics. The theoretical underpinning of this work is that areas readily exchanging foxes will share genetic similarities compared to areas where individuals are more isolated. This is because in a single contiguous population, the frequencies of genetic variants are expected to be about the same between groups of individuals. However, where there are barriers that restrict gene flow, non-random mating occurs and the frequencies of genetic variants are expected to diverge between groups, resulting in the emergence of population genetic structure across the landscape.
We provided an initial insight into the population genetic structure of foxes in central southern England, by sequencing two fragments of the mitochondrial DNA (mtDNA) genome in over 50 foxes across the region, from areas including the New Forest, upper and lower Avon Valley, Hurn, Cranborne Chase and the Isle of Wight (see Figure 1). These analyses indicate that there is little, if any, population structure on the mainland, consistent with many other studies that have examined population structure in foxes over similar geographic scales. In general, foxes are highly mobile animals with the ability to thrive in a broad range of landscapes and habitats, facilitating their dispersal across a wide area. In addition to their fast rates of reproduction, this also accounts for why foxes are so difficult to manage – those removed by lethal control activities are rapidly replaced by itinerant foxes searching for vacant territories. Interestingly, the only convincing evidence for genetic differentiation we found was between the Isle of Wight and all mainland areas (see Figure 2). The hunting with hounds literature suggests that foxes did not naturally colonise the Isle of Wight but were introduced there during the mid-1800s for sport, with subsequent periods of ‘stocking’ by hunting enthusiasts. Although foxes are capable swimmers, the distance between the island and the mainland (1.2 miles) in these strongly tidal waters probably is a restrictive boundary to natural migration. Given the island was likely seeded by a
relatively small number of individuals, the ‘genetic makeup’ of those on the mainland will not have been perfectly represented (ie. a biased sample) by the ancestral foxes first introduced to the island – resulting in a phenomenon that population geneticists refer to as the ‘founder effect.’ The Solent provides a barrier to gene flow and has likely preserved these genetic differences over time.
A caveat of our existing analyses is that mtDNA is strictly inherited from the maternal line, therefore our inferences are technically based on the movement of females rather than the whole population. This is potentially important, as sex-related differences in fox dispersal have often been noted in the scientific literature. Moreover, although a classic approach to investigating population structure, the mtDNA sequences used in this study are relatively short in length, thwarting our ability to resolve population structure to a high resolution. To take this a step further, we will be conducting a new study using next-generation sequencing technology to obtain information on genetic variants throughout the whole genome of hundreds of individual foxes simultaneously. This will tell us whether there are any particularly important source areas from which immigrant foxes are predominantly arriving from into protected areas such as the New Forest. Together with region-wide data collected on fox diet, this will serve to inform wildlife management practitioners and other local authorities to design more targeted and effective interventions.
Figure 1
Map of central southern England with circles representing the locations where 53 fox samples were obtained for this study. Colours correspond to each study site: black = Upper Avon Valley, orange = Cranborne Chase, green = New Forest, purple = Lower Avon Valley, red = Hurn, blue = Isle of Wight
Figure 2
Concatenated D-loop and Cytb median-joining haplotype network for the central southern England and Isle of Wight samples. The size of the circle represents the frequency of the respective haplotype, and the colours represent the populations of the individuals carrying a particular haplotype. Dashed lines represent the number of base pair differences between haplotypes. White circles represent internal nodes
Key findings
We sequenced a fragment of the mitochondrial genome in over 50 foxes sampled across central southern England (Dorset, Hampshire, Wiltshire, and the Isle of Wight).
A population genetic analysis using these data revealed a lack of population structure across the mainland.
Foxes on the Isle of Wight were genetically differentiated from all mainland areas.
Nathan Williams
Mike Short
Anthropogenic food in fox diets in the New Forest
The New Forest National Park supports a suite of red-listed breeding wading birds, notably curlew, lapwing, woodcock and ringed plover, but surveys over recent decades show steep declines linked to poor productivity especially for curlew and ringed plover.
Background
The red fox has been linked to declines in native wildlife, including vulnerable ground-nesting birds. The New Forest, in central southern England, is an important area for breeding waders, with one of the most significant concentrations of breeding Eurasian curlew in the UK’s southern lowlands. Trail camera monitoring of wader nests across the New Forest between 2021 and 2022 indicated a high proportion of nest losses to foxes, while fox sighting rates recorded by wildlife managers over the same period suggested high levels of fox activity. To help understand what food resources are supporting foxes, we analysed stomach contents of foxes culled by professional wildlife managers from across the New Forest.
Although the area is well protected by high-level conservation designations, waders breeding here are subjected to significant anthropogenic pressure. The New Forest is flanked by the cities of Southampton and Bournemouth, their associated conurbations, and the adjacent rural landscape includes numerous towns, villages, settlements and open-access land. More than 1.2 million humans reside in the region, and the population doubles with visitors to the park during the spring and summer months when wader breeding occurs.
Between 2021 and 2022 we used trail cameras to monitor the fate of 140 wader nests (predominantly curlew and lapwing) across the New Forest and documented 62 predation events, of which 56% were attributed to foxes. We are particularly interested in understanding how human activity may drive the population dynamics of generalist predators – especially foxes – in this region, and the associated consequences for breeding waders.
Foxes are one of several generalist predator species that thrive in human-modified landscapes, often reaching exceptionally high population densities. Foxes are not obligate carnivores, so can easily adapt to seasonal fluctuations in food availability and famously monopolise easily accessible food resources, such as human rubbish. This largely explains the success of foxes in colonising urban areas.
Between 2021 and 2022, professional wildlife managers provided 452 stomach samples from foxes culled in the New Forest to protect breeding waders during the nesting and chick-rearing period. Of this sample, 395 stomachs contained identifiable food items, the remainder being empty. Macroscopic analysis of contents revealed a varied diet, with no single predominant prey item. Many food items contributed similar proportions to the overall bulk of the population’s diet, highlighting the generalist nature of fox diet. However, marginally, invertebrates, lagomorphs, small mammals and anthropogenic food items were of primary importance (10-15% of the overall diet), while birds, plants and large mammal remains (such as deer gralloch) were of secondary importance (3-8% of the overall diet) (see Figure 1).
Identifiable anthropogenic foods found within the fox stomach samples included pet food, garden bird food (such as peanuts), pizza, chips, pasta, rice, curry and fish pie. We examined how the proximity to human settlements, dwellings, gardens and campsites
Acknowledgements
This work was part-funded by Bournemouth University as part of a match-funded PhD project with the GWCT. We thank Forestry England for its support, and especially the professional wildlife managers who provided stomach samples for analysis. Also, thanks to GWCT placement student Rosa Hicks, and PhD student Elli Rivers for help with laboratory work.
influenced the occurrence of anthropogenic food within the diet; our findings indicate that the closer a fox is to human settlements, the higher the occurrence of anthropogenic food found within its stomach. Anthropogenic food comprised on average 18% of fox diet sampled within 500 metres (m) of human settlements, falling to 5% for foxes sampled between 500-1000m of human settlements, and 4% for foxes sampled more than 1000m from human settlements. This suggests that villages are potentially acting as food-rich ‘safe havens’ for foxes whose territories also encompass crucial wader breeding areas. Food could be discarded waste scavenged from rubbish bins and purposely provided food from individual gardens. Using prior fox density estimates for the New Forest and surrounding areas, we will calculate how many ‘extra’ foxes are being supported by anthropogenic foods and model the impact of this added predation burden on breeding waders. This will help inform a holistic landscape management approach to conserve the remaining breeding wader populations in the New Forest. Human activity can influence the productivity and movements of generalist predators in other ways, with released gamebirds suggested as a reason for high fox densities nationwide. However, within our New Forest study, we found only a trace of gamebird remains in our sample of fox stomachs (percentage of overall diet = 1%). Further investigation into fox diet, and the diet of other generalist predators, is required across other landscapes for a better understanding of the causes of high predator activity in different scenarios. This would aid the development of more bespoke and effective predation management strategies supporting prey species of conservation concern.
Diet of foxes in terms of volume of a given food category when present (left axis) against its frequency of occurrence (x-axis). Different coloured lines connect points with equal relative volume (right axis) Figure 1
We analysed stomach contents of 452 red foxes legally culled across the New Forest to protect breeding waders. Foxes were found to have a varied diet with no single food category predominating.
Macroscopic analysis of fox stomach contents found anthropogenic food comprised around 12% of the overall fox diet in the New Forest. The presence of anthropogenic food in fox stomachs was associated with close proximity to human settlements and other infrastructure.
Jodie Case
Nathan Williams
Mike Short
River Frome Atlantic salmon population
Background
At the Salmon & Trout Research Centre at East Stoke we carry out research on all aspects of Atlantic salmon and trout life history, and have monitored the run of adult salmon on the River Frome since 1973. The installation of our first full-river-coverage PIT-tag systems in 2002 made it possible for us to study the life-history traits of salmon and trout at the level of the individual fish. The PIT-tag installation also enabled us to quantify the smolt output. The River Frome is one of only 12 index rivers around the North Atlantic reporting to the International Council for Exploration of the Sea on the marine survival of wild Atlantic salmon, and the only one in the private sector.
Figure 1
Estimated spring smolt population, (with 95% CI) 1995-2022
Average for the most recent 10 years = 9,456
Salmonid growth
River Frome salmonids grow fast and all the PIT-tagged parr are young of the year. As a result of the fast growth more than 97% of salmon smoltify after one year in the river, whereas trout smolts are a mixture of one- and two-year-olds.
Smolts
An estimated 10,430 (95% CI ±1,320) salmon smolts left the River Frome in 2022, 10% higher than the 10-year average of 9,456 (see Figure 1). In the second half of April, we only recorded 15mm rainfall at East Stoke and as a result of the low rainfall, there were no discharge events to trigger the smolts to leave the river during the main migration window in late April-early May. The peak of the smolt migration was in the first week of May when increasing water temperatures incentivised the smolts to leave (see Figure 2). As previously reported, when average daily water temperature exceeds 12°C more smolts migrate during daytime and the warm temperatures in 2022 provided a good example of this. Fifty-six percent of the recorded tagged smolts were detected moving during daytime, which is much higher than the 10-year average (25%).
Parr tagging
With a below-average population of spawners the previous winter and an exceptionally dry and warm summer in 2022, we entered the parr tagging season with low expectations. We encountered slightly fewer parr during the tagging season than normal and ended up PIT-tagging less than 9,000 of the target 10,000 juveniles. Whereas parr numbers encountered were lower than normal, it was not catastrophic despite the challenging river conditions during the summer. However, only when we learn what proportion of the salmon smolts are PIT-tagged next spring will we get an estimate of the size of the parr population in the catchment during parr tagging.
France ( Channel Manche ) England
Figure 2
Daily smolt detection pattern for 2022
Adults
Our preliminary estimate of adult salmon for 2022 is 628 (see Figure 3), this is 5% above the 10-year average (596). On 10 March we detected the first returning PIT-tagged multi-sea-winter (MSW) salmon of 2022. This is the earliest we have recorded a PIT-tagged returning salmon on the River Frome since we started tagging in 2002 and it was the start of a strong and early run of MSW salmon. By the end of May we had recorded 158 MSW salmon which is nearly 100 more than the 10-year average (59) for this period. These MSW salmon primarily originate from a large 2020 smolt cohort. The return of fish from this cohort as grilse (1SW) in 2021 was slightly disappointing but they have now come through in 2022. The number of 1SW salmon recorded was below average in 2022, but these come from a very small 2021 smolt cohort. A high proportion of the 2SW salmon will be female and, as the number of eggs per female is strongly related to body size, we expect this to result in an above average amount of eggs. So although the total number of adult salmon returning to the River Frome in 2022 was only just above average, the high proportion of two sea-winter (2SW) salmon provides hope for recruitment from the winter 2022/23.
Key findings
The estimated salmon smolt output on the River Frome in 2022 was up 10% on the 10-year average and the dry and warm spring resulted in more than half of the salmon smolts migrating during daytime. The River Frome had a strong run of early multi-sea-winter (MSW) salmon dominated by two sea-winter (2SW) fish from a large 2020 smolt cohort. The total estimated adult salmon run was 5% above the 10-year average. As MSW salmon are dominated by females, and the number of eggs is related to female body size, the recruitment potential from the 2022 adult run is encouraging. The density of parr encountered during 2022 PIT-tagging was low, likely a combination of below-average spawning stock the previous winter and an unusual dry and hot summer.
Figure 3
Numbers of returning adult Atlantic salmon in the River Frome, 1973-2022
Average for the most recent 10 years = 596
Rasmus Lauridsen
Smolt mortality
Background
Migratory salmonid populations have declined drastically in the last four decades and the recent decrease in marine return rates of salmon suggests that salmonid populations could be more impacted during the marine phase than previously recognised. There is poor knowledge on the early marine stage in transitional waters despite speculation that mortality in this phase could be high due to the high levels of human activity and other pressures concentrated in estuaries and coastal waters. We need to understand the challenges that smolts face during their first migration to enable effective management and conser vation of salmonid populations.
France ( Channel Manche ) England
SAMARCH
SAlmonid MAnagement Round the CHannel
Figure 1
Mean estimated (with 95% credible intervals) survival of Atlantic salmon and sea trout smolts in relation to migration speed (m s¯1) during estuarine seaward migration
The management of anadromous species that complete part of their life cycle in fresh water, where they reproduce, and marine waters, where they take advantage of more favourable feeding habitats, is complex because they occupy a wide range of habitats during their lifetime. Young anadromous salmonids undergo physiological changes at the end of their freshwater phase that enable them to tolerate salt water and become ‘smolts’. This transformation ensures that they are ready for their first migration to sea, leaving their natal river to spend several months up to several years at sea, before returning to reproduce.
Physical, chemical and biological variations in the marine ecosystem have been correlated with increased marine mortality of salmonids, but the process of how these factors contribute to marine mortality is still unclear. For this reason, in 2018 and 2019 the GWCT fisheries department started tracking smolts during their first seaward migration. The objectives of this study were to compare the survival between salmon and sea trout smolts, to compare the survival between four study sites (estuaries Scorff and Bresle in France and Frome and Tamar in England), and to explore the effect of a broad range of biotic (size, body condition, sex and age, migration speed) and abiotic (discharge, river, temperature, salinity, dissolved oxygen, migratory distance) variables on smolt survival during this critical phase of their life cycle.
A total of 474 salmon and 360 trout smolts were implanted with V5 acoustic transmitters (Innovasea, hereafter ‘tags’), each tuned to emit a unique ultrasonic signal coding for an identification number (or ID). The signals were detected, decoded and recorded by acoustic receivers deployed in each of the four study systems along the smolts’ migration path, from the tagging site to the exit of each estuary. Size, body condition, sex and age of the fish were determined at capture, and environmental parameters such as temperature, salinity and dissolved oxygen were monitored in the estuaries. Acoustic detections were then analysed with a Hidden Markov Model, considering all recorded variables, to estimate smolts survival rate.
At all sites and in both years, salmon smolts exhibited lower total survival than trout smolts with a mean overall survival of 79 ± 17% and 88 ± 12%, respectively. A similar trend in survival of these two species was reported in research from Denmark. Salmon and trout were tracked through the River Skjern and its estuary, with the estuarine survival of salmon smolts (61%) much lower than that of trout smolts (88%).
Survival of smolts was similar across sites except for the Frome estuary (Dorset, UK), where it was lower. Similar levels of survival at the three other estuaries was unexpected, as smolt survival has been shown to vary widely from one site to another.
A recent review of aspects of salmon migration reported 36-100% survival in estuarine habitats. Smaller variation has been reported for trout survival during their estuarine migration, with survival ranging from 76% to 87%, although the number of studies of trout are limited and the sample size in these studies were modest.
Fish that exhibited a faster migration speed during their estuarine migration had higher survival rates than slower individuals (see Figure 1). There are suggestions in published literature that faster swimming might enable fish to cross dangerous areas quickly and to avoid predators. For both species considered here, survival between acoustic receiver gates decreased with distance covered during their migration (see Figure 2). These results matched our expectations as the distance smolts travel during their migration has been reported to influence their survival negatively in many studies. Neither species displayed a large difference in survival between years and there was no discernible effect of smolt size, body condition, age, or sex on their estuarine survival, nor any effect of salinity, dissolved oxygen and temperature.
In conclusion, estuaries represent only a small portion of the marine migration that salmon and trout undertake, but in estuaries the smolts face a new environment during their outward migration where water characteristics (salinity, temperature) change and where they encounter new predators. The present study found a total loss of 9-49% for salmon smolts and 3-27% for trout smolts during their estuarine outmigration. The battery life of acoustic tags available to use was not sufficiently long to permit the tracking of smolts during their returning upstream estuarine migrations. This could also account for additional potential loss. Estuaries represent challenging habitats in the smolts’ progression through their life cycle, possibly inflicting large losses on the stocks of these two native salmonid species.
Smolt survival in transitional water was estimated at 51-97%.
Smolts of Atlantic salmon and sea trout exhibit different survival during their estuarine migration to sea. Survival of both species was similar across three of our four study sites.
Migration speed and migratory distance are the two main factors influencing smolt survival in estuarine environments.
Acknowledgements
We are grateful to all the people involved in the data collection for this study. The study was partfunded by the European Regional Development Fund through the Interreg Channel VA Programme (SAMARCH project).
2
Mean estimated (with 95% credible intervals) survival of Atlantic salmon and sea trout smolts in relation to distance travelled (km) during estuarine seaward migration
Céline Artero
Figure
SAMARCH - shaping policy recommendations
Background
The Salmonid Management Round the Channel Project (SAMARCH 2017-2023), is part-funded through the EU’s France-England Interreg Channel Programme. The project consortium has 10 partners, five from the UK and five from France, who are a blend of research organisations, public bodies, and policy-focused NGO’s: Lead Partner: GWCT (UK), University of Exeter (UK), Bournemouth University (UK), Environment Agency (UK), WildFish Conservation (UK), Institut national de recherche pour l’agriculture, l’alimentation et l’environnement, I’Institut national d’enseignement superieur pour I’agriculture, I’alimentation et l’environnement (l’Institut Agro), Bretagne Grands Migrateurs, Office Francais De La Biodiversity and Seine-Normandie Migrateurs.
Having started in 2017, the SAMARCH project held its closing conference in Southampton on 14-15 March 2023. The project was designed to provide evidence to fill some of the knowledge gaps which are preventing the effective protection and management of salmon and sea trout smolts and adults, as they transit through estuaries on their way to sea and back to estuaries, and while sea trout are feeding in our coastal waters.
During the estuarian and coastal phases of their life cycle, salmon and sea trout are at risk from a number of human activities. Dredging of estuaries, harbour works, marine spatial planning, renewable energy schemes around the coastline and particularly gill netting by commercial fisheries could all increase mortality. Therefore, it is crucial to know aspects of fish behaviour and migration timing to help avoid losses. We need to know when smolts migrate through estuaries, how long do they take to migrate, at what time of day and state of tide? When and where do adult sea trout spend their time feeding at sea and what is their swimming behaviour, do they stay near the surface or swim deeper in the water column? All these questions are crucial, especially given the current perilous state of fish stocks, as we need to maximise the numbers that survive to return as adults to spawn in our rivers. Salmon populations are now classified as at risk (below self-sustaining populations) on most rivers in England and Wales by the Environment Agency (EA) and Natural Resources Wales. Sea trout populations have also fallen sharply in recent years. We are at a point where every fish counts.
The work aimed to inform the regulatory bodies who have responsibility for protecting salmon and sea trout to six nautical miles out to sea. The EA need better information to guide discussions on protection measures with, for example, the Inland Fisheries Conservation Authorities (IFCA’s), who have to balance the interests of commercial fisheries with conservation measures.
A huge amount of work has gone into the project over the last six years to provide detailed information and evidence, informing managers and the regulators who deal with the potential risks to smolts and adults outlined above. We have undertaken studies on the behaviour of smolts through estuaries using acoustic technology and we
have collected information on behaviour of adult sea trout at sea using novel fish tags and data modelling.
For the last 18 months the project has focused on writing up the reports and scientific papers from the project to feed information to the project partners involved in informing and guiding policy decisions. The project’s policy group has been working hard to compile a list of recommendations for changes to policy and best practice. As part of this policy development, in November 2022 we convened a workshop that included 12 organisations (outside of the project partnership), who are involved in managing salmonids in estuaries and coastal waters. We also included organisations who are not directly involved in fish conservation, but bird and mammal conservationists who struggle with comparable challenges to protect their species of interest from similar pressures.
Project results are currently being incorporated into an upgraded SAMARCH project website, which includes geospatial information system (GIS) tools, to allow a visual interpretation of the outputs – see samarch.org.uk. We invite you to take a look at the site and delve into the details of the findings; they provide a fascinating insight into the lives of sea trout and salmon through estuaries and at sea.
Building on SAMARCH results, project partners have produced a list of recommendations to improve the protection of salmon and sea trout in estuaries and coastal waters. SAMARCH data has informed several consultations with the Inshore Fisheries Conservation Authorities.
Dylan Roberts
Sarah Bayley Slater
The SAMARCH research aimed to inform the regulatory bodies who have responsibility for protecting salmon and sea trout to six nautical miles out to sea
France ( Channel Manche ) England
SAMARCH
SAlmonid MAnagement Round the CHannel
Renewable energy schemes around the coastline pose a potential risk to diadromous fish like salmon and sea trout.
The Missing Salmon Alliance (MSA) was created in 2018 and formally launched at Fishmongers Hall, London in November 2019 with an address from, the now, HM King Charles III. The MSA is a coalition of organisations working to address the decline in the population of wild Atlantic salmon in the British Isles, with wider lessons to be applied to the range of this iconic species. The founder members are Atlantic Salmon Trust, Game & Wildlife Conservation Trust, Angling Trust and Fish Legal. Fisheries Management Scotland and The Rivers Trust joined in 2021.
The Likely Suspects Framework aims to expand our understanding of what is driving salmon mortality in the individual stages of their life cycle
The MSA brings together leading salmon conservation organisations in the UK to fight to reverse the devastating collapse in wild Atlantic salmon across the country. By combining expertise, co-ordinating activities and advocating effective management solutions, we can help wild Atlantic salmon survive and thrive in our rivers and seas for the next generation. Wild Atlantic salmon are an important keystone indicator of a healthy ecosystem, with the factors that improve the population of salmon also benefiting a wide range of species. We actively co-operate and collaborate with other organisations seeking to improve such ecosystems. The MSA is a formal alliance of its members and provides a cohesive brand for the collective impacts of its members. The three key objectives are:
1. Advocating for healthy wild Atlantic salmon populations and communicating and celebrating the success of projects and interventions.
2. Communicating and engaging with individuals, businesses, NGOs and Governments to support the work of the MSA and its members, and to raise awareness and understanding of the issues affecting wild Atlantic salmon.
3. Supporting and undertaking cutting-edge research targeting the challenges facing wild Atlantic salmon throughout their life cycle, and informing the development of solutions through new projects, evidence, and advocacy.
We work with our fellow MSA members to advocate for a healthy environment for salmon to prosper, delivering world-leading research on salmon to address the controllable reasons for the decline, and communicating this work to make a difference.
The GWCT’s salmon parr tagging work on the Frome generates a huge amount of information. Our tagged salmon can be followed using our tag readers and trapping facilities to determine not only when they decide to leave the river in spring as smolts,
but also the numbers of tagged returning adults one to three years later. This information is crucial when considering the issues affecting salmon at different points in their life cycle. These detailed data, are being used by the MSA‘s leading science project – the Likely Suspects Framework (LSF).
For the next five years the LSF programme will focus on combining existing data resources with newly derived data to expand our understanding of what is driving salmon mortality in the individual stages of their life cycle, identifying where survival rates have been declining in recent years. The LSF work will deliver a decision support tool for managers to support efforts to increase the abundance of returning salmon. In time (and where possible) this level of guidance can be translated into developing more river-specific advice. The key aims include:
Developing a salmon data library as a state-of-the-art knowledge exchange hub, mobilising environmental and biological data for salmon science and management.
Developing a salmon mortality (ie. suspects) framework as a statistical tool representing mechanisms behind fluctuations in stock abundance that provides new information across the life cycle and evidential support for salmon management.
Integrating new and emerging knowledge in ways that provide interactive decisionsupport tools for salmon managers.
Catalysing strategic research into conditions that lead to salmon mortality and development of new indicators of the state of ecosystems linked to salmon survival. This will support regional-scale guidance and a greater understanding of the efficacy of existing management activities.
Key findings
The MSA was officially launched at Fishmongers Hall, London in November 2019.
The MSA’s key project is the Likely Suspects Framework. Our salmon work on the Frome is being used to feed directly into the Likely Suspects Framework project.
Currently there is a debate around gamebird releasing and foxes, in particular the suggestion that land with released gamebirds supports more foxes and that the UK fox population is larger because of releasing. The conservation issue this potentially creates is that some declining species, such as groundnesting birds, are more heavily predated by these extra foxes when breeding. This is plausible, but it remains unclear whether releasing gamebirds routinely leads to more foxes or not.
The GWCT has begun a study to explore the interplay between gamebird releasing, fox numbers and fox diet. Every three weeks throughout 2022, two surveyors recorded gamebirds, fox scats and certain other wildlife at 18 sites spread across central southern England, half with and half without gamebird releasing. The fieldwork will finish in 2023.
This project will allow us to look at relationships between gamebird releasing and activity, fox scat counts (an index of fox activity) and other wildlife, taking account of factors such as fox control effort. We will analyse fox scats to identify diet. We will be able to look at how these relationships change over at least a full calendar year. Is there more fox activity where gamebirds are released? Does this change over time or with fox control effort? Are there gamebirds on non-release sites at certain times of the year? How does fox diet change in response to releasing? Are there more raptors or hares where gamebirds are released?
At the time of writing, fieldwork is in full swing, no diet investigation has been done, and no data analysed. So, while this study has been the dominant activity of the Lowland Gamebird Research group in 2022, we will not be able to report on this work until 2024. In the meantime, it is worth setting out some of the background information we have on this key issue. Our multi-site study is mainly designed to look at spatial relationships between gamebirds and fox activity (ie. comparing sites). We do, however, already have some national datasets which enable us to look at associations between released gamebirds and fox populations over time. If foxes are heavily reliant on gamebirds, we might expect to see an association, ie. a similar national trend in recent decades.
The data we have shows that while gamebird releasing indices have increased steadily in recent decades, the UK fox index has not
We are very grateful to the 18 estates involved in our current study. Also to BASC who made a substantial donation which made the study possible. Acknowledgements
Figure 1A
Pheasant release index from GWCT’s National Gamebag Census
All graphs show annual UK indices compared to a baseline year (1961 for A, C and D, 1995 for B) with 95% confidence intervals, up until covid. NGC = GWCT National Gamebag Census, BBS = mammal data from BTO Breeding Bird Survey
The NGC also contains information on levels of fox culling (numbers killed per unit area). Again, commentators have suggested that releasing gamebirds (partridges in particular) has been the key driver for increased fox culling, because there are more foxes to cull. It could also mean more or better fox control effort but, in any case, comparing graph D with A and C in Figure 1 indicates a more complex picture. In the 1970s and 1980s, pheasant releasing showed a moderate rate of increase while partridge releasing remained a very minor rural activity (see Figure 1 C). Over the same period there was a steep rise in fox culling (see Figure 1 D). But when partridge releasing began to increase substantially in the early 1990s alongside a continued increase in pheasant releasing, the fox culling index, as measured by the NGC, started to level off.
The lack of associations over time, especially with the BBS data, are not the whole story but they provide evidence that releasing is not having an overall positive effect on fox abundance in the UK. These comparisons do not provide an insight into local or regional effects, but they suggest at least that the relationships we are interested in will be more complicated than is currently widely assumed. This is what our current field study aims to investigate.
Figure 1C
Red-legged partridge release index from GWCT’s National Gamebag Census
Figure 1D
Fox cull index from GWCT’s National Gamebag Census
Key findings
It is often assumed gamebird releasing means more foxes and more predation of vulnerable wildlife.
The data we have shows that while gamebird releasing indices have increased steadily in recent decades, the UK fox index has not.
A major new GWCT study is underway which will tell us more about gamebird releasing, fox control and the effect on foxes.
Rufus Sage
Maureen Woodburn
Jenny Coomes
Joseph Werling
Katie Holmes
Feral goat numbers at Nant Gwrtheyrn
Background
Feral goats are regarded as being of cultural and intrinsic interest in North Wales. Goats (and cattle) have been seen historically as much more important than sheep in terms of food (their meat and milk), skins and the highly prized translucent tallow (fat), which was used to make candles. Their past contribution to agricultural development and their legacy on the landscape in North Wales is indicated by the many features named after goats such as Ceunant Geifr and Llyn Gafr (‘Gafr’ – Welsh for Goat, ‘Geifr’ – Goats).
Several populations of goats can be found in North Wales, one of which is in Nant Gwrtheyrn. The secluded, previously quarrying, village of Nant Gwrtheyrn is now a Welsh Language and Heritage Centre, located near the village of Llithfaen on the northern coast of Gwynedd, in north-west Wales within the Llŷn Area of Outstanding Natural Beauty. The goat population at Nant Gwrtheyrn stretches along the coast to Trefor (east from Nant), Pistyll (west from Nant) and inland to Llithfaen, an approximate area of 1,309 hectares. The mountainous range and woodlands dotted along the side of the hills, the sandy beach, as well as the disused quarry and quiet Welsh villages offer the goats a variety of browsing possibilities and shelter for their young. The area included in the study encompassed three Sites of Special Scientific Interest (SSSI): SSSI Yr Eifl, SSSI Gallt y Bwlch and SSSI Carreg y Llam.
Concerns were raised that the goat population had increased and become bolder during the Covid-19 lockdown period in 2021. Browsing impacts had been observed on new tree planting and there was increased browsing activity around the village centre. The goats in the area are a unique group as they have been isolated (due to the secluded nature of the village) for a long period of time. Historic goat population counts had been conducted by Natural Resources Wales in 2010, 2011 and 2015 and formed our baseline data.
We were able to conduct a total of 13 counts. These counts varied from a single person count to a community count by six volunteers. We were also able to use our drone (which includes a thermal camera) for counting, which made counting easier, avoiding walking along the rugged terrain to find the animals. We counted an average of 95.2 goats per count, a notable increase from counts undertaken in the 2010s (see Figure 1).
Gwrtheyrn in 2010, 2011, 2015 and 2021-2022
Figure 1
Feral goat counts at Nant
In June 2021 we deployed 10 trail cameras, located in areas where the goat population was known to roam. The cameras were continuously deployed until 15 February 2022. On collection of memory cards, animals were tagged in each image. As well as goats, images included badgers, foxes, squirrels, mice and birds (including a nightjar, an amber-listed species for which very few records exist in the area). We used the images to study daily activity patterns and locations frequented by the goats.
We worked with Liverpool John Moores University to look at ways of using artificial intelligence (AI) to interpret trail camera data. We trained their ‘ConservationAI’ software with approximately 2,000 images where we had manually identified species to enable automatic classification of images based on individual species characteristics. All the photos taken between August 2021 and February 2022 were categorised to species and the counts of goat and sheep encounters summed. To ensure independence between detections, we removed photos taken within a 10-minute period and, because camera deployment spanned summer months, all encounters were corrected to Greenwich Mean Time. Daily activity by goats and sheep was appreciably higher during daylight hours, with a peak for both animals around 09.00 and a second peak for sheep around 17.00 (see Figure 2). Total detections per camera trap varied from 45 to 410.
Impact assessments were undertaken when the camera traps were deployed and every time they were checked. This entailed noting several browsing indicators which accumulatively show the level of impact on a woodland. We found considerable damage in replanted areas and SSSI woodlands. It is evident that the feral goats are causing some damage to regeneration, but sheep are also a contributing factor. However, the camera studies show higher incidence of goats in the woodlands and, by implication, greater damage from goats. Potential total economic loss due to damage caused by goats was estimated at £51,000.
Figure 2
Daily activity of goats and sheep at Nant Gwrtheyrn determined from trail camera images. The shaded area indicates periods when both goats and sheep were active
Key findings
Counts show an increasing trend in feral goat numbers in Nant Gwrtheyrn from 2010-2022.
Camera trap footage showed peak goat activity around 09.00, whereas sheep activity peaked around 09.00 and 17.00. The overall health of the goat population was very good. We observed impacts through browsing on multiple plant and tree species. Potential total loss due to damage caused by goats was estimated at £51,000. There is scope for further work on genetics and population age structure.
Woodcock monitoring Examination of annual variation in Chris Heward, Andrew Hoodless, Shooting Times 2003- ongoing (see p16) breeding woodcock abundance collaboration with BTO Woodcock Club
Woodcock survival and Intensive ringing and recapture of woodcock Andrew Hoodless, Chris Heward, Core funds 2012- ongoing site fidelity at three winter sites collaboration with the Woodcock Network
Woodcock migration and Use of GPS tags to understand autumn migration Andrew Hoodless, Chris Heward, Shooting Times Woodcock Club, 2017-2022 breeding site habitat use and breeding site habitat use collaboration with ONCFS private donors, Woodcock Appeal
Lapwing on the South Downs Monitoring of lapwing breeding success on Lizzie Grayshon, Andrew Hoodless, collaboration Core funds 2018-2022 the South Downs with RSPB and South Downs National Park
Use of Special Protection GPS tracking of oystercatchers and curlews Ryan Burrell, Andrew Hoodless, collaboration NE 2018-2022 Area habitats by waders on the Exe Estuary with NE and University of Exeter
Winter movements Comparison of lapwings breeding in Scotland and Andrew Hoodless, Dave Parish, Marlies EU LIFE, Associated British 2019-2023 of lapwings southern England using GPS tracking Nicolai, Lizzie Grayshon, Ryan Burrell Ports, Core funds, Elmley NNR
Breeding redshank in the Examining habitat use and breeding success of Lizzie Grayshon, Clive Bealey Hampshire Ornithological 2021-2023 Avon Valley redshank in the Avon Valley using GPS tracking Society and colour-ringing
Avon Valley Farmer Cluster Farmer-led habitat restoration and wader recovery Lizzie Grayshon NE Facilitation Fund, 2020-2022 in the Avon Valley Core funds
GWCT/BTO Breeding Large-scale assessment of UK’s resident woodcock Chris Heward, Andrew Hoodless, Shooting Times Woodcock Club, 2022-2024 Woodcock Survey 2023 population’s size and trend collaboration with BTO BASC, private donors, core funds John Swire 1989 Charitable Trust
Year-round habitat use of Assessing breeding success, broadscale winter habitat- Chris Heward, Andrew Hoodless, Abbeystead Estate, private donors 2022-2024 British breeding curlew -use and migration strategy of curlew breeding in collaboration with David Scott (see p18) Northern England using GPS-GSM tags
Headstarting curlew in Assessing the viability of headstarting as a means Andrew Hoodless, Chris Heward Norfolk Estate 2022-2027 southern England of establishing breeding curlew populations
PhD: Woodcock in Ireland Breeding woodcock distribution and habitat James O’Neill. Supervisors: Andrew Hoodless, Irish Research Council, NARGC, 2019-2022 relationships. Effect of shooting on winter woodcock Prof John Quinn (UCC) NPWS, Core funds behaviour and mortality rate
PhD: Role of camouflage in Influence of nest and chick crypsis on lapwing George Hancock. Supervisors: Andrew Hoodless, NERC 2019-2023 the survival and conservation breeding success and possible modifications to Dr Jolyon Troscianto, Dr Martin Stevens of ground-nesting birds field and sward management (University of Exeter), Dr Innes Cuthill (University of Bristol)
PhD: Landscapes for curlews Monitoring breeding success and use of GPS tracking Elli Rivers. Supervisors: Andrew Hoodless, Hampshire Ornithological 2020-2023 to determine foraging areas of adult curlews and Mike Short, Prof Richard Stillman, Society, Forestry England brood ranges Dr Kathy Hodder (BU), Andy Page (FE) private donors
PhD: Lapwings and Quantifying lapwing chick survival in arable habitats Ryan Burrell. Supervisors: Andrew Hoodless, Core funds 2020-2023 avian predators and the effects of disturbance by corvids and raptors Prof Richard Stillman, Dr Kathy Hodder (BU)
PARTRIDGE AND BIOMETRICS RESEARCH IN 2022
Project title Description
Staff
Funding source
Partridge Count Scheme Nationwide monitoring of grey and red-legged Neville Kingdon, Nicholas Aebischer, Julie Core funds, GCUSA
Date
1933- ongoing (see p20) partridge abundance and breeding success Ewald, Piera Coleman, Rosa Hicks, Josh Deakins, Robert Turner, Bradley Blyther, Sabeeth Shoeb
National Gamebag Census Monitoring game and predator numbers with Nicholas Aebischer, Corinne Duggins, Julie Ewald, Core funds
1961- ongoing (see p30) annual bag records Cameron Hubbard, Bradley Blyther, Josh Deakins, Piera Coleman, Rosa Hicks, Robert Turner
Sussex Study
Long-term monitoring of partridges, weeds, invertebrates, Julie Ewald, Nicholas Aebischer, Steve Core funds, Ernest Kleinwort
1968- ongoing pesticides and land use on the South Downs in Sussex Moreby, Cameron Hubbard Charitable Trust
Wildlife monitoring at Monitoring of land use, game and songbirds for Francis Buner, Cameron Hubbard, Core funds, Interreg 2010-2023 Rotherfield Park the Rotherfield Demonstration & NSR PARTRIDGE Amelia Corvin-Czarnodolski, Beth Brown (EU North Sea Region)
Grey partridge Researching and demonstrating grey partridge Dave Parish, Hugo Straker, Fiona Whitburgh Farms, Core funds 2011-2021 management management at Whitburgh Farms Torrance, Holly Owen, Tanith Jones, Rebecca Mills, Rhiannon Wooldridge
Cluster Farm mapping
Generating cluster-scale landscape maps for use Julie Ewald, Neville Kingdon, Cameron Core funds 2014- ongoing by the Advisory Service and the Farm Clusters Hubbard, Josh Deakins, Piera Coleman, Rosa Hicks
Developing novel game crops Developing perennial game cover mixes Dave Parish, Fiona Torrance, Hugo Straker, Balgonie Estates Ltd, Core funds, 2014-2022 Holly Owen, Tanith Jones, Rebecca Mills, Kingdom Farming, Kings Crops Rhiannon Wooldridge Scottish Agronomy
Grey partridge recovery Monitoring grey partridge recovery at Balgonie Dave Parish, Hugo Straker, Fiona Torrance, Balgonie Estates Ltd, Core funds, 2014-2022 Estate and impacts on associated wildlife Holly Owen, Tanith Jones, Rebecca Mills, Kingdom Farming, Kings Crops Rhiannon Wooldridge Scottish Agronomy
PARTRIDGE Co-ordinated demonstration of management for Francis Buner, Fiona Torrance, Julie Ewald, Dave Interreg (EU North Sea Region) 2016-2023 (see p22) partridge recovery and farmland biodiversity in the UK, Parish, Paul Stephens, Ben Stephens, Corinne Core funds the Netherlands, Belgium, Germany and Denmark Duggins, Ellie Raynor, Amelia CorvinCzarnodolski, Beth Brown, Holly Owen, Tanith Jones, Rebecca Mills, Rhiannon Wooldridge Cameron Hubbard, John Szczur, Chris Stoate, Roger Draycott, Francesca Pella, Nicholas Aebischer
Recovery of grey partridge Encouraging grey partridge management and Dave Parish, Fiona Torrance
Core funds 2017- ongoing populations in Scotland monitoring across Scotland
Lowland Gamebird Compare land holdings with released gamebird Neville Kingdon, Cameron Hubbard, The Wates Family Charities 2019-2022 Impact Study shooting to geographically matched land holdings Josh Deakins without such management
PepsiCo Arable Demonstrates how arable farming can support Louise de Raad, Dave Parish, Fiona PepsiCo PAO fund, core funds, 2022-2024 Biodiversity Project the environment by implementing measures to improve Torrance, Ross Macleod Scottish Agronomy, Balgonie the quality of available semi-natural habitats to benefit Estates Ltd, Kingdom Farming biodiversity and by adjusting agricultural practices to increase cost-effective, nature-friendly productivity
PhD: Biodiversity footprint Creating an index of crop-farming traits to assess Helen Waters. Supervisors: Julie Ewald, NERC/GWCT 2019- ongoing of foods the biodiversity footprint of foods Alfred Gathorne-Hardy (University of Edinburgh), Barbara Smith (Coventry University)
UPLANDS RESEARCH IN 2022
Project title Description Staff
Funding source Date
Grouse count scheme Annual grouse and parasitic worm counts in relation David Baines, Philip Warren, Core funds, Gunnerside Estate 1980- ongoing to moorland management indices and biodiversity Kathy Fletcher
Black grouse monitoring Annual lek counts and brood counts Philip Warren, David Baines, Core funds, Natural England 1989- ongoing Kathy Fletcher
Capercaillie brood surveys Surveys of capercaillie and their broods in David Baines, Kathy Fletcher, Cairngorms National 1991- ongoing Scottish forests Phil Warren Park Authority, Seafield Estates
Heather burning on peatland Vegetation and hydrological responses to Sian Whitehead
Core funds 2018-2027 burning on peatland
Development of long-term Are burning and cutting useful management tools Sian Whitehead, Leah Cloonan
2019-2028 heather burning experiments for blanket bog restoration? Does the structure on blanket peat and composition of pre-burn vegetation influence post-burn vegetation recovery?
Rush management for Experimental rush cutting to improve habitat David Baines, Sian Whitehead
breeding waders for breeding lapwing
How many curlew breed in Habitat based randomized survey of breeding David Baines, Phil Warren, Cotherstone & Raby Estates 2020-2022 Upper Teesdale? curlew to provide a population estimate
Black grouse and Winter surveys and lek counts in relation to public Philip Warren, Angus Smith
England 2020-2022 human disturbance access restrictions imposed following CROW Act 2005
Cranefly monitoring Pilot study to test methods of quantifying cranefly David Baines, Leah Cloonan
emergence periods on peatland habitats
Meadow pipits Standardised permanent transects to consider David Baines
annual variations in pipit abundance and defining optimal diurnal survey periods
Merlin (Magic) Testing proposed hypotheses of merlin decline on David Baines, Philip Warren, Defra Green Recovery
Recovery Project (see 36) grouse moors in northern England Georgia Isted, Matthew Henderson Challenge Fund through HLF
Long-term heather Vegetation recovery and brash decomposition rates Sian Whitehead
2021-2023
2021-2030 cutting experiments following heather cutting at different heights and (see p34) over different peat depths
Recovery of heather post- Experimental cutting and burning to aid heather Sian Whitehead, David Baines
2021-2030 beetle outbreak recovery after heather beetle attacks
Predators of wader clutches Camera traps to detect specific predators of David Baines, Angus Smith
2022-2023 wader clutches in the North Pennines
Maternal condition in Roles of food quality, parasites and weather in David Baines, Leah Cloonan
2022-2025 red grouse (see p38) influencing pre-breeding hen condition
FARMLAND RESEARCH IN 2022
Project title
Description
Staff
Chick-food and A comparison of grey partridge chick-food in conven- Steve Moreby, Niamh McHugh, Jayna Private funds
2015- ongoing farming systems tional and organically farmed crops and habitats Connelly, Ellie Ness, Ruby Woollard, Seshi Humphrey-Ackumey, Madeleine Baker, Madeline Kettlewell
Chick-food invertebrate levels Chick-food invertebrate levels in crops and Niamh McHugh, Steve Moreby, Ruby Private funds, 2017- ongoing non-crop habitats on three estates Woollard, Seshi Humphrey-Ackumey The Millichope Foundation
Acoustic detectors for Evaluation of acoustic detectors for Niamh McHugh, Chris Heward, Core funds 2018-2022 monitoring woodcock monitoring woodcock BEESPOKE Increasing the area of pollinator habitat John Holland, Lucy Capstick, Niamh McHugh, EU Interreg North Sea Region 2019-2023 (see p46) and pollination Jayna Connelly, Ruby Woollard, Seshi Humphrey-Ackumey, Madeleine Baker, Madeline Kettlewell
Bat monitoring in Devon Identification of bat species on a Niamh McHugh, Ellie Ness Private funds
2020- ongoing Devon demonstration farm
The Owl Box Initiative Barn owl conservation, research and Niamh McHugh, Chris Heward, Green Recovery 2020-2022 engagement project Jodie Case, Ellie Ness Challenge Fund
FRAMEwork Evaluation and development of Farmer Cluster Niamh McHugh, Ellie Ness, Rachel Nichols, EU Horizon 2020 2020-2025 approach across Europe
Ruby Woollard, Seshi Humphrey-Ackumey
Farmland birds and Comparison of farmland bird abundance relative Niamh McHugh, Ellie Ness, Private funds 2020- ongoing farming systems to conventional and organically farmed crops and Madeline Kettlewell agri-environment habitats
H3 Healthy soils, healthy food, Ecological evaluation of Regenerative Agriculture Niamh McHugh, Lucy Capstick, Ellie Ness, UKRI (Subcontract) 2021-2025 healthy people Ruby Woollard, Seshi Humphrey-Ackumey Cambridge University
PhD: Solitary bees Seed mixes for solitary bees
ALLERTON PROJECT RESEARCH IN 2022
Project title Description
Rachel Nichols. Supervisors: John Holland, NERC/GWCT 2018-2023 Prof Dave Goulson (University of Sussex)
Staff
Funding source Date
Monitoring wildlife at Annual monitoring of game species, songbirds, Chris Stoate, John Szczur, Alastair Leake, Allerton Project funds 1992- ongoing Loddington (see p48) invertebrates, plants and habitat Steve Moreby, John Holland
Effect of game management Effect of ceasing predator control and winter feeding Chris Stoate, Alastair Leake, Allerton Project funds 2001- ongoing at Loddington on nesting success and breeding numbers of songbirds John Szczur
Water Friendly Farming A landscape-scale experiment testing integration Chris Stoate, John Szczur, Jeremy EA, Regional Flood and 2011-2027 of resource protection and flood risk management Biggs, Penny Williams, (Freshwater Coastal Committee with farming in the upper Welland Habitats Trust), Professor Colin Brown (University of York)
Soil monitoring Survey of soil biological, physical and Chris Stoate, Jenny Bussell, Alastair Allerton Project 2014- ongoing chemical properties Leake, Gemma Fox
Conservation Agriculture Economic and environmental impacts of three Alastair Leake, Joe Stanley, Chris Stoate, Syngenta 2017- ongoing (see p56) contrasting crop production approaches Jenny Bussell, Gemma Fox, John Szczur, Oliver Carrick
Agroforestry
SARIC
Farming with Nature
Optimising tree densities to meet multiple Chris Stoate, Jenny Bussell, Gemma Fox, Woodland Trust 2018- ongoing objectives in grazed pasture Alastair Leake, John Szczur, Joe Stanley
Restoring soil quality through the re-integration of Alastair Leake, Oliver Carrick, BBSRC & UKRI 2018-2022 leys and sheep into arable rotations plus multiple external stakeholders
Promoting sustainable farming practice & Saya Harvey, Jemma Clifford, Joe Stanley Marks & Spencer 2019- ongoing Integrated Pest Management Alice Midmer
Tree leaves as Assessing the nutritional value of tree leaves Chris Stoate, Jenny Bussell, Gemma Fox, Woodland Trust 2019-2022 ruminant fodder for ruminants Nigel Kendall (Nottingham University)
Monitoring soil health under Comparing soil biological activity and organic Jenny Bussell, Gemma Fox, McCains/McDonalds 2021-2022 potato production matter under different treatments Alastair Leake
Hedgerow Carbon Code
Creating a matrix for hedge carbon management Alastair Leake, Alice Midmer, Nieves Defra/Natural England 2021-2022 & associated carbon credit trades Lovatt, Julie Ewald, Cameron Hubbard
AgriCapture C02 Promoting regenerative agricultural practice & use Alastair Leake, Joe Stanley, EU Horizon 2020 2021-2023 of farm carbon credits across Europe Jemma Clifford
Landscape use by bats Examining agricultural landscape use by barbastelle Chris Stoate, Niamh McHugh, Nathalie Cossa, Linder Foundation 2022 and other bats between SSSI woods at Loddington Leicestershire & Rutland Wildlife Trust
Soil Biology and Soil Health Investigating the impacts of long-term direct-drill Jenny Bussell, Gemma Fox Kildare 2022-2023 (see p54) on the microbial community and carbon storage
Eye Brook Farmer Cluster Identifying synergies between environmental and Chris Stoate, Joe Stanley, Olly Carrick RPA 2022-2025 farm business objectives at the landscape scale
ClieNFarms Working with Nestlé to help wheat farmers move Alastair Leake, Joe Stanley, Alice EU Horizon 2020 2022-2025 toward carbon neutrality in the east of England Midmer, Nieves Lovatt
AUCHNERRAN PROJECT RESEARCH IN 2022
Project title Description Staff
Funding source Date
General biodiversity Monitoring of key taxa including red squirrels, Dave Parish, Marlies Nicolai, Max Wright, Core funds 2015-2022 monitoring (see p58) raptors, soil invertebrates and bumblebees Gemma Morgan, Amy Cooke
Rabbit population monitoring Assessing rabbit numbers in relation to Marlies Nicolai, Max Wright, Core funds
2016- ongoing control methods Gemma Morgan, Amy Cooke
GWSDF Cromar Developing the Cromar Farmer Cluster Dave Parish, Marlies Nicolai, Core funds, 2016-2022 Farmer Cluster Ross MacLeod, Louise de Raad Working for Waders
Mud snail and liver Investigating the importance of intermediate/ Dave Parish, Marlies Nicolai Core funds, Moredun 2017-2002 fluke interactions alternative fluke hosts and land-use Research Institute
Wader population monitoring Surveying of wader numbers, distribution Dave Parish, Marlies Nicolai, Core funds, 2017- ongoing and productivity in relation to farm Andrew Hoodless, Elizabeth Ogilvie, Working for Waders management practices Max Wright
Farmland breeding bird counts Assessing population trends of farmland birds Marlies Nicolai, Max Wright, Core funds
2017- ongoing Gemma Morgan, Amy Cooke
Woodcock surveys Assessing woodcock resident and Marlies Nicolai, Max Wright, Core funds
2017- ongoing migratory population trends Gemma Morgan, Amy Cooke
Gamebird and hare Assessing pheasant, red legged partridges Marlies Nicolai, Max Wright, Core funds
2017 - ongoing flush counts and hare numbers Gemma Morgan, Amy Cooke
Carbon and natural
Undertaking and assessing the applicability Ross Macleod, Louise de Raad
Core funds, CNPA Horizon 2021- ongoing capital assessments of assessments 2020 funding
The impact of egg predators Quantifying the impact of different predator Dave Parish, Marlies Nicolai, Max Wright, Core funds, Working 2021- ongoing on waders (see p62) species on wader productivity Gemma Morgan, Amy Cooke for Waders
Winter food for snipe
By digging in hay bales and covering them with Louise de Raad, Max Wright, Core funds 2022- ongoing and woodcock rabbit/deer gralloch we encourage winter food Gemma Morgan, Amy Cooke even in freezing conditions
Songbird feeders Providing two different songbird mixes across the farm Louise de Raad, Max Wright, Core funds 2022- ongoing to enhance winter survival and breeding condition Gemma Morgan, Amy Cooke
Soil sampling Investigating soil condition in advance of new Louise de Raad, Dyfan Jenkins Core funds, CNPA 2022- ongoing grassland management techniques Horizon 2020
PREDATION RESEARCH IN 2022
Project title
Use of ink-tracking tunnels by small Revision of scientific write-up following peer review Mike Short, Tom Porteus Core funds 2015-2023 mustelids in a river meadow habitat
Foxes in the Avon Valley Analysis of GPS tracking data and DNA evidence Mike Short, Tom Porteus, Core funds, private funds 2015-2024 to determine resident density, activity patterns and Jodie Case habitat use of foxes in the Avon Valley, in the context of declining wading bird populations
Diet of foxes in the Avon Analysis of stomach and faecal analysis to Mike Short, Jodie Case Core funds
2021-2023 Valley and New Forest determine main dietary components supporting Nathan Williams (see p66) foxes in areas where wading birds breed
Wader nest monitoring in Use of trail cameras to monitor nesting success of Mike Short, Elli Rivers (Bournemouth
Core funds, private funds 2021- ongoing the New Forest National Park waders of conservation concern including coastal species University PhD student)
How effective is fox control? Collection and analysis of fox culling records from Mike Short, Jodie Case, Tom Porteus Core funds
2021- ongoing multiple sites managed for breeding waders
Development of nest protection Field evaluation of nest-cages to protect ringed plover Mike Short
Core funds, Natural England, 2022-2025 cages for wading birds and oystercatcher breeding on coastal sites private funds
PhD: Why are there so How the large-scale spatial population dynamics of Nathan Williams Supervisors: Mike Short, Core funds, private funds 2021-2024 many foxes? (see p64) the red fox, may determine the local fate of wading Tom Porteus, Andrew Hoodless, Emilie Hard- NERC birds breeding in the Avon Valley and New Forest ouin, Demetra Andreou, Richard Stillman
FISHERIES RESEARCH IN 2022
Project title Description Staff
Funding source Date
Salmonid life-history strategies Understanding the population declines in salmon Rasmus Lauridsen, Dylan Roberts, William Core funds, EA, Cefas, 2009- ongoing in freshwater (see p68) and sea trout Beaumont, Luke Scott, Sophie Elliot, Mr A Daniell, Winton Capital, Thomas Lecointre, Jonathan Gilson (Cefas) The Missing Salmon Alliance
Grayling ecology Long-term study of the ecology of River Luke Scott, William Beaumont, Thomas Core funds, Grayling 2009- ongoing Wylye grayling Lecointre, Richard Cove (GRT), Robert Research Trust, Piscatorial Society Wellard (PS), Jessica Marsh (consultant)
Headwaters and salmonids Contribution of headwaters to migratory salmonid Rasmus Lauridsen, William Beaumont, Core funds, Cefas, Defra, 2015-2023 populations and the impacts of extreme events Luke Scott, Dylan Roberts, Sophie Elliott The Missing Salmon Alliance Thomas Lecointre, Jonathan Gilson (Cefas)
Salmon and trout Movements and survival of salmon and sea trout Céline Artero, Rasmus Lauridsen, Luke Scott, EU Interreg 2017-2023 smolt tracking smolts through four estuaries in the English Dylan Roberts, William Beaumont, Thomas The Missing Salmon Alliance (see p70) Channel as part of the SAMARCH project Lecointre, Stephen Gregory (Cefas), Elodie Reveillac (Agrocampus Ouest)
Sea trout kelt tracking Movements and survival of sea trout kelts at sea Céline Artero, Rasmus Lauridsen, William EU Interreg Channel Programme 2017-2023 from three rivers in the English Channel as part of Beaumont, Luke Scott, Dylan Roberts, The Missing Salmon Alliance the SAMARCH project Will Beaumont, Thomas Lecointre, Elodie Reveillac (Agrocampus Ouest)
Genetic tools for Creation of a genetic database for trout in the Jamie Stevens, Andy King (Exeter University), EU Interreg Channel Programme 2017-2023 trout management Channel rivers (ca. 100 rivers) and a tool for Sophie Launey (INRA), Dylan Roberts, The Missing Salmon Alliance identifying areas at sea important for sea trout Rasmus Lauridsen, Thomas Lecointre,
New and improved salmon stock Providing new information for stock assessment Stephen Gregory (Cefas), Marie Nevoux (INRA), EU Interreg Channel Programme 2017-2023 assessment tools models and new stock assessment tools in England Etienne Rivot (Agrocampus Ouest), The Missing Salmon Alliance and France as part of the SAMARCH project Rasmus Lauridsen
New policies for salmon and Developing new policies for the better management of Sarah Bayley Slater, Dylan Roberts, Cameron EU Interreg Channel Programme 2017-2023 sea trout in coastal and salmon and sea trout in coastal and transitional waters Hubbard, Lawrence Talks, Simon Toms, Phil The Missing Salmon Alliance transitional waters (see p72) based on the outputs of SAMARCH Rippon (EA), John Hickey, Janina Gray (Widlfish Conservation) Pink salmon Use new eDNA methods to determine distribution of Rasmus Lauridsen, Gordon Copp, Cefas, The Missing 2019-2022 non-native pink salmon in the UK and to use stable Phil Davidson (Cefas), Michał Skóra, Salmon Alliance isotopes to study the ecosystem effect of pink salmon Iwan Jones (QMUL) where present
PhD: Trout metal tolerance Disentangling the three main factors affecting trout Daniel Osmond. Supervisors: Rasmus GW4 FRESH CDT, Core funds 2019-2023 ability to tolerate metals: evolution, local adaption Lauridsen, Jamie Stephens (Exeter and pollution University), Mike Bruford (Cardiff University), Bruce Stockley (WRT)
LOWLAND GAME RESEARCH IN 2022
Project title Description Staff Funding source Date
Lowland gamebird The effect of different releasing and wild game manag- Roger Draycott, Maureen Woodburn, Core funds 1996- ongoing population studies ement strategies on winter survival and breeding Rufus Sage
Releasing comms programme Build evidence base for future reviews of Rufus Sage, Jenny Coomes, Core funds 2020- ongoing effects of releasing Maureen Woodburn
Game crops and breeding birds Gamecrops on grassland in Exmoor area and Rufus Sage, Maureen Woodburn, Greater Exmoor Shoot Association 2021-2023 hedgerow breeding birds Sam McCready, Jenny Coomes
Releasing gamebirds and foxes Field-based study of fox abundance and diet in Jenny Coomes, Maureen Woodburn, Rufus BASC 2021-2023 (see p76) relation to releasing gamebirds and predator control Sage, Joseph Werling, Katie Holmes
Released gamebird dispersal Documenting movement and dispersal of Rufus Sage, Maureen Woodburn, Jenny BASC 2021-2023 released gamebirds Coomes, Joseph Werling, Katie Holmes
Invertebrates and New review paper of effect of releasing Rufus Sage Core funds, NE 2022-2023 releasing gamebirds on invertebrates
Enhanced pheasants Documenting release success for pheasants Maureen Woodburn Core funds 2022- ongoing enhanced in rearing system
Key to abbreviations: BASC = British Association for Shooting and Conservation; BASF = Badische Anilin und Soda Fabrik; BBSRC = Biotechnology and Biological Sciences Research Council; BEESPOKE = Benefiting Ecosystems through Evaluation of food Supplies for Pollination to Open up Knowledge for End users; BTO = British Trust for Ornithology; BU = Bournemouth University; CEFAS = Centre for Environment, Fisheries & Aquaculture Science; CNPA = Cairngorms National Park Authority; EA = Environment Agency; EU = European Union; FE = Forestry England; FRAMEwork = Farmer clusters for Realising Agrobiodiversity Management across Ecosystems; GCUSA = Game Conservancy USA; GRT = Grayling Research Trust; GWSDF = Game & Wildlife Scottish Demonstration Farm; H2020 = Horizon 20:20; HLF = Heritage Lottery Fund; INRA = Institut National de la Recherche Agronomique; Interreg = European Regional Development Board; LIFE = L'Instrument Financier pour l'Environnement; NARGC = National Association of Regional Game Councils; NPWS = National Parks and Wildlife Service; NE = Natural England; NERC = Natural Environment Research Council; NSR PARTRIDGE = North Sea Region Protecting the Area’s Resources Through Researched Innovative Demonstration of Good Examples; PS = Piscatorial Society; QMUL = Queen Mary University of London; RPA = Rural Payments Agency; SAMARCH = SAlmonid MAnagement Round the CHannel; SARIC = Sustainable Agriculture Research and Innovation Club; SSSI = Sites of Special Scientific Interest; UCC = University College Cork; UKRI = UK Research Innovations; WRT = Westcountry Rivers Trust.
GWCT scientific publications 2022
Aebischer, NJ & Burrell, R (2022) Grey Partridge Perdix perdix, Galliformes, Phasianidae. In Conservation and Management of Game Birds in Europe: Species of Annex II/A of the Birds Directive (eds T. Powolny & A. Czajkowski), pp. 61-74. OMPO Publication, Paris.
Aghababyan, K, Aebischer, NJ & Baloyan, S (2022) The current status of Chukar (Alectoris chukar J. E. Gray, 1830) in Armenia. Ornis Hungarica, 30: 80-96.
Begg, GS, McHugh, NM, Hager, G, Moonen, C, Cantu Salazar, L, Engel, S, Rugani, B, Simmons, AJ, Keillor, B, Tran, F & Holland, JM (2022) FRAMEwork: a system-wide approach to biodiversity sensitive farming in Europe. Landscape Management for Functional Biodiversity IOBC wprs Bulletin, 156: 61-65.
Beka, S, Burgess, PJ, Corstanje, R & Stoate, C (2022) Spatial modelling approach and accounting method affects soil carbon estimates and derived farm-scale carbon payments. Science of the Total Environment, 827(154164): 1-12.
Bull, CD, Gregory, SD, Rivot, E, Sheehan, TF, Ensing, D, Woodward, G & Crozier, WW (2022) The Likely Suspects Framework: the need for a life cycle approach for managing Atlantic salmon (Salmo salar) stocks across scales. ICES Journal of Marine Science, 79: 1445-1456.
Holland, JM, Albach, D, Bijkerk, J, Capstick, LA, Fountain, MT, Fraser, I, Holthusen, J, Jensen, J, Fabricius Kristiansen, L, Kroodsma, H, van Kruyssen, J-W, Mathiasen, H, Meeus, I, Sigsgaard, L, Strijkstra, A, Stubbe, F, van Loo, T & Wibe, A (2022) The BEESPOKE project: increasing wild-pollinators and
Holmes, K & Whitehead, S (2022) Immediate effects of heather cutting over blanket bog on depth and microtopography of the moss layer. Mires and Peat, 28(25): 1-11.
Hoodless, AN (2022) Jack snipe Lymnocryptes minimus, Charadriiformes, Scolopacidae. In Conservation and Management of Game Birds in Europe: Species of Annex II/A of the Birds Directive (eds T. Powolny & A. Czajkowski), pp. 349-360. OMPO Publication, Paris.
Kortland, K, de Raad, AL, Lurz, PWW, White, A & Slade, A (2022) Red squirrels and forestry – is it time for a review of policy and practice? Scottish Forestry, 76: 32-35.
Marsh, JE, Jones, JI, Lauridsen, RB, Grace, JB & Kratina, P (2022) Direct and indirect influences of macrophyte cover on abundance and growth of juvenile Atlantic salmon. Freshwater Biology, 67: 1861-1872.
Marsh, JE, Cove, RJ, Britton, JR, Wellard, RG, Basic T & Gregory, SD (2022) Density-dependence and environmental variability have stage-specific influences on European grayling growth. Oecologia, 199: 103-117.
McHugh, NM, Ness, E, Holland, JM, Buckerfield, C, Friedel, J, Salehi, A, Starz, W, Ablinger, D, Veromann, E, Kaasik, R, Sánchez, C, Varas, C, Lʼhote, P, Frank, P, Warlop, F, Bagnoni, V, Marini, S, Moonen, C, Beyer, M, Martin, Y, Vray, S, van Rijn, P, Duijvestijn, L, Bohnet, I, Travnicek, J, Janecková, K, Banks, G, Simmons, AJ & Begg, G (2022) Farmer Clusters: a FRAMEwork for connecting conservation measures in agricultural landscapes. Landscape Management for Functional Biodiversity IOBC wprs Bulletin, 156: 66-70.
McHugh, M, Bown, BL, McVeigh, A, Powell, R, Swan, E, Szczur, J, Wilson, P & Holland, JM (2022) The value of two agri-environment scheme habitats for pollinators: annually cultivated and floristically enhanced grass margins. Agriculture, Ecosystems & Environment, 326(107773): 1-9.
McHugh, NM, White, PJC, Moreby, SJ, Szczur, J, Stoate, C, Leather, SR & Holland, JM (2022) Linking agri-environment schemes habitat area, predation and the abundance of chick invertebrate prey to the nesting success of a declining farmland bird. Ecological Solutions and Evidence, 3(e12155): 1-12.
Morten, JM, Burrell, RA, Frayling, TD, Hoodless, AN, Thurston, W & Hawkes, LA (2022) Variety in responses of wintering oystercatchers Haematopus ostralegus to near-collapse of their prey in the Exe Estuary, UK. Ecology & Evolution, 12(e9526): 1-1.
Nichols, RN, Holland, JM & Goulson, D (2022) Can novel seed mixes provide a more diverse, abundant, earlier, and longer-lasting floral resource for bees than current mixes? Basic and Applied Ecology, 60: 34-47.
Nichols, RN, Wood, TJ, Holland, JM & Goulson, D (2022) Role of management in the long-term provision of floral
resources on farmland. Agriculture, Ecosystems & Environment, 335(108004): 1-11.
Panagea, IS, Apostolakis, A, Berti, A, Bussell, J, Cermak, P, Diels, J, Elsen, A, Kusá, H, Piccoli, I, Poesen, J, Stoate, C, Tits, M, Toth, Z & Wyseure, G (2022) Impact of agricultural management on soil aggregates and associated organic carbon fractions: analysis of long-term experiments in Europe. Soil, 8: 321-644.
Piccoli, I, Seehusen, T, Bussell, J, Vizitu, O, Calciu, I, Berti, A, Börjesson, G, Kirchmann, H, Kätterer, T, Sartori, F, Stoate, C, Crotty, F, Panagea, IS, Alaoui, A & Bolinder, MA (2022) Opportunities for Mitigation Soil Compaction in Europe –Case Studies from the SoilCare Project Using Soil-Improving Cropping System. Land, 11: 223.
Powell, LA, Aebischer, NJ, Ludwig, SC & Baines, D (2022) Retrospective comparisons of competing demographic models give clarity from ‘messy’ management on a Scottish grouse moor. Ecological Applications, 32(e2680): 1-21.
Sage, RB (2022) Released pheasants and invertebrates – a discussion of Devlin et al. (2021). Milvus: The Journal of the Welsh Ornithological Society, 1: 41-43.
Sánchez-García, C, Ewald, JA, Aebischer, NJ, Kingdon, NG & Potts, GR (2022) The introduced red-legged partridge in Britain: management and challenges for the future. In: Casas, F. & García, J.T. (eds) The Future of the Red-legged Partridge: Science, Hunting and Conservation: 99-116. Springer Nature, Cham, Switzerland.
Sánchez-García, C, Sokos, C, Santilli, F, Ponce, F, Sage, RB, Bro, E & Buner, FD (2022) Enough reared red-legs for today, but fewer wild ones for tomorrow? The dilemma of gamebird rearing and releasing. In: Casas, F. & García, J.T. (eds) The Future of the Red-legged Partridge: Science, Hunting and Conservation: 139-173. Springer Nature, Cham, Switzerland.
Simmons, OM (2022) Predicting how the juvenile life-stages of anadromous Atlantic salmon (Salmo salar) influence their migration phenology and marine survival. Unpublished Ph.D. thesis. University of Bournemouth, Bournemouth.
Souchay, G, Aebischer, NJ, Arroyo, BE, Blanco-Aguiar, JA, Meriggi, A, Porto, M, Reino, LM & Ponce, F (2022) Red-legged partridge monitoring and population trends. In: Casas, F. & García, J.T. (eds). The Future of the Red-legged Partridge: Science, Hunting and Conservation: 249-273. Springer Nature, Cham, Switzerland.
Stoate, C (2022) Farming with the Environment: Thirty Years of the Allerton Project Research. Taylor & Francis, Abingdon.
Walker, B, Stoate, C & Kendall, MR (2022) Willow leaves as a cobalt supplement for weaned lambs. Livestock Sciences, 264(105047): 1-3.
Warren, P, Hornby, T & Baines, D (2022) Does provision of supplementary food to grey partridges Perdix perdix help their over-winter survival on upland hill farms in northern England? Conservation Evidence Journal, 19: 35-40.
staff in bold
Financial report for 2022
KEY POINTS
Income was £11.1 million, compared with £9.3 million in 2021.
Expenditure on charitable activities was £6.6 million compared with £5.5 million in 2021. There was a surplus of £714,000 on unrestricted funds. The Trust’s net assets were £12.6 million at the end of the year.
The summary report and financial statement for the year ended 31 December 2022, set out below and on pages 90 to 91, consist of information extracted from the full statutory Trustees’ report and consolidated accounts of the Game & Wildlife Conservation Trust and its wholly-owned subsidiaries Game & Wildlife Conservation Trading Limited, Game & Wildlife Scottish Demonstration Farm and GWCT Events Limited. They do not comprise the full statutory Trustees’ report and accounts, which were approved by the Trustees on 27 April 2023 and which may be obtained from the Trust’s Headquarters. The auditors have issued unqualified reports on the full annual accounts and on the consistency of the Trustees’ report with those accounts, and their report on the full accounts contained no statement under sections 498(2) or 498(3) of the Companies Act 2006.
Following the easing of the Covid-19 pandemic the Trust was able to carry out its usual fundraising activities and to conduct a normal research programme, albeit with appropriate adaptions to meet the various regulations and guidelines. Thanks to the continuing generosity of the Trust’s supporters and the receipt of some extremely welcome legacies we have been able to maintain our cash reserves at a level which is slightly above our revised target level which we established.
The Trustees reviewed the Trust’s reserves policy in 2021 in light of the pandemic and determined that the target should be increased to £2.2 million, with a minimum of £1.5 million, to reflect the uncertainties which it created. Although the effects of Covid are continuing to ease, the UK and the world economy remain under strain and we feel that the revised level remains appropriate. Having established this new level the Trustees continue to be satisfied that the Trust’s financial position is sound.
Plans for future periods
1. To establish and build significant public support for a more positive approach to conservation.
2. To tackle research knowledge and evidence gaps in released gamebird dispersal, the quantification of the ‘environmental offer’ of game management for wild and released game, and the recovery of salmonid species.
3. To persuade game managers to practise GWCT’s Sustainable Game Management Principles, embed the ethos of net biodiversity gain into their game management, quantify their gains and accredit it through GWCT Shoot Biodiversity Assessments.
4. To secure policy change such that the role of predation control in species recovery is understood and embedded in the Environment Land Management Scheme (ELMS) and equivalent Agri-environment Schemes (AES) in Wales; that there are practical, workable licences for the control of protected predators to enhance nature conservation; that post-Brexit Agri-Environment Schemes are fit for purpose and informed by GWCT’s researched options; that environmental principles are pragmatically implemented into future policy and that game management remains economically and culturally active enough to continue to make a net contribution to biodiversity gain.
5. To be a leader in the demonstration and uptake of greener farming.
6. Support our staff through our first People Strategy/People Plan and creating a flexible team of scientists delivering accessible high-quality science.
7. To maintain the GWCT’s financial viability by increasing the number of membership subscriptions, reviewing and increasing our cash reserves and raising funds from a committed, engaged group of members, supporters, and donors.
Sir Jim Paice Chairman of the Trustees
Figure 1
Total incoming and outgoing resources in 2022 (and 2021) showing the relative income and costs for different activities
Independent auditors’ statement
to the Trustees and Members of the Game & Wildlife Conservation Trust (limited by guarantee)
We have examined the summary financial statement for the year ended 31 December 2022 which is set out on pages 90 and 91.
Opinion
In our opinion the summary financial statement is consistent with the full annual financial statements of the Game & Wildlife Conservation Trust for the year ended 31 December 2022 and complies with the applicable requirements of Section 427 of the Companies Act 2006 and the regulations made thereunder.
Respective responsibilities of Trustees and Auditors
The Trustees are responsible for preparing the summarised Financial Report in accordance with applicable United Kingdom law. Our responsibility is to report to you our opinion of the consistency of the summary financial statement with the full annual financial statements and the Trustees’ Report, and its compliance with the relevant requirements of section 427 of the Companies Act 2006 and the regulations made thereunder.
We also read the other information contained in the summarised Financial Report and consider the implications for our report if we become aware of any apparent misstatement or inconsistencies with the summary
statement. The other information comprises only the Review
Good Food Leicestershire Expert Advisory Group (Chair) Chris Stoate
Greenhouse Gas Recovery Biochar Demonstrator Expert Advisory Group Chris Stoate
Hampshire Avon Catchment Partnership Andrew Hoodless
Hampshire Ornithological Society, Scientific Committee Ryan Burrell
Honorary Scientific Advisory Panel of the Atlantic Salmon Trust Rasmus Lauridsen
ICES Trout Working Group
Rasmus Lauridsen/ Sophie Elliott
ICES Working Group on North Atlantic Salmon
Sophie Elliott
International Association of Falconry
Julie Ewald/ Biodiversity Working Group Francis Buner
International Organisation for Biological and Integrated Control - WPRS Council
International Wader Study Group, scientific panel
Interreg PARTRIDGE Steering Group
IUCN Species Survival Commission
John Holland
Ryan Burrell
Roger Draycott
Francis Buner/ Galliformes Specialist Group
IUCN Species Survival Commission Grouse Specialist Group
IUCN Species Survival Commission Re-introduction Specialist Group
IUCN Species Survival Commission
Nicholas Aebischer
David Baines
Francis Buner
Andrew Hoodless/ Woodcock & Snipe Specialist Group
Chris Heward
IUCN Sustainable Use and Livelihoods
Nicholas Aebischer/ Specialist Group (SULI)
LEAF Policy and Communications Advisory Committee
Missing Salmon Alliance
Julie Ewald
Alastair Leake
Teresa Dent/ Steering Group Dylan Roberts
Missing Salmon Alliance Technical Group
Moorland Management Best Practice Steering Group
Mountain Hare Monitoring Group
Natural England Hen Harrier Brood Management
Rasmus Lauridsen/ Dylan Roberts
Ross Macleod
Nick Hesford/Ross Macleod
Adam Smith Project Board and Scientific Advisory Group (until spring 22)
Natural England Scientific Advisory Committee
Natural Resources Wales Fish Eating Birds Review Group
Natural Resources Wales Fisheries Forum
Natural Resources Wales Wild Bird ReviewStakeholder Meeting - Land Management and Shooting Sector Group
NatureScot Species Reintroduction Forum
NatureScot - Natural Capital External Advisory Group
NFU East Midlands Combinable Crops Board
NFU National Environment Forum
NGO National Committee
Northern Uplands Local Nature Partnership
Oriental Bird Club Conservation manager for Pakistan and Northern India
Perthshire Black Grouse Study Group
Pesticides Forum Indicators Group of the Chemicals Regulation Directorate
PHCI Fisheries Sub group
Poole Harbour Agriculture Sub Group
Poole Harbour Catchment Initiative
Purdey Awards
River Otter Beaver Trial Dylan Roberts/Mike Swan
Rural Environment & Land Ross Macleod/ Management Group (Advisors) Rory Kennedy (chair)
Rutland Agricultural Society Alastair Leake
Scotland’s Moorland Forum and sub-groups Rory Kennedy/Ross Macleod/Nick Hesford
Scottish Black Grouse BAP Group Phil Warren/David Baines
Scottish Capercaillie Group David Baines/Kathy Fletcher
Scottish Farmed Environment Forum Ross Macleod
Scottish Government Technical Assessment Group (Snares and traps) Hugo Straker
Scottish Land & Estates Moorland Adam Smith Working Group (until spring 22)
Scottish Moorland Groups Hugo Straker/ Nick Hesford
Scottish Muirburn Code Review Group Nick Hesford
Scottish PAW Executive, Raptor and Ross Macleod/ Science sub-groups Nick Hesford
SGR Monitoring Group Alastair Leake
Shoot Liaison Committee Wales Matt Goodall/Sue Evans
South Coast White-tailed Eagle Reintroduction project steering group Mike Short
South Downs Farmland Bird Initiative Julie Ewald
South East England Pine Marten Working Group Mike Short
Southern Curlew Forum Andrew Hoodless/ Amanda Perkins
Nicholas Aebischer
Dylan Roberts
Dylan Roberts
Matt Goodall/Sue Evans
Ross Macleod
Ross Macleod
Joe Stanley
Joe Stanley
Roger Draycott
Sian Whitehead
Francis Buner
Kathy Fletcher
Julie Ewald
Dylan Roberts
Dylan Roberts
Dylan Roberts/ Will Beaumont
Mike Swan
Resilient Dairy Landscapes Stakeholder Advisory Group Alastair Leake
River Deveron Fisheries Science
Dylan Roberts
Sparsholt College Industry Liaison Group –Land & Wildlife Mike Short
Species Survival Commission Galliformes Specialist Group Francis Buner
Speyside Black Grouse Study Group Kathy Fletcher
The Bracken Control Group Alastair Leake
The CAAV Agriculture and Environment Group Alastair Leake
The Curlew Country Board Amanda Perkins/Sue Evans
UK & Ireland Curlew Action Group Sian Whitehead
Voluntary Initiative National Steering Group Alastair Leake
Voluntary Initiative Water sub-Group Chris Stoate
Welland Resource Protection Group (Chair) Chris Stoate
Welland Valley Partnership (Chair) Chris Stoate
Welsh Government Fox Snaring Advisory Group Matt Goodall
Welsh Government Land use Stakeholder Group Sue Evans
Wild Purbeck Group Dylan Roberts
Wildlife Estates England Scientific Committee Andrew Hoodless
Wildlife Estates England Steering Group Roger Draycott
Wildlife Estates, European Scientific Committee Alastair Leake
Wildlife Estates Scotland Board & Sub Groups Rory Kennedy/ Ross Macleod
Working for Waders Ross Macleod
World Pheasant Association Scientific Advisory Committee David Baines
Natural Capital Advisory’s mission is to use our expertise in natural science and business to deliver the very best environmental and financial outcomes from the Natural Capital sector.
As 72% of the UK’s landmass is managed by farmers, they will provide a large part of the solution to meet and beat ambitious national environmental targets. This process will require the provision of a wide range of Natural Capital goods and services undertaken by farmers as part of a wholesome and sustainable Natural Capital marketplace.
If you would like any more information on any of the above, please do get in touch or visit our website:
Email: nca@gwct.org.uk
Web: www.naturalcapitaladvisory.co.uk
Game & wildlife management
Good productivity is essential for all shoots; whether from the rearing field or achieving maximum productivity from wild stock
The GWCT’s advisory team are the most experienced consultants in their field, able to provide advice and training across all aspects of game management, from wild bird production and farm conservation management to the effective and sustainable management of released game and compliance with the Code of Good Shooting Practice.
Renowned for our science-based game and wildlife management advice that guarantees the best possible outcome from your shoot, we will work closely with your farm manager, gamekeeper and existing advisors to identify ways of making your game and shoot management more effective, by providing tried and tested advice backed by science.