
Washington, D.C. Metro
May 2024 Housing Market Report
Prepared by Bright Research
Key Market Statistics
Data asof June 6, 2024
Housing Market Trends Market Outlook
Home prices tie record high and high home prices are sidelining some buyers. The median sold price in the Washington D.C. metro area was $640,000in May, up 6.7% from a year ago and tying the record high set in April.
Prices continue to rise despite the significant uptick in inventory. At the end of May, there were 7,353 active listings throughout the Washington D.C. metro area, which was a 32.0% increase from a year ago.
While supply is increasing, more buyers are being kept out of the market by high home prices and elevated mortgage rates. In May, there were 5,121 closed sales, which was 2.2% lower than last year. The number of new pending sales was down 6.4% year over year.
Half of all homes sold in May were on the market six days or less, which indicates that market conditions are still brisk.
The slowdown in new pending sales suggests that the Washington D.C. are housing market may be in a cooldown period this summer. The biggest challenge in the market right now is affordability. Some buyers particularly first-time and moderate-income buyers may sit the market out, waiting for rates to come down later this year. Expect price growth in the region to moderate.
Source: Freddie Mac
Avg.
Rate 30-yr fixed rate For more, visit brightmls.com/research
Weekly
Mortgage
4% 5% 6% 7% 8% Jun '23 Jun '24
May 2024 May 2023 Change YTD 2024 YTD 2023 Change Closed Sales 5,121 5,238 -2.2% 19,462 19,749 -1.5% Median Sold Price $640,000 $600,000 +6.7% $600,000 $560,000 +7.1%
Days on Market 6 days 6 days +0 days 7 days 9 days -2 days New Pending Sales 5,176 5,530 -6.4% 22,227 22,851 -2.7% New Listings 5,970 5,563 +7.3% 29,153 27,656 +5.4% Active Listings 7,353 5,569 +32.0% 7,353 5,569 +32.0% Months of Supply 1.81 1.23 +0.58 mos. 1.81 1.23 +0.58 mos. Showings 106,841 121,897 -12.4% 511,766 585,665 -12.6%
Median
May 2024
May '24 vs. May '23
May '24 vs. Apr '24
5,121 -2.2% +13.3% (May '23: 5,238) (Apr '24: 4,518)
Median Sold Price
May 2024
May '24 vs. May '23
May '24 vs. Apr '24
$640,000 +6.7% +0.0% (May '23: $600,000) (Apr '24: $640,000)
Median Days on Market
May '24 vs. May '23 May 2024
May '24 vs. Apr '24
6 days +0 days +0 days (May '23: 6 days) (Apr '24: 6 days)
Closed Sales 2019-2022Range 2024 2023 2024 2023 2022 2021 2020 2019
May 2024 Housing Market Report Washington, D.C. Metro : 2 0 days 10 days 20 days 30 days 40 days 2019 2020 2021 2022 2023 2024 $350,000 $400,000 $450,000 $500,000 $550,000 $600,000 $650,000 $700,000 Jan Feb Mar Apr May Jun Jul Aug Sep Oct Nov Dec 0 2,500 5,000 7,500 10,000 Jan Feb Mar Apr May Jun Jul Aug Sep Oct Nov Dec
May 2024
May '24 vs. May '23
May '24 vs. Apr '24
5,176 -6.4% -3.9% (May '23: 5,530) (Apr '24: 5,386)
May 2024
May '24 vs. May '23
May '24 vs. Apr '24
5,970 +7.3% (May '23: 5,563) +0.1% (Apr '24: 5,964)
May 2024
May '24 vs. May '23
May '24 vs. Apr '24
7,353 +32.0% +11.9% (May '23: 5,569) (Apr '24: 6,569)
New
Sales 2019-2022Range 2024 2023 2019-2022Range 2024 2023
Report
Active Listings New Listings
Pending
May 2024 Housing Market
Washington, D.C. Metro : 3 0 2,500 5,000 7,500 10,000 12,500 15,000 2019 2020 2021 2022 2023 2024 0 2,500 5,000 7,500 10,000 12,500 Jan Feb Mar Apr May Jun Jul Aug Sep Oct Nov Dec 0 2,500 5,000 7,500 10,000 Jan Feb Mar Apr May Jun Jul Aug Sep Oct Nov Dec
Local Markets
May '24 vs. May '23 May '24 vs. May '23 May '24 vs. May '23 Washington, D.C. Metro 5,176 -6.4% 5,970 +7.3% 106,841 -12.4% Alexandria City, VA 204 -13.6% 211 -11.0% 3,311 -9.0% Arlington County, VA 212 -18.1% 262 +0.0% 3,976 -10.8% Fairfax City, VA 36 -2.7% 34 +3.0% 624 -21.2% Fairfax County, VA 1,271 -2.2% 1,340 +9.2% 27,863 -9.2% Falls Church City, VA 10 -47.4% 10 -37.5% 213 -38.6% Frederick County, MD 407 +0.2% 455 +11.2% 6,625 -7.5% Loudoun County, VA 514 -1.0% 557 +11.0% 9,430 -15.0% Montgomery County, MD 1,028 -2.2% 1,050 +5.4% 23,212 -6.7% Prince George's County, MD 849 -5.5% 947 +11.0% 19,723 -15.0% Washington, DC 645 -19.9% 1,104 +7.4% 11,864 -24.2% May '24 vs. May '23 May '24 vs. May '23 May '24 vs. May '23 Washington, D.C. Metro 5,121 -2.2% $640,000 +6.7% 6 days +0 days Alexandria City, VA 219 +3.3% $705,000 -3.9% 6 days +1 day Arlington County, VA 231 -13.8% $715,000 +6.2% 6 days +0 days Fairfax City, VA 37 -21.3% $839,250 +14.2% 4 days -1 day Fairfax County, VA 1,336 +4.8% $770,000 +8.5% 5 days +0 days Falls Church City, VA 19 +0.0% $1,260,000 +18.4% 6 days +1 day Frederick County, MD 340 -2.9% $512,500 +6.8% 6 days +0 days Loudoun County, VA 483 -3.8% $751,000 +5.0% 5 days +0 days Montgomery County, MD 1,023 +2.2% $650,000 +6.6% 6 days +0 days Prince George's County, MD 763 -6.4% $430,000 +1.4% 10 days +0 days Washington, DC 670 -10.5% $695,000 +5.3% 13 days -2 days May 2024 Housing Market Report
Closed Sales Median Sales Price Median Days on Market New
Sales New Listings Showings
Washington, D.C. Metro : 4
Local Markets
Pending
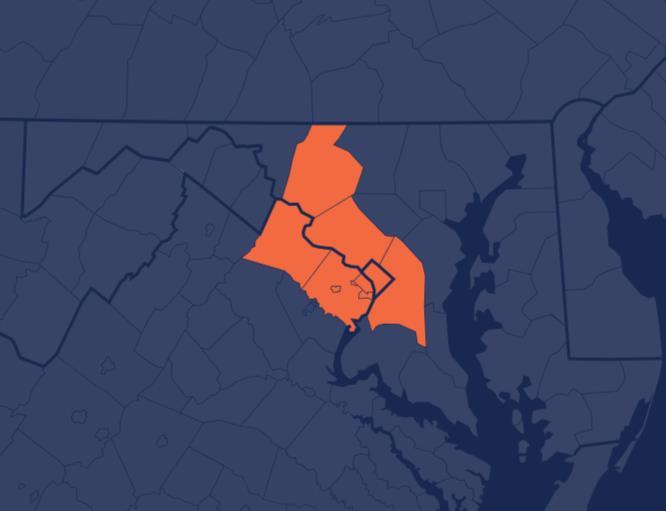
Local Market Map
MD/WV Panhandle
North Central Virginia
Washington D.C., Metro
Central Pennsylvania
Baltimore Metro
Southern Maryland
Maryland Eastern Shore
Philadelphia Metro
Del/Mar Coastal
About Bright MLS

Bright MLS was founded in 2016 as a collaboration between 43 visionary associations and two of the nation’s most prominent MLSs to transform what an MLS is and what it does, so real estate pros and the people they serve can thrive today and into our data-driven future through an open, clear and competitive housing market for all. Bright is proud to be the source of truth for comprehensive real estate data in the Mid-Atlantic, with market intelligence currently covering six states (Delaware, Maryland, New Jersey, Pennsylvania, Virginia, West Virginia) and the District of Columbia.
Please contact Christy Reap, Media Relations Director with interview or information requests:
• (202) 309-9362
• christy.reap@brightmls.com
May '24 vs. May '23 May '24 vs. May '23 Washington, D.C. Metro 7,353 +32.0% 1.81 +0.58 months Alexandria City, VA 192 +10.3% 1.12 +0.16 months Arlington County, VA 322 +17.5% 1.71 +0.36 months Fairfax City, VA 25 -24.2% 1.04 -0.23 months Fairfax County, VA 1,208 +29.5% 1.29 +0.39 months Falls Church City, VA 10 -28.6% 0.91 -0.36 months Frederick County, MD 433 +44.3% 1.46 +0.64 months Loudoun County, VA 554 +28.2% 1.43 +0.44 months Montgomery County, MD 1,032 +33.0% 1.34 +0.45 months Prince George's County, MD 1,141 +38.8% 1.60 +0.52 months Washington, DC 2,436 +34.5% 4.42 +1.48 months
More market insights are available at brightmls.com/research. Active Listings Months of Supply Washington, D.C. Metro : 5
Local Markets