Optimizing operational carbon: reclaiming
heat from refrigeration systems for space heating
Evaluating the energy savings potential for recovering waste heat from CO2 and R-448A refrigeration


Abstract
In the commercial refrigeration and HVAC sectors, industry stakeholders are making significant investments to reduce the carbon footprints of refrigeration assets while aligning with sustainability goals and regulatory requirements. This evolution is particularly evident in food retail, where there is a shift toward next-generation equipment and system architectures using low-global warming potential (GWP) refrigerants. Concurrently, space heating systems are transitioning from fossil fuels to all-electric options. The interdependence between HVAC and refrigeration systems will be crucial for future efficiency and sustainability.
Copeland and Henderson Engineers conducted a comparative study to address four key questions:
1. What types of heat reclaim — i.e., water versus direct-air — yield the highest energy savings?
2. How do factors such as climate zone, store size and refrigeration system types and/or loads impact the amount of reclaimable heat?
3. Is boosting the refrigeration system discharge pressures worthwhile for heat reclamation purposes?
4. How do heat reclamation capacity, energy usage and operational carbon intensity differ among existing and next-generation refrigeration and HVAC systems in food retail applications?
The baseline systems were chosen to represent typical installations in use today, such as: refrigeration using R-448A — an A1 hydrofluorocarbon (HFC) refrigerant — and space heating using natural gas. In contrast, the next-generation configuration features R-744 (CO2), a natural A1 refrigerant, in a booster refrigeration system paired with heat pump technology optimized for heat recovery. Both configurations were designed to maximize the utilization of waste heat from refrigeration for space heating, thereby reducing supplemental heat requirements.
The study encompasses a supermarket (57,000 square feet) and a hypermarket (190,000 square feet) across the six representative U.S. climates shown below, reflecting real-world conditions. This white paper demonstrates the potential of heat reclamation strategies in refrigeration systems, particularly when combined with heat pump technologies, to supplement space heating in food retail facilities. By comparing these technologies with baseline systems, the study provides an objective evaluation of their annual energy efficiency gains and contribution to decarbonization efforts.
U.S. climates within scope include:
• Dallas, Texas
• Los Angeles, California
• Miami, Florida
• Minneapolis, Minnesota
• Chicago, Illinois
• Portland, Oregon
Refrigeration systems
The tables and figures below provide illustrations of the refrigeration system architectures, the number of systems used, and the assumed loads for each store format considered in this study. It’s important to note: the R-744 systems utilized adiabatic gas coolers, whereas the R-448A system employed air-cooled condensers. The decision to use adiabatic gas coolers on CO2 booster systems was made because many end users have adopted this technology. CO2 booster systems are particularly sensitive to increases in ambient temperature, causing their efficiency to decline more rapidly compared to systems using R-448A refrigerant. Adiabatic gas coolers enable these systems to utilize wet bulb ambient temperatures, mitigating or completely offsetting the negative impact of higher ambient temperatures on efficiency. The impact on water usage will be discussed further in the appendix.
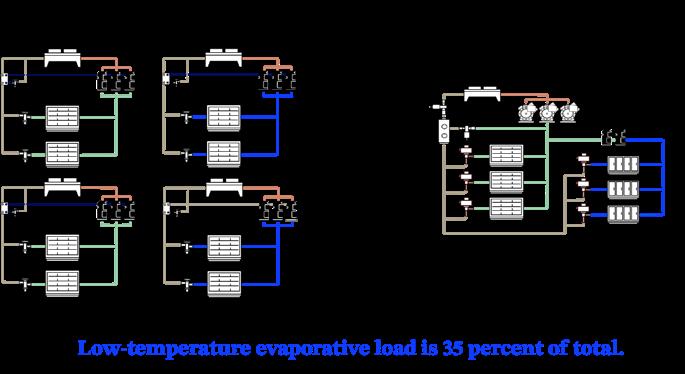
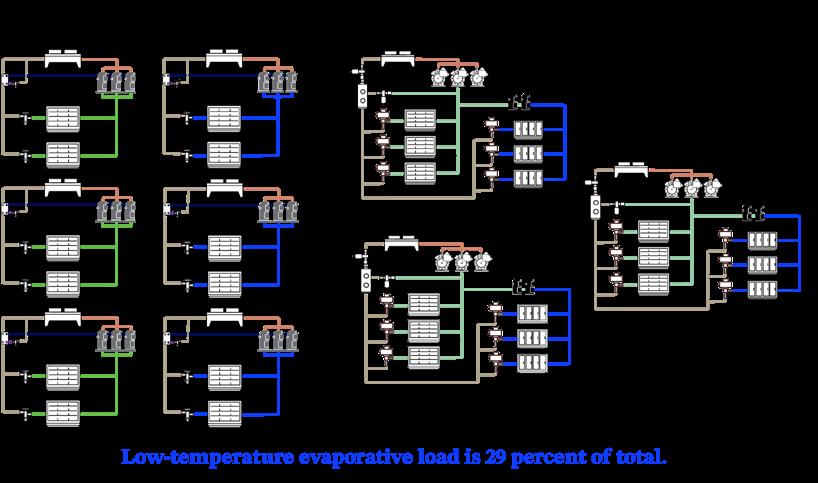
Figures 1a, 1b: Supermarket [a] and hypermarket [b] unit distribution for each refrigeration system type
Annual estimates of refrigeration energy consumption were derived using variable load profiles sourced from Copeland Product Selection Software (PSS) and Oak Ridge National Laboratory. The refrigeration load demand varies as the outdoor ambient temperature changes, as illustrated in Figures 2a and 2b.

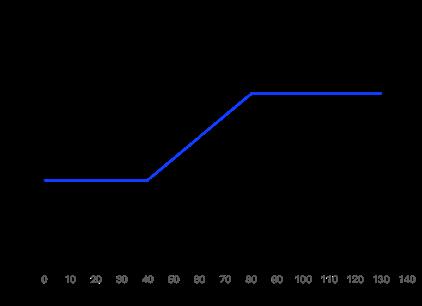
Figures 2a, 2b: Variable load profiles for both medium-temperature (MT [a]) and low-temperature (LT [b]) applications relative to ambient air temperature. As temperature decreases, the total load demand also decreases, and partial load requirements should be considered. (a) (b)
The design criteria for each of the two refrigeration system architectures are shown in Figures 3a and 3b.
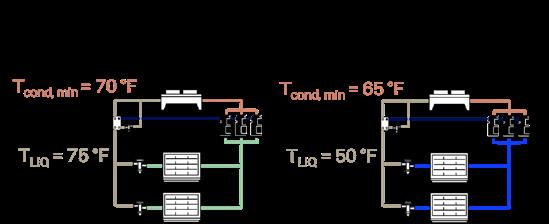
3a: Design criteria assumptions for baseline refrigeration system
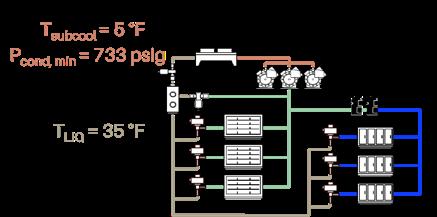
Figure 3b: Design criteria assumptions for a standard R-744 booster refrigeration system
Note: Please refer to the appendix for additional details on the assumptions made regarding the refrigeration systems considered in this study.
Space heating
The study evaluated the two types of refrigeration systems for each store format alongside their respective space heating requirements. The R-448A system, without any heat recovery, was selected as the baseline and paired with natural gas heating.
Table 2 shows the average heat load considered for each store format.
Table 2: Average heat loads and reclaim heat available for the supermarket and hypermarket prototypes at varying LT outdoor ambient conditions
Table 3 provides an overview of the space heating methods employed in the study.
* Each system that incorporates heat recovery aims to maximize the amount of recovered heat used for heating the store.
Figures 4, 5 and 6 depict the heating system architectures, including basic design assumptions and considerations used in the study.
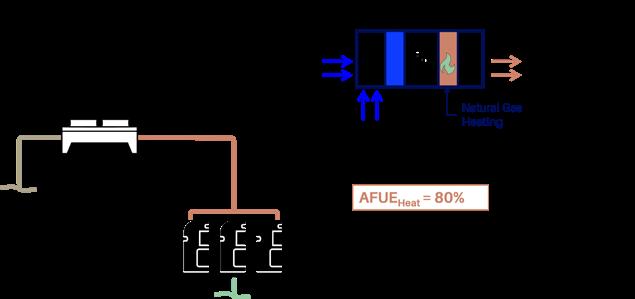
Figure 4: Representation of baseline space heating solution with no heat recovery from the R-448A refrigeration system
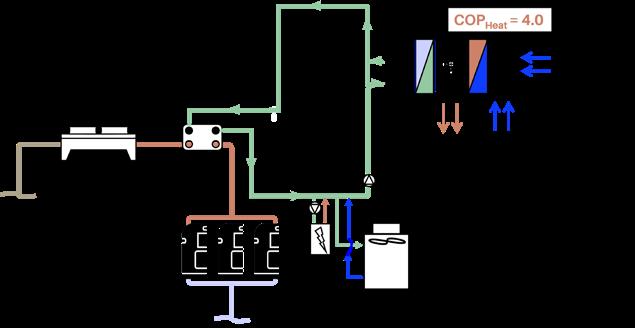
Figure 5: WSHP with heat recovery from the refrigeration system, supplemented with an electric boiler
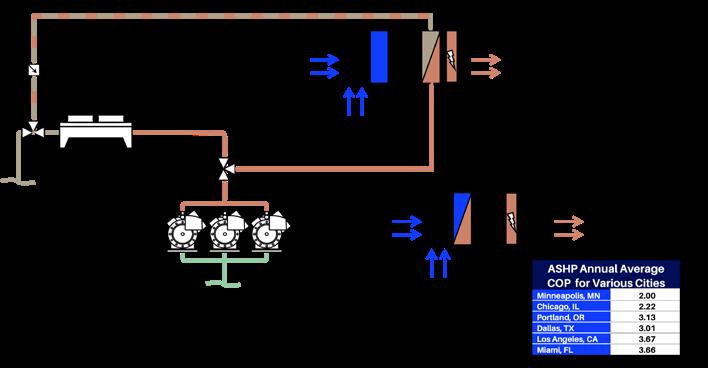
Note: Please refer to the appendix for additional details on the assumptions made regarding the heating systems considered in this study.
Effect of raising head pressure on heat recovery
Compared to R-448A direct expansion systems, R-744 (CO2) booster systems generally operate at higher temperatures and provide higher-quality heat. A CO2 booster’s unique use of a high-pressure valve at the outlet of the gas cooler in combination with the flash gas bypass system has the ability to increase gas cooler pressures on demand, while maintaining a constant receiver, liquid line pressure and liquid quality. However, this results in increased energy consumption for compressors and refrigeration systems.
In WSHP systems, raising the condensing pressure does not yield benefits due to low water loop temperature requirements. WSHP systems are more effective in rejecting heat to offset building heating loads compared to direct reclaim options, but their complexity and potential inefficiencies with high heating loads can necessitate supplemental heating.
For supermarket and hypermarket scenarios with directair reclaim, increasing head pressure in CO2 booster
systems improved heating performance. In supermarkets, mixing outside air with indoor air and raising head pressure enhanced latent heat recovery, achieving the target 85 °F discharge air temperature, even in cold conditions. R-448A systems, in contrast, could only manage an 80.2 °F supply temperature at their averaged minimum condensing temperature of 68 °F (midpoint).
Hypermarket direct-air systems also benefited from higher condensing pressures, reaching 85 °F discharge air temperature at outdoor temperatures of 10 °F or higher when condensing pressure was increased for the colder climate locations of Minneapolis and Chicago. The study prioritized achieving a specific discharge air temperature over excess heat, leading to relatively few hours of operation at these elevated pressures. As demonstrated in Figure 7, pushing the head pressure above the CO2 critical point in a Minneapolis hypermarket used less total energy than operating at the minimum head pressure (60 °F saturated condensing temperature [SCT]) for directair reclaim plus electric and more total energy than a small increase in head pressure (70 °F SCT).

WSHP Reclaim strategy enables running refrigeration system at minimum SCT longer, since the need for quality heat is low.
Increasing the pressure for WSHP Reclaim results in a total energy penalty.
Direct-Air Reclaim strategy benefits from holding the refrigeration SCT above the minimum by increasing the useable heat.
Heating COP is higher with ASHP versus electric resistance heat (COP = 1). Maximizing the time the ASHP boosts heat improves overall heating efficiency.
Figure 7: Energy comparisons for hypermarket in Minneapolis, Minn., showing the impact of artificially raising a CO2 booster system from subcritical 70 °F saturated condensing temperature (SCT) into the transcritical pressure region. Percentages in the table are relative to the respective reclaim strategies at 60 °F SCT condition.
Operational carbon findings
After evaluating the different refrigeration and space heating approaches, it was important to take a holistic view of how the systems work together and evaluate the overall impacts to the carbon footprint of each approach. As such, the authors have presented carbon calculations for Scope 1 direct greenhouse gas (GHG) emissions (i.e., emissions from refrigerant leakage and on-site combustion of natural gas), Scope 2 indirect GHG emissions (i.e., emissions from electricity production per usage), and Scope 3 GHG emissions (i.e., upstream emissions from natural gas). Combined, they can be used to generate an annual carbon footprint for the various refrigeration systems and space heating/heat reclaim scenarios for each location and store prototype.
Systems using natural gas for space heating and the synthetic refrigerant R-448A for refrigeration exhibited the highest operational carbon footprint across all scenarios analyzed. This effect was particularly pronounced in colder climates and in the larger hypermarket format where heating demands are highest. In contrast, the natural refrigerant R-744 demonstrated superior performance in terms of operational carbon footprint compared to R-448A,
regardless of climate or store size. This primarily can be attributed to the relatively high leak rates in refrigeration systems combined with the greater GWP impact of R-448A when released into the environment.
In the supermarket format, the operational carbon emissions were similar when comparing two heat recovery strategies (i.e., reclaiming heat from the R-744 system into a WSHP loop supplemented with an electric boiler versus direct-to-air reclaim supplemented with ASHPs and electric resistance heat, across all climates).
One of the study’s most notable findings was the performance of ASHPs when coupled with direct-toair R-744 heat recovery systems in hypermarkets. This combination demonstrated superior performance across all climates, especially in colder regions like Chicago and Minneapolis. Compared to WSHPs, this setup delivered more than a 30 percent improvement in operational carbon performance in those colder climates — challenging the conventional belief that ASHPs are less effective in colder climates.

Figure 8a: Total CO2 emissions in supermarket profile of baseline R-448A No Reclaim, Gas, R-448A WSHP Reclaim, R-744 WSHP Reclaim and R-744 Direct-Air Reclaim, ASHP for each location
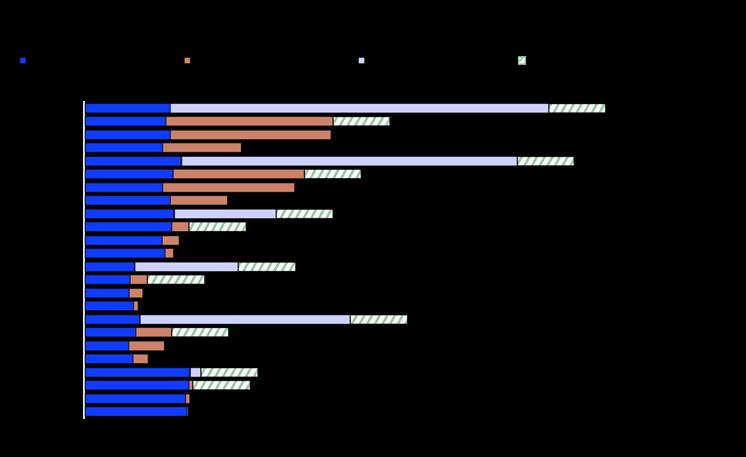
Figure 8b: Total CO2 emissions in hypermarket profile of baseline R-448A No Reclaim, Gas, R-448A WSHP Reclaim, R-744 WSHP Reclaim and R-744 Direct-Air Reclaim, ASHP for each location
Note: See appendix for carbon equivalency comparisons. (Source: EPA)
Conclusion/recommendations
To meet regulatory requirements or corporate sustainability goals, stakeholders must transition away from refrigeration systems with high-GWP refrigerants and maximize heat recovery from the free heat provided by natural refrigeration systems.
In a traditional supermarket format, both WSHP recovery systems and direct-air with ASHPs appear equally beneficial. The choice may ultimately depend on costeffectiveness and suitability for a specific site. In the hypermarket format, the combination of direct-air R-744 heat recovery supplemented by ASHPs is particularly promising. One of the challenges in adopting all-electric heating systems in these buildings is the impact on an electrical infrastructure. The findings of this study may provide a pathway to addressing this issue.
Considerations among WSHP and direct-air with ASHP strategies:
1. WSHP recovery system:
• Benefit: Allows for thermal storage during non-peak hours, which can help in managing energy use effectively
• Distribution: Uses straightforward methods for equally distributing the heated fluid (water)
• Suitability: Requires a secondary water system, which adds to the complexity and costs of installation and maintenance
2. Direct-air with ASHPs system:
• Benefit: Avoids the complexities and costs associated with a secondary water system
• Distribution: Ensuring proper distribution of the refrigerant through the heating coils can be tricky
• Suitability: May be more cost-effective and suitable, depending on the specific site conditions and requirements
Comparisons and considerations:
• Cost-effectiveness: Depends on factors like initial installation costs, ongoing maintenance expenses and energy efficiency over the system’s lifetime
• Suitability: Determined by the specific site conditions, such as available space, climate and existing infrastructure
• Complexity: WSHP systems are more complex due to their need for a secondary water system, but they offer advantages in terms of thermal storage. Direct ASHP systems are simpler but require careful design for effective refrigerant distribution.
In summary, both WSHP recovery systems and direct-air with ASHPs have inherent benefits. The choice between them will hinge on factors such as cost-effectiveness, site suitability, and the complexity of installation and maintenance, particularly regarding water versus refrigerant distribution systems.
Appendix
Refrigeration systems load breakdown
Table A1a: Supermarket R-448A
Refrigeration system assumption details
The baseline refrigeration system for each store type consists of air-cooled R-448A packaged units. They utilize vapor-injected scroll compressors arranged in parallel piping. The LT units are subcooled to a 50 °F (10 °C) liquid, while the MT units are subcooled to a 75 °F (24 °C) liquid. Condensing pressure is controlled using a traditional temperature differential (TD) strategy, with a 10 °F (5.6 °C) TD for LT units and a 15 °F (8.3 °C) TD for MT units. The minimum condensing temperatures considered are 65 °F (18.3 °C) for LT units and 70 °F (21 °C) for MT units. Due to R-448A’s blended nature with approximately 10 °F (5.5 °C) of glide, the energy analysis uses system performance at a midpoint condition for fair comparison with a pure R-744 system.
The comparison system is a standard R-744 booster system using adiabatic gas cooler technology across all climates. LT compressors are scroll type; MT compressors are transcritical reciprocating. As detailed in Tables A1a through A1d, the design saturated suction temperatures (SSTs) vary among the distributed systems but are comparable in terms of the required heat transfer properties to achieve design load conditions for both R-448A and R-744.
Table A2 displays estimated water usage and the percentage of time spent in supercritical mode for
Water usage for adiabatic gas coolers
each climate, indicating the “wet mode” percentage of operating hours. The approach temperature (temperature difference between ambient air on the condenser/gas cooler and refrigerant) for the condenser/gas cooler varies depending on operating mode (subcritical or supercritical). For ambient air temperatures below 75 °F (24 °C), subcritical operation assumes 5 °F (2.8 °C) of natural subcooling and an approach temperature of 8 °F (4.4 °C). This sets the TD of the CO2 system during subcritical operation to 13 °F (7.2 °C), slightly lower than the baseline. Despite the higher discharge temperature and percentage of desuperheater heat in R-744 compared to R-448A, overall TDs for the entire heat rejection process assumed for both systems are very close.
In subcritical operation, the minimum CO2 condensing pressure is assumed at 733 psig (50 bar) or 60 °F (15.6 °C) saturated condensing temperature. However, the report later discusses evaluating higher minimum condenser/gas cooler pressures for additional heat reclamation. In supercritical operation, where the gas cooler outlet refrigerant temperature exceeds the critical temperature of 87.8 °F (31 °C), an approach temperature of 7 °F (4 °C) is assumed. For adiabatic gas coolers, the “water-on” threshold is assumed at 72 °F (22 °C). At this dry bulb temperature, the corresponding wet bulb bin temperature is used, allowing the system to operate subcritically for extended periods.
* The average American household consumes approximately 30,000 gallons of water per person annually. For a family of four, this equates to around 120,000 gallons of water annually. (Source: EPA)
While not within the scope of this study, methods like rainwater harvesting and other forms of graywater utilization can significantly reduce water consumption. For instance, the 190,000 square foot hypermarket has the potential to harvest approximately 120,000 gallons of water from just one inch of rainfall.
Alternative optimization technologies for R-744 boosters, such as parallel compression, mechanical subcooling, ejectors or various low superheat approaches, were not considered as part of this study.
Refrigeration energy efficiency
In comparing the annual energy usage of refrigeration systems across different architectures, store types and locations, a bin analysis was conducted for each scenario. Figures A1a and A1b illustrate the results for both the R-448A baseline and the R-744 booster system without heat reclamation, for both supermarket and hypermarket store types, respectively.
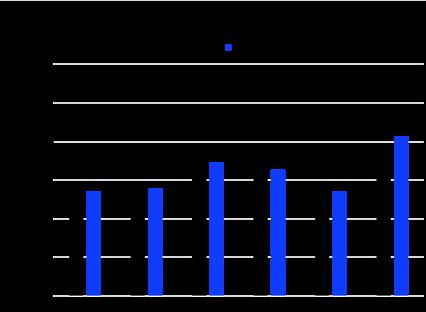
Figure A1a: For the supermarket prototype, refrigeration energy use between the R-448A baseline and CO2 system with adiabatic gas cooler is very close. Only in Los Angeles and Miami does the estimated CO2 energy use exceed that of the baseline.
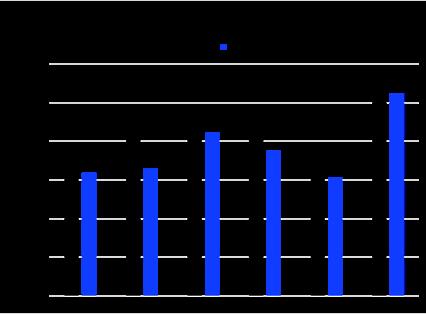
Figure A1b: For the hypermarket prototype, refrigeration energy use of the CO2 system with adiabatic gas cooler is estimated to be 1–11 percent more efficient, depending on the location (Miami being the closest to baseline R-448A energy use).
When comparing refrigeration systems used in supermarket and hypermarket store profiles, overall energy consumption increases by 30–40 percent in hypermarkets due to their larger system loads. Generally, the CO2 booster system demonstrates better refrigeration energy efficiency compared to the R-448A baseline. This improvement is primarily driven by the use of an adiabatic gas cooler instead of an aircooled condenser. In dry climates like Dallas, the CO2 booster system benefits from lower average condenser/ gas cooler outlet temperatures (drop leg) compared to hydrofluorocarbon (HFC) air-cooled systems in the same location, resulting in lower annual energy usage. However, in warmer and more humid climates such as Miami, the advantages of CO2’s properties at lower condensing temperatures and/or the influence of the adiabatic gas cooler are less pronounced.
Space heating
A target supply air temperature of 85 °F was selected for the direct-air reclaim systems. Reclaimable heat beyond that required to achieve the target supply air temperature was ignored.
In warmer climates like Miami and Los Angeles, a desuperheating-only, direct-air heat reclaim system was examined. Heating energy use was comparable to that of WSHP systems with a much simpler system. A desuperheating-only, direct-air heat reclaim system could also serve as a reheat coil for improved dehumidification during cooling operations.
Heating energy by strategy
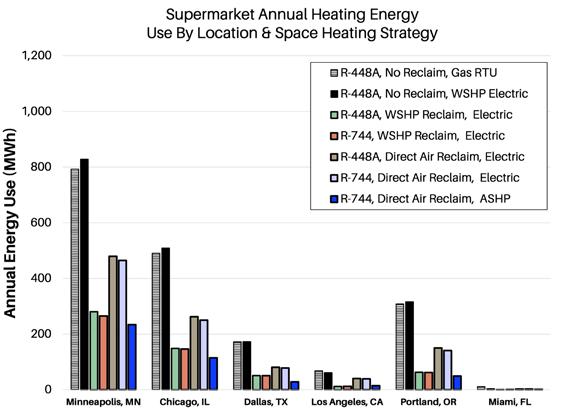
Figure A2a: Annual heating energy consumption in the supermarket profile, per location and space heating strategy. For Minneapolis and Chicago with R-744 Direct-Air Heat Reclaim, a 70 °F minimum saturated condensing temperature was assumed. For Los Angeles and Miami with R-744 Direct-Air Heat Reclaim, heat reclaim was limited to desuperheating.
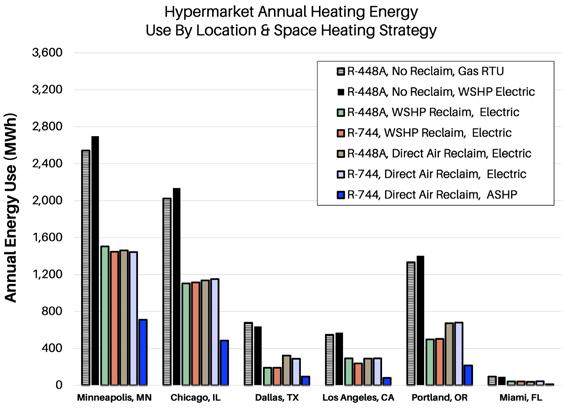
Figure A2b: Annual heating energy consumption in the hypermarket profile, per location and space heating strategy. For Minneapolis with R-744 Direct-Air Heat Reclaim, the minimum gas cooler pressure was increased to run above the critical pressure, 1,056 psig. For Chicago with R744 Direct-Air Heat Reclaim, a 70°F minimum saturated condensing temperature was assumed. For Los Angeles and Miami with R-744 Direct-Air Heat Reclaim, heat reclaim was limited to desuperheating.
Operational carbon by city
NOTE 1: For R-744 CO2 booster systems, particularly in cold climates (Minneapolis, Chicago), the direct- air reclaim options used elevated minimum condenser/gas cooler pressure to maximize heat recovered from the refrigeration system.
Minneapolis, Minn.
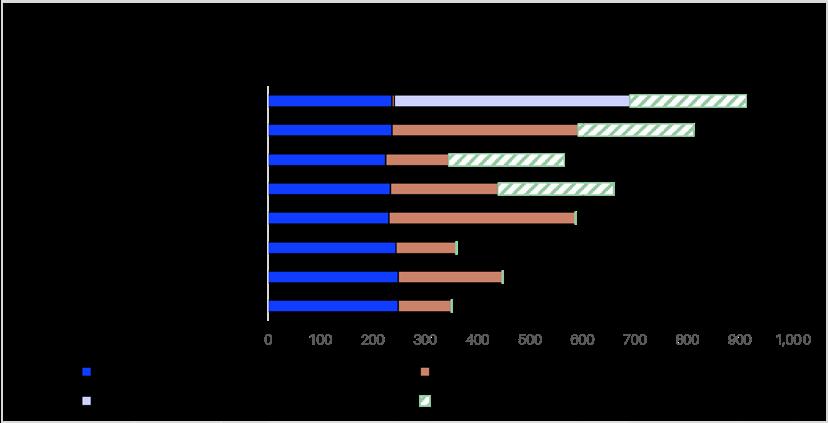
Minneapolis supermarket carbon footprint comparison. 1Minimum condensing pressure for R-744 reclaim was equivalent to 70 °F saturated condensing temperature.
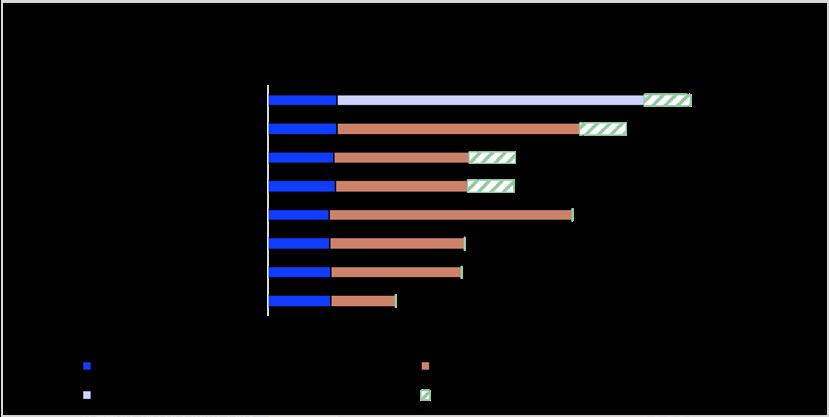
Minneapolis hypermarket carbon footprint comparison. 1Minimum condensing pressure for R-744 reclaim was equivalent to 70 °F saturated condensing temperature.
Chicago, Ill.
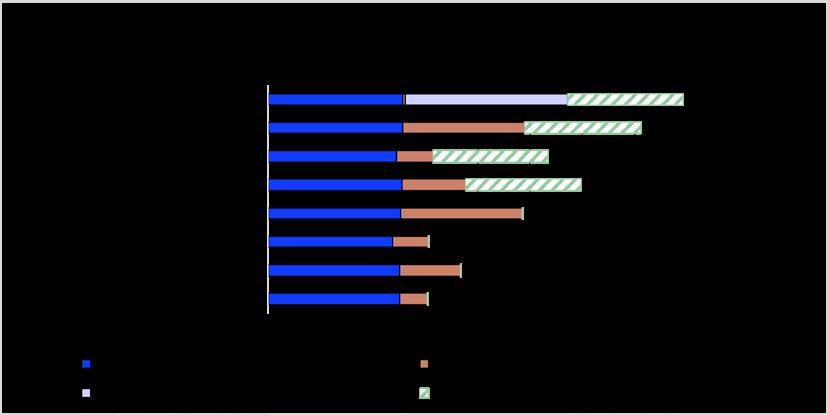
Chicago supermarket carbon footprint comparison
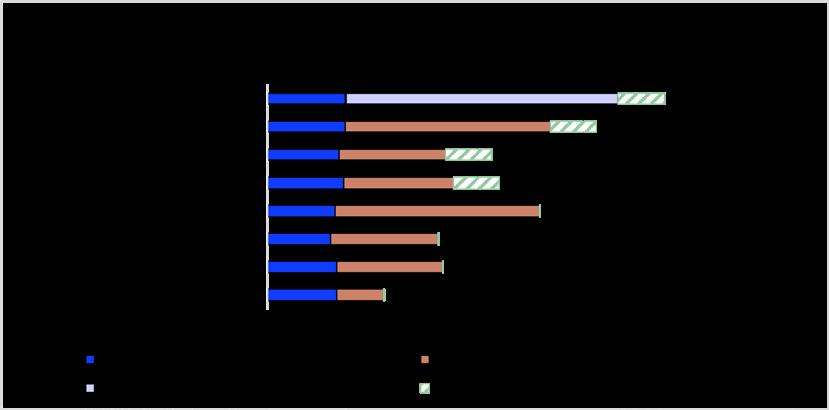
Chicago hypermarket carbon footprint comparison. For Chicago and R-744 Direct-Air Heat Reclaim, a 70 °F minimum saturated condensing temperature was assumed.
Dallas, Texas
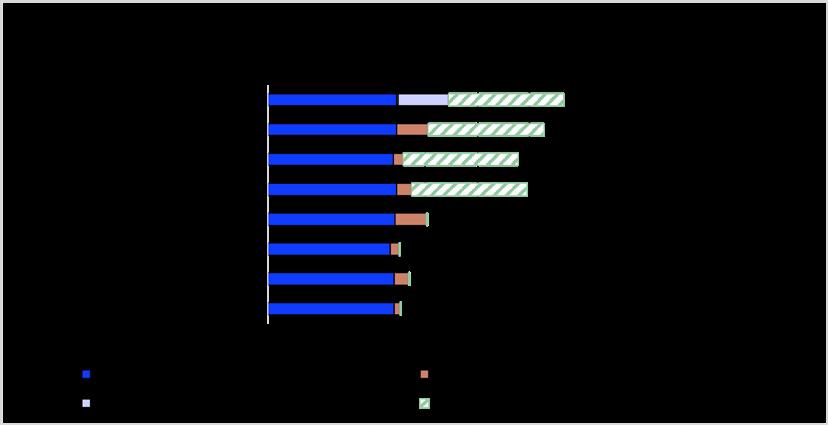
Dallas supermarket carbon footprint comparison
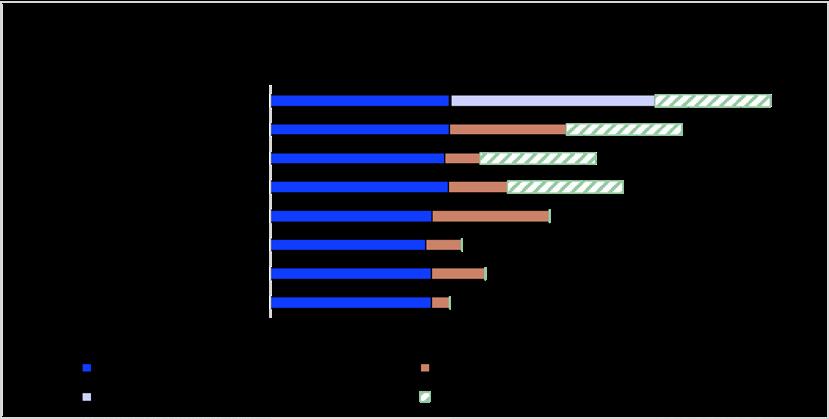
Dallas hypermarket carbon footprint comparison
Los Angeles, Calif.
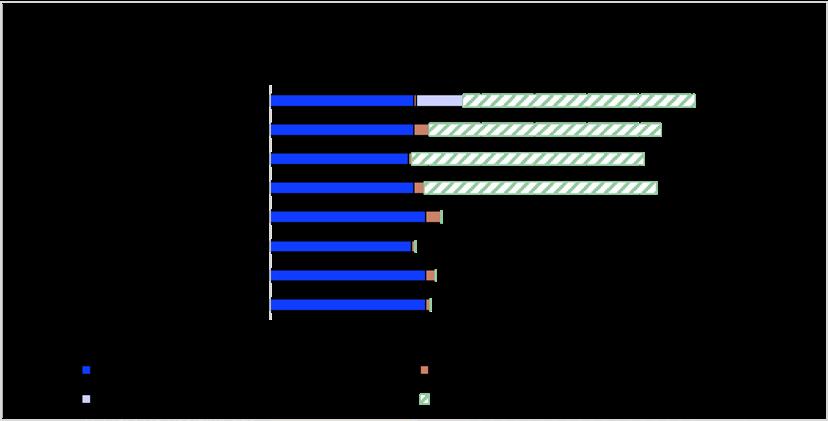
Los Angeles supermarket carbon footprint comparison. 2For R-744 direct-air reclaim strategy, heat is used for desuperheating only.
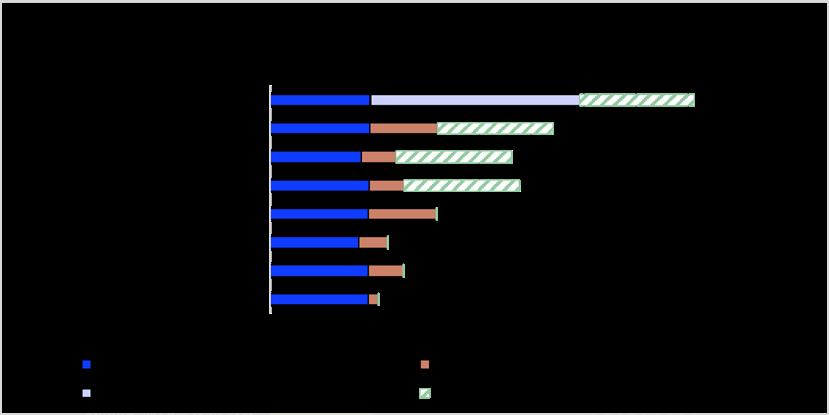
Los Angeles hypermarket carbon footprint comparison. 2For R-744 direct-air reclaim strategy, heat is used for desuperheating only.
Portland, Ore.
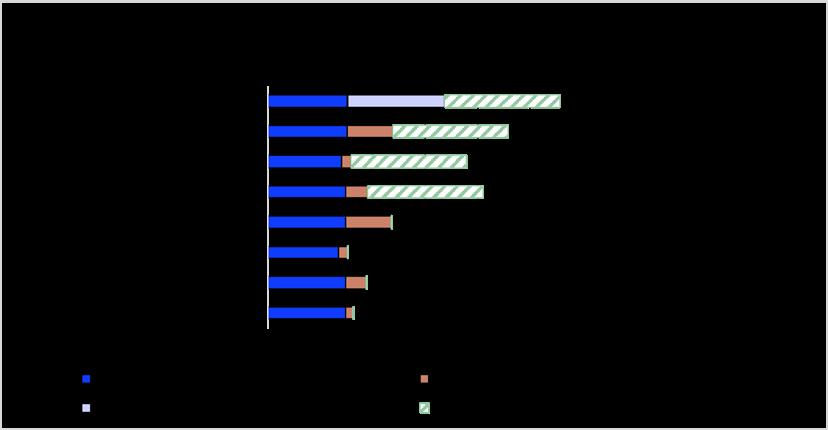
Portland supermarket carbon footprint comparison
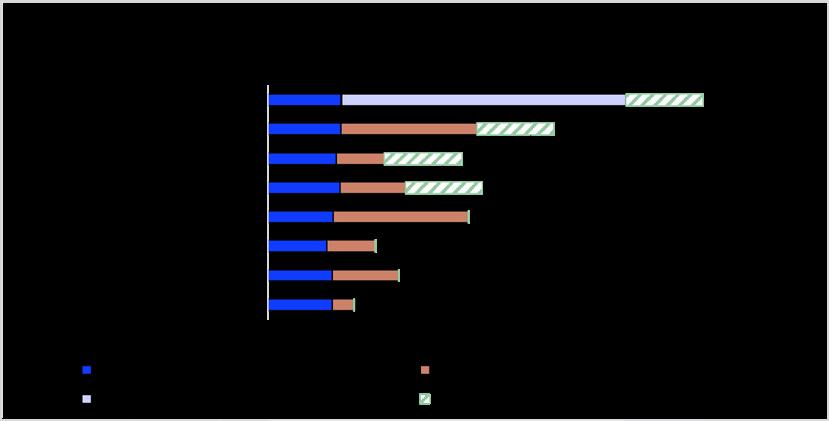
Portland hypermarket carbon footprint comparison
Miami, Fla.
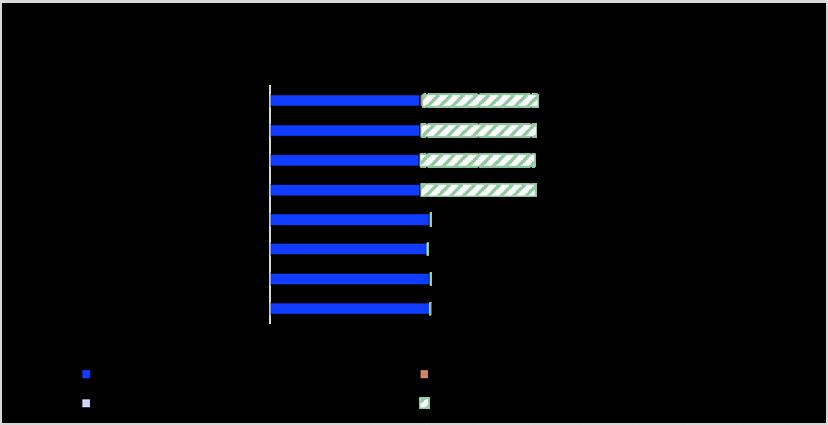
Miami supermarket carbon footprint comparison. 2For R-744 direct-air reclaim strategy, heat is used for desuperheating only.
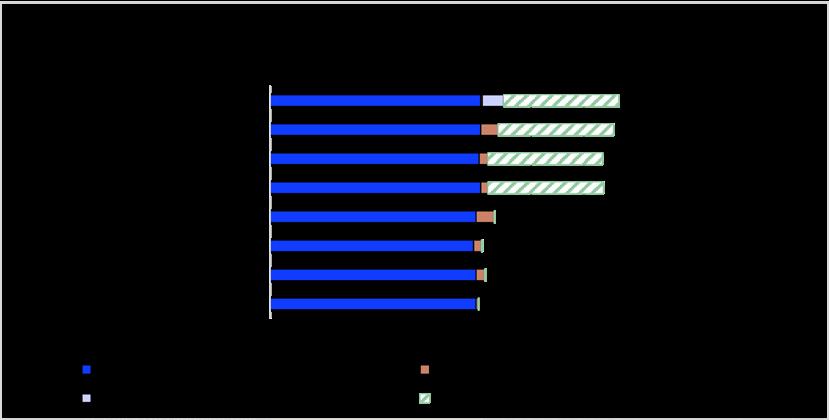
Miami hypermarket carbon footprint comparison. 2For R-744 direct-air reclaim strategy, heat is used for desuperheating only.
GHG equivalencies
Table A3: Supermarket GHG equivalencies by region
Greenhouse Gas Equivalencies
These metrics translate abstract carbon dioxide emissions into concrete terms that are more common and relatable.
Source: https://www.epa.gov/energy/greenhouse-gas-equivalencies-calculator


These metrics translate abstract carbon dioxide emissions into concrete terms that are more common and relatable.


Sources
TMY3 weather data sourced from Climate.OneBuilding.Org
Assumptions and sources used for the GHG emissions calculations:
GHG emissions factors from electrical energy use were based on the 27 EPA eGRID subregion output emission rates (eGRID2022).
The GHG emissions factor for on-site combusted natural gas used in the emissions calculations were set at 0.005291 mtCO2e/therm based on U.S. EIA carbon dioxide emission coefficients, release data September 7, 2023.
An upstream natural gas fugitive emissions leakage rate of 2.3 percent per delivered therm is based on the study, Alvarez, et.al., “Assessment of methane emissions from the U.S. oil and gas supply chain”. Science, vol. 361, issue 6398, July 2018, pp 186-188 , https://www.science.org/doi/epdf/10.1126/science.aar7204
Emissions factors for upstream natural gas component GHG emissions, including CO2, N2O and CH4, are based on data from the following studies:
Burns & Grubert, 2021. Attribution of production-stage methane emissions to assess spatial variability in the climate intensity of US natural gas consumption. Environmental Research Letters 16: https://doi.org/10.1088/1748-9326/abef33
Omara et al., 2018. Methane Emissions from Natural Gas Production Sites in the United States: Data Synthesis and National Estimate. Environmental Science & Technology 52: 12915-12925.
NETL (National Energy Technology Laboratory), 2021. Industry partnerships and their role in reducing natural gas supply chain greenhouse gas emissions - Phase 2.
Emissions for CO2, N2O and CH4 are calculated based on IPCC AR6 20-year average GWP (GWP-20) emissions factors. Emissions for refrigerant R-448A are calculated based on IPCC AR4 100-year average GWP (GWP-100).
Leakage rates for refrigeration systems in the carbon emissions analysis were set at 25 percent system loss per year.
GHG emissions equivalencies were generated using the EPA Greenhouse Gas Equivalencies Calculator at https://www.epa.gov/energy/greenhouse-gas-equivalencies-calculator [epa.gov]

