
20 minute read
the Sub-Levels?
Is Retail (Still) Lingering in the Sub-Levels?
NAPIC’s 2020 data and insights from Tan Hai Hsin, Managing Director of Retail Group Malaysia.
Advertisement
Major malls have found some balance with the return of shoppers after the MCOs.
NAPIC’s data for 2020 showed that the retail sub-sector was hit with a lesser drop in occupancy than expected from 79.2% in 2019 to 77.5% in 2020. Although the marginal decrease is not reflective of the frightening headlines in the news last year, it could be attributed to the various compensating measures offered by the landlords to sustain its tenants. This could also be the reason why occupancy rates in Klang Valley held up above the national overall, recording 82% in Kuala Lumpur and 80% in Selangor. The same however cannot be said for Johor and Penang with 74.9% and 72.8% respectively.
Managing Director of Retail Group Malaysia Tan Hai Hsin shared that many shopping centres in Klang Valley with relatively low occupancy rates during the Covid-19 period have actually been suffering from the same fate even in 2019 as they struggled to secure tenants due to the serious oversupply of retail space. He opined that should the country recover quickly in the coming one to two years, the lacklustre malls will continue to face the same problem, worsened by the rapid growth of online shopping.
Despite the drop in business and a stuttering construction pace in 2020, NAPIC’s data reported the completion of 13 shopping complexes or close to 0.38 million sqm on the back of 556 buildings (12.61 million sqm) in existing stock. The market also continued seeing 42 other shopping malls (1.81 million sqm) in incoming supply with 12 more (0.51 million sqm) in the planned supply stage.
Return of the Shoppers
With bated breath, shopping traffic of major malls in Malaysian cities has finally returned to pre-Covid-19 level since the lifting of the second MCO in 2021 but sales in all retail categories have still some way to go according to Hai Hsin. The rush to return to the malls was mainly caused by the lengthy lockdowns that have stifled Malaysians from their mall visits for their retail therapy, dining, recreational and entertainment activities. But due to the reduced take-home pay, purchasing power has been compromised and as such, Retail Group Malaysia projects a lower growth of 4.1% in the Malaysian retail market for 2021 compared of its earlier projection of 4.9%.
The growth projection took into account the first two months of the Movement Control Order (MCO) in 2021, the foreseeable persisting interstate travel ban, the slower than expected mass vaccination and lower consumer spending than 2019’s level. It is anticipated that the market will only return to 2019’s level some time in 2024 conservatively or at the earliest 2023, provided the country’s economy can attain high annual growth rates in 2022 and 2023, disclosed Hai Hsin.
Just like the rising footfalls of major malls in KL city centres, he observed that suburban malls in Klang Valley have also enjoyed higher visits
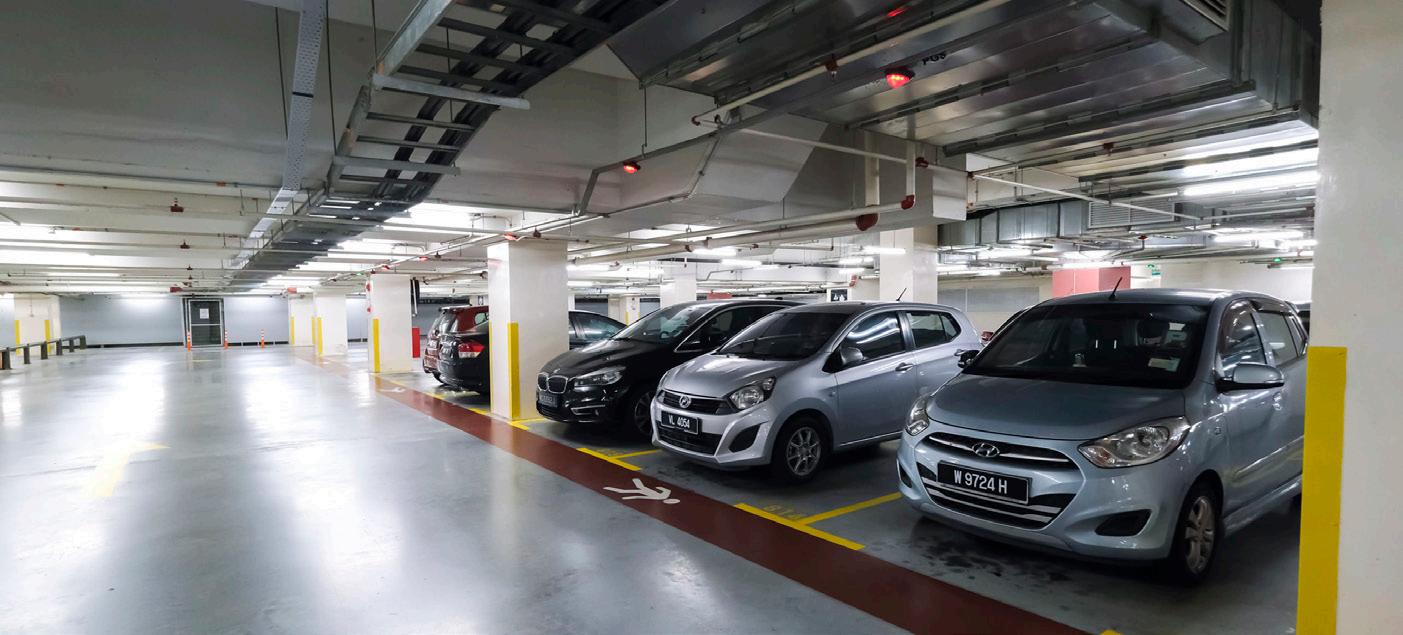
Will the parking lots ever get to the stage of pre-Covid-19 levels?
compared to the first two months of the year. The latter have in fact enjoyed better patronage because of the high reliance of tourists (about 15-20%) in the city centre malls in Bukit Bintang and the KLCC shopping districts. With border closures and interstate travel ban since MCO 2.0, avid Malaysian shoppers have been prevented from visiting the higher quality malls in Kuala Lumpur that are absent in their hometowns.
Consistent with the rising mall visits, cafes and restaurants have equally been enjoying a good number of dine-in customers but have still some way to go before matching 2019’s performance due to the standard operating procedures on physical distancing. But good news has however finally streamed in from the cineplexes as eager movie fans wasted no time getting back into the theaters from 5 March 2021, the day the curtain raises after the pandemic shuttered their doors. But like the F&B outlets, sales are still sub-2019 level due to physical distancing measures.
Due to very poor performance, is there a strategy that can be adopted so mall owners do not have to resort to closing down?
In the past, very few shopping centres in Malaysia have shut down due to poor occupancy rate. As compared to the United States, we have relatively few abandoned shopping centres in Malaysia. When shopping centres face low occupancy rates, they tend to lower their rental rates in order to attract non-retail occupants such as offices and schools. Some rented to
government agencies, some even leased out their units as storage space.
Suppose the travel borders are shut for the rest of the year to foreign tourists, is domestic consumption sufficient to sustain these malls?
Foreign tourists spending accounts for not more than 10% of the total retail market. Thus, the lack of foreign tourists does not have a significant impact on Malaysia’s retail market.
Will the market witness some form of consolidation or mergers & acquisitions in the near horizon?
Consolidation and mergers & acquisitions have started since the first MCO was lifted in May 2020 as we witnessed a high number of closures immediately after. A second round of major closures took place after the bank moratorium ended in October 2020. The third round was during the second MCO in 2021.
Will we see more tenants moving back to the malls or will there be a flight of tenants to the shop lots to sustain business given the cheaper rent?
The retail market will not be stabilised until early next year and after more than a year of consolidation, retailers will only look into expansion in 2022. Nevertheless, some retailers with financial resources will take this current opportunity to expand their businesses with two advantages - cheaper rent and lower costs of renovation. In fact, they have been doing that since the middle of last year. Some tenants, especially the F&B operators may move out of the shopping centres after their leases expire.
During this pandemic, some operators found out that they can generate good business online or via drive-through, take-away and delivery. If they are located at the upper level or tucked in one corner of a shopping centre, their customers or deliverymen will find it hard to access their outlets.
“The worst hit segments are the entertainment-related outlets (cineplex, video arcade, VR centre, escape room etc), recreationalrelated outlets (children play centre, rock climbing, badminton court, children swim school, theme park etc), bars and nightclubs, shops located in airports and bus terminals, and those that are highly dependent on tourists such as Central Market in Kuala Lumpur and the Singaporean tourists-reliant Johor and Melaka malls. A longer period of recovery is hence needed.”
Business for the factory outlets or outlet malls such as the Mitsui Outlet Park, Johor Premium Outlet, Genting Highlands Premium Outlet, Freeport A’Famosa Outlet (Melaka) and Design Village (Penang) have also been unilaterally affected due to the lack of foreign tourists said Hai Hsin. Nevertheless, they have been surviving with the ardent support of brand-conscious Malaysians scouring for great bargains on branded goods.
New Year, New Beginnings
KUALA LUMPUR
Kuala Lumpur
1) KL City = 1 Project Highrise = RM800 - RM900psf 2) Bukit Jalil = 1 Project Highrise = RM600 - RM700psf
1
2
Number of New Project Launches
2020 2021 Projects 9 12
The fight against Covid-19 continues in 2021, however launch activity in Q1 2021 bears resemblance to prepandemic levels, perhaps a good sign that it’s business-as-usual in the industry, having endured the worst disruption in recent history.
● Based on our compiled data, we see a slight increase in the number of launches for Q1 2021, with 12 launches across KL and Selangor, compared to 9 for Q1 2020. ● The total number of units launched in Q1 2021 was however less than Q1 2020, with 3,030 units on offer or about 64% compared to 4,720 units the previous year. ● Selangor saw more launches throughout both periods where in Q1 2020, it commanded a slight edge at 67% share but totally dominated with 83% in Q1 2021.
Number of Units Launched in New Projects
2020 2021
Units 4,720 3,030
● In terms of the total number of units launched, Kuala Lumpur edged ahead in Q1 2020 with 70% at 3,317 units but Selangor raced ahead with 75% or 2,258 units in Q1 2021. ● Q1 2021 looked to be a livelier period for launches with 3 in January, 4 in February, and 5 in March, perhaps an indicator of developers already used to the “new normal” and the various opportunities that accompany it such as leveraging on digital technology etc. ● Q1 2021 saw an even distribution in terms of property type with 6 landed and 6 high rise projects. The corresponding period in the previous year had 5 landed and 4 high rise launches. ● Although there were 2 more high rises launched in Q1 2021, the number of units offered is lesser at 2,391 units or 61.5% against 3,885 units in Q1 2020. ● There are more landed units in Q1 2021 with 639 homes offered from 6 projects compared to 835 from 5 projects in Q1 2020. ● Terraces and superlinks seem to be getting the attention with all 6 landed projects launched in Q1 2021 within this category. In Q1 2020, terraces and superlinks had slightly less with 4 launches. ● Serviced residences or serviced apartments were also popular over the 2 corresponding quarters with 4 projects in Q1 2021, which is 1 more than Q1 2020’s 3 projects. ● Unit configurations are relatively well-distributed across both time periods but it is interesting to see that there were 5 projects offering units exceeding 2,000 sq ft over the two quarters, catering to a possible shifting trend of buyers looking for larger homes.
2020 2021
1 2
Types of Projects
1 3 4 4 6
Condominium Semi-D Serviced Residence / Serviced Apartment
Terrace / Super Link
● Bulk of the projects (10) in Q1 2021 offered units priced between RM601,000 to RM800,000, followed by 9 in the affordable range of RM401,000 to RM600,000. Not far behind are the pricier ones between RM801,000 to RM1 million with 7 projects and 5 more projects with units beyond RM1 million. ● Before the Covid-19 pandemic, Q1 2020 was more catered to the affluent with 7 (out of 9) projects priced above RM1 million, followed by 10 projects altogether between RM601,000 to RM1 million price brackets. ● Perhaps influenced also by the Covid-19 aftermath, Q1 2021 launches look to emphasise value
Selangor
1) Sungai Buloh = 1 Project Landed = RM300 - RM400psf 2) Petaling Jaya = 1 Project Highrise = RM800 - RM1,000psf 3) Setia Alam = 1 Project Landed = RM350 - RM500psf 4) Subang Jaya = 1 Project Highrise = RM500 - RM700psf 5) Seri Kembangan = 1 Project Highrise = RM550 - RM700psf 6) Dengkil = 1 Project Landed = RM300 - RM400psf 7) Sepang = 1 Project Landed = RM300 - RM400psf 8) Semenyih = 2 Projects Landed = RM300 - RM500psf 9) Kajang = 1 Project Highrise = RM550 - RM600psf
3
2
Location
for money with 6 projects (out of 12) offering units priced below RM500 per sq ft compared to the 7 projects (out of 9) offered units in Q1 2020 priced between RM501 to RM750 per sq ft. ● KL’s two launches were located in the city proper (high rise, RM800 to RM900 per sq ft) and in Bukit Jalil (high rise, RM600 to RM700 per sq ft) with both featuring great accessibility yet at times overwhelmed by high traffic due to its popularity. ● Value landed buys continue to feature prominently in Selangor, in particular Sungai Buloh, Dengkil, Sepang (each with projects offering units priced between RM300 to RM400 per sq ft), Setia Alam (RM350 to RM500 per sq ft), and Semenyih (RM300 to RM500 per sq ft).
SELANGOR
1
2
3 4
5
6
7 9
8
2020
2
601sf - 800sf
801sf - 1,000sf
1,001sf - 1,200sf
1,201sf - 1,500sf
1,501sf - 1,800sf
1,801sf - 2,000sf
Above 2,000sf
PRICING BY PROJECTS
2020
11% 33% 56% 56% 78% 17% 75% 83% 58% 42%
Below RM400,000
RM401,000 - RM600,000
RM601,000 - RM800,000
RM801,000 - RM1,000,000
Above RM1,000,000
2021
PRICE PER SQUARE FEET (PSF)
2020 2021
56% 78% 11% 11% 0% 50% 33% 17% 0% 0%
Below RM500
RM501RM750
RM751RM1,000
RM1,001RM1,500
Above RM1,500
NB: The percentages shown in the table are based on our analysis of the projects that we surveyed but they are not computed based on the number of units within those projects. The way to read this table is as follows eg. based on the projects that we analysed, 56% of them included units of above 2,000 sq ft in size. It however does not mean that 56% of all the units are above 2,000 sq ft. Each project will probably only have very few units of above 2,000 sq ft in size.
Location
2021
1 1 1 1
Setia Alam Puchong Kepong Mont Kiara Setiawangsa Sungai Buloh Semenyih
1 1 1 1 1 1 1 1 1 1
Bukit Jalil Dengkil Kajang KL City Petaling Jaya Sepang Seri Kembangan Setia Alam Subang Jaya Sungai Buloh
A BRIEF INTRODUCTION TO STOCK OPTIONS AND EMPLOYEE STOCK OPTIONS
By Nai Siu Loon and Adie Gupta

Let’s begin with understanding what stock options and employee stock options (“ESOPs”) are.
An option is a contract that allows a buyer the right to buy or sell an underlying asset or financial instrument at a specified strike price on or before a specified date, depending on the form of the option. The strike price may be set by reference to the spot price (market price) of the underlying security or commodity on the day an option is taken out or it may be fixed at a discount or at a premium. The seller has the corresponding obligation to fulfil the transaction (to sell or to buy) if the buyer (option holder) exercises the option. An option that conveys to the option holder the right to buy at a specific price is referred to as a call; and an option that conveys the right of the option holder to sell at a specific price is referred to as a put. The most common type of options in the market are: ● American option: an option that may be exercised on any trading day on or before expiration. ● European option: an option that may only be exercised on expiry.
These are often described as vanilla options. Other types of options include Bermudan option, Asian option, Barrier option, Binary option, Exotic option etc.
The classification of options is important because, for example, choosing between American or European options will affect the choice for the option pricing model. There are in general three ways in valuing the stock options and ESOPs. These are the Black-Scholes option pricing model, the Binomial tree approach and the Monte Carlo simulation. Depending on the situation, one of these could be used.
In addition to the stock options, companies may also issue stock options to their employees known as the ESOPs. ESOPs allow the employees of a company the right to purchase the employer’s shares at a predetermined strike price and period. As per a paper “Determining the Value of Employee Stock Options” by John Hull and Alan White (August 2002), there are several common features in which the ESOPs differ from a regular stock option: ● There is usually a vesting period during which the ESOPs cannot be exercised.
This vesting period can be as long as four years; ● When the employees leave their jobs they typically lose unvested ESOPs and any vested ESOPs that are out of the money. They have to exercise vested ESOPs that are in the money immediately; ● Employees are not permitted to sell their ESOPs. They must exercise the
ESOPs and sell the underlying shares in order to realise a cash benefit or diversify their portfolios. This tends to lead to ESOPs being exercised earlier than similar regular options; and ● There is some dilution when ESOPs are exercised.
In general, below are the common inputs required in valuing the stock options and ESOPs: ● The stock price is the current market price of the asset. The exercise price (or the strike price) is the price at which an option can be exercised and is usually pre-fixed upon entering into the contract.
● The life (or expected life) of the option. ● The expected dividend yield:
Although this does not have a direct impact on the value of options, but it does have an indirect impact through the stock price. When the dividend is paid, the stock becomes ex-dividend therefore the stock price will go down which would result in an increase in the put premium and decrease in the call premium. ● The risk-free rate of interest. ● The expected stock price volatility. ● In the case of ESOPs, some additional consideration may be required, for example the exercise behaviour of the ESOP holder, vesting periods and criteria of the ESOP plan and forfeiture record of the ESOPs.
Case Study
Company A is a start-up private company which has completed its Series B preference share (“Series B PS”) fundraising at $2 per Series B PS on 1 April 2020. During FY2020, Company A also granted ESOPs to its eligible employees at the end of each quarter in year 2020. Underlying the ESOPs are the ordinary shares of Company A with an exercise price of $1 and expiring at the tenth anniversary from the grant dates. The ESOPs can only be exercised on the next fund-raising or exit event. Company A is required to value its ESOPs at the grant dates for financial reporting purposes (and let us assume these are equity settled ESOPs).
Consideration #1 Understand the Underlying Shares
In this instance where the capital structure involves, the ordinary shares, Series A preference share, Series B PS and ESOPs, an equity allocation model needs to be developed to allocate the value across different classes of equity before valuing the ESOPs. Here one should not use the Series B PS price of $2 as a price input to value the ESOPs unless the characteristics of Series B PS and ordinary shares are identical, which is often not the case.
Consideration #2 Work Out Various Estimates and Assumptions
In allocating the value across different classes of shares, certain features of each class of shares and company specific matters/potential events would need to be considered and modelled, for example: ● What are the likely exit and fundraising scenarios? Examples of exit scenarios are IPO, sale to a PE, trade sale etc. ● What are the probabilities for such scenarios eventuating? ● When are the scenarios expected to occur? ● What are the payoffs to each type of shareholder in such scenarios? ● How is the liquidation preference (ranking in the case of liquidation) in such scenarios?
Next, in valuing an ESOPs, examples of some estimates or assumptions that need to be considered are as follows: ● What is the expected stock price volatility? Should Company A refer to its comparable companies’ stock price history or benchmark against the relevant stock market index? ● What is the life or expected life of the ESOPs? It is rather common to use a “simplified” method in estimating the expected life of ESOPs as an input for the Black
Scholes option pricing model. However, the “simplified” method may not be appropriate in this case as the ESOPs can only be exercised on the next fundraising or exit event. Company A needs to consider and estimate the appropriate time frame and probabilities of those events (as such the exercisability of the
ESOPs) eventuating. Readers may refer to the “Staff Accounting Bulletin No. 110” by U.S. Securities and Exchange Commission for further details on the use of the “simplified” method.
Consideration #3 Maintain Historical Exercise and Forfeiture Records
Company A would maintain historical exercise and forfeiture records. Over time, for example, the use of a “simplified” method may not be appropriate when more relevant detailed exercise and forfeiture records information becomes available. A more sophisticated method such as the Binomial tree approach and Monte Carlo simulation may be more appropriate in valuing Company A’s future ESOPs grant.
Conclusion
Companies should pay attention to the details of the ESOP plan and its value implications when drafting the plan itself. A number of aspects need to be juggled including, employee incentives/retention, compliance costs and implications (ie. to fulfil the requirements of financial reporting standards and/or the tax regime). The ESOPs in the hands of the employee may be taxable depending on the tax status and the jurisdiction. Valuation of the ESOPs can be complicated many times particularly if the implications are not thought through enough before finalising the ESOP plan.
This article is written by Nai Siu Loon, Associate Director of Spring Galaxy and Adie Gupta, Managing Director of Spring Galaxy, an Associate firm of Henry Butcher Malaysia. Siu Loon and Adie provide valuation and related advisory services to the corporate sector in Singapore, Malaysia and the wider AsiaPac region. Siu Loon and Adie have relevant experience of more than 10 years and 20 years respectively. Adie is a regular speaker and trainer for many accounting bodies and organisations in the region including in Malaysia.
Spring Galaxy is a transaction advisory firm specialising in business valuations and transaction support services. For more information, please visit https:// springgalaxy.com
Bungalows and Service Residences For Sale and Rent

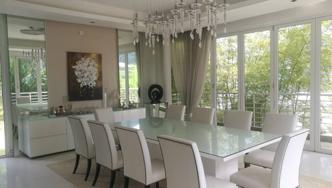
RM6,500,000.00 (nego) Sierramas, Sungai Buloh Type Bungalow Tenure Freehold Built-Up 8,000sf Land Area 9,990sf Bedroom 5+2 Bathroom 6 Furnishing Partly Furnished Linda Ooi (REN09433), 012-2363065 Nigel (REN09436), 012-3960307
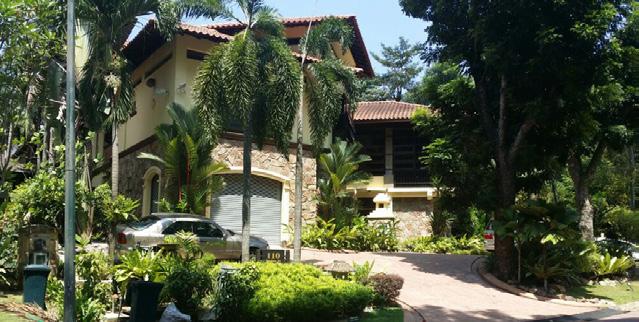
RM6,000,000.00 Sierramas East, Sungai Buloh Type Bungalow Tenure Freehold Built-Up 6,332sf Land Area 8,330sf Bedroom 6 Bathroom 6 Furnishing Partly Furnished CK Lum (REN09439), 016-3028936

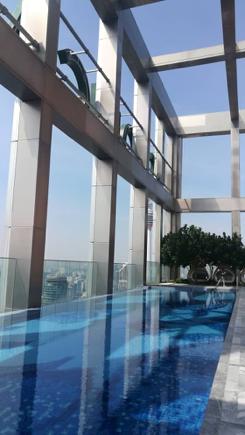
From RM3,800,000.00 Oval, KLCC Type Service Residence Tenure Freehold Built-Up 3,700sf Bedroom 3+1 Bathroom 4 Furnishing Partly/Fully Furnished Christine Chua (REN09437), 012-3142864
From RM1,900,000.00 Ruma Residences KLCC Type Service Residence Tenure Freehold Built-Up from 900sf Bedroom 2, 3 Bathroom 2 / 3 Furnishing Partly/Fully Furnished Christine Chua (REN09437), 012-3142864 Nigel (REN09436), 012-3960307 From RM4,200,000.00 (nego) Nadayu, Taman Melawati Type Bungalow Tenure Freehold Built-Up 7,900sf Land Area 8,100sf Bedroom 5+2 Bathroom 8 Furnishing Partly/Fully Furnished Christine Chua (REN09437), 012-3142864
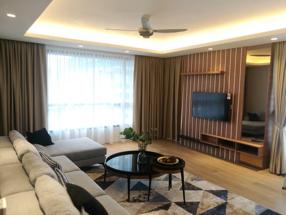
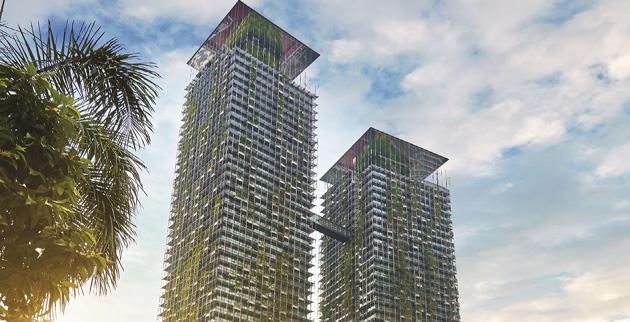
From RM1,700 to RM2,110 per sq ft Le Nouvel, KLCC Type Service Residence Tenure Freehold Built-Up from 1,700sf Bedroom 2/3 Bathroom 2 Furnishing Partly/Fully Furnished Christine Chua (REN09437), 012-3142864

From RM2,155,000.00 (before rebates) Retail @Cantara Residences, Ara Damansara Type Retail Lots (12 units only) Tenure Freehold Built-Up From 1,841sf to 4,682sf Facing East Furnishing Bare unit Nigel Chin (REN09436),012-3960307 **Attractive rebates & special promo given by developer
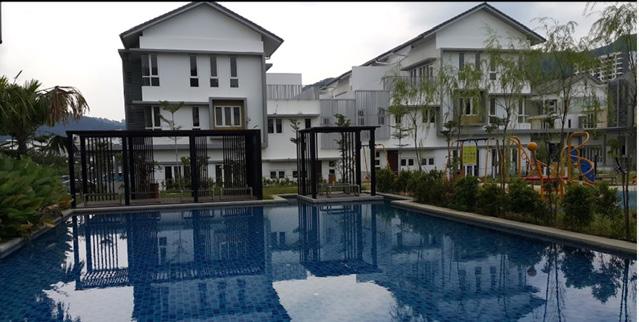
For sale from RM550.00 per sq ft (nego) For rent from RM5,000.00 per month (nego) Taman Hevea Kemensah Type Semi-D Tenure Leasehold Built-Up 3,600sf Land Area 2,960sf Bedroom 5 Bathroom 6 Furnishing Unfurnished /Partly Furnished CK Lum (REN09439), 016-3028936 Carolyn (REN09438), 017-8722781 RM2,800,000.00 (nego) Bandar Mahkota Cheras Type Bungalow Tenure Freehold Built-Up 6,000sf Land Area 7,700sf Bedroom 7 Bathroom 7 Furnishing Fully Furnished CK Lum (REN09439), 016-3028936
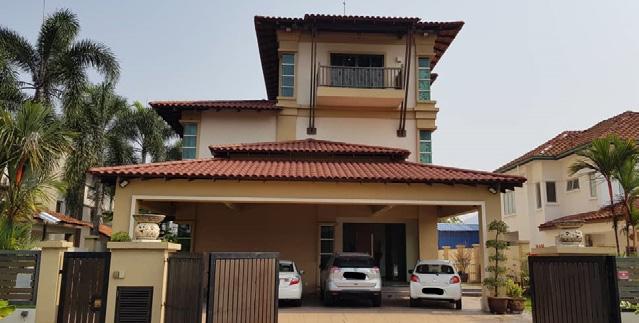
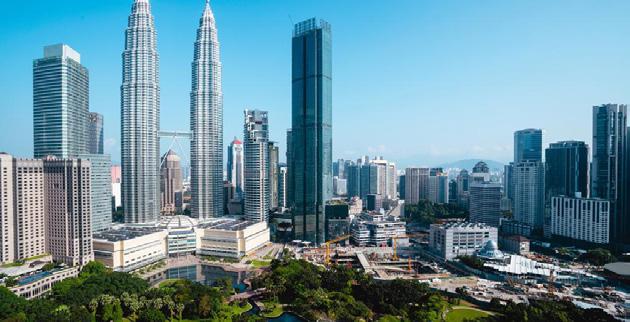
From RM3,000 per sq ft Four Seasons, KLCC Type Private Residences Tenure Freehold Built-Up from 1,098sf Bedroom 1/2/3 Bathroom 2 / 3 Furnishing Partly/Fully Furnished Christine Chua (REN09437), 012-3142864
From RM1,600,000.00 Tropicana Residence KLCC Type Service Residence Tenure Freehold Built-Up from 700sf Bedroom 1/2/3 Bathroom 1/2/3 Furnishing Partly/Fully Furnished Christine Chua (REN09437), 012-3142864 Nigel (REN09436), 012-3960307
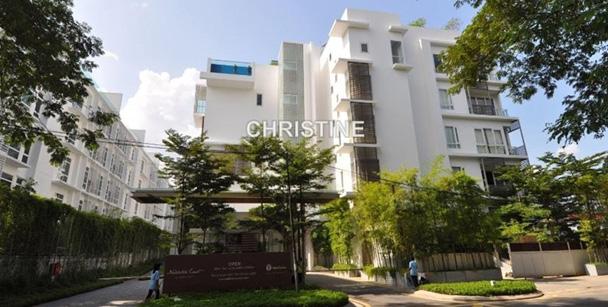
From RM5,570,000.00 (nego) Jalan U-Thant Kuala Lumpur Type Condominium (Simplex, Duplex, Triplex) Tenure Freehold Built-Up 3,568sf to 6,601sf Bedroom 4+1 Furnishing Partly /Fully furnished Christine Chua (REN09437), 012-3142864


