22 minute read
FROM THE BENCH
from C_263_201
by Hiba Dweib
Build an MCU-Based Automatic Blood Pressure Cuff
Personal health products are becoming more and more commonplace. They reinforce regular visits to personal physicians and can be beneficial when diagnosing health issues. This article shows you how to convert a manual blood pressure cuff into an automatic cuff by adding an air pump, a solenoid release valve, and a pressure sensor to a microcontroller circuit.
Advertisement
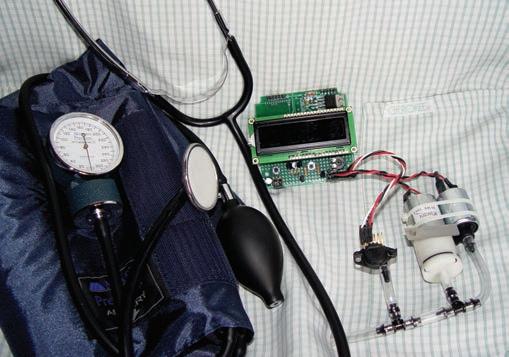
Modern electronics and embedded technologies are constantly changing the healthcare industry for the better. As engineers and electronics innovators, we’re in the position to test new ideas and even bring new healthcare-related products to the market. This month I’ll detail how an experience at a blood donation center led me to build my own microcontroller-based automatic blood pressure cuff (see Photo 1).
BLOOD PRESSURE TESTING
Last year around this time, I went to a local high school during its sponsored blood drive. Interestingly, a “bloodmobile”—which is a mobile blood donation center— was set up to handle four donors at a time. Donating has gotten rather uneventful over the years, but that day changed my outlook forever.
Typically, during the pre-donation interview, a registered nurse (RN) tests your pulse, blood pressure, and iron content (with a finger prick that for some reason always hurts more than the donation itself). If all is well, you must answer a battery of questions to ascertain whether your blood might be contaminated in any way. Well, when I visited the bloodmobile, I didn’t have to answer any questions. I was rejected for having high blood pressure.
On my way back home, many things were racing through my mind. It was clear I wasn’t going to get any work done for the rest of the day. Instead, I Googled the potential causes of high blood pressure and found: poor eating habits, smoking, physical inactivity, stress, and more. Since I don’t smoke, and I enjoy outdoor activities like running (at least during the nicer weather), it seemed like taking a good look at my diet could in fact address two of the causes with one blow. I have a penchant for fried foods and red meat. And, after a few months of decreased activity, I was tipping the scale at more than 200 lbs. It was time to change my eating habits. Photo 1—I turned a manual blood pressure cuff into an automatic cuff by adding an air pump, a solenoid release valve, a pressure sensor, and a microcontroller.
to release the pressure until you can no longer hear the blood flow anymore and again note the pressure (diastolic). Your blood pressure is normally given as systolic pressure over the diastolic pressure in millimeters of mercury (e.g., 120/80). Table 1 shows blood pressure classifications for adults.
This method of measuring blood pressure (oscillometric) has been used since the late 1800s. Recently, automatic blood pressure cuffs have been on the market for around $50. I turned a manual blood pressure cuff into an automatic cuff by adding an air pump, a solenoid release valve, a pressure sensor, and a microcontroller-based circuit (see Photo 1). As is often the case, I had to set up the basic circuitry before I could begin any actual measurements. Let’s review.
BASIC CONTROL CIRCUITRY
Besides the single analog input for a pressure sensor and two digital outputs for the pump motor and solenoid valve control, I needed some kind of user interface. As a standalone project, I required a push button input to begin a test cycle and an LCD for displaying results (see Photo 2). At the start, there was plenty about this project to uncover, so I used a serial port for information and debugging purposes. I had no idea what the sampled output would look like or even what kind of algorithm I’d need to discover the diastolic and systolic pressure points and heart rate. So I needed a way to gather and look at the data. I figured a serial port would be more effective than trying to analyze stuff displayed on a small LCD.
Figure 1 depicts my circuit. Note that everything runs from 12 V (batteries). The only air pump (MPJA’s 18831-MI) and solenoid valve (Jameco Electronics’s TAV-0829-R) I could find at my favorite distributors required 12 VDC; otherwise, I would have preferred to use 6 V. Most of the circuitry runs on 5 V because of the LCD. I found a 2 × 16 Newhaven Display NHD-0216K1Z-NS(RGB)FBW-REV1 LCD module with a RGB backlight. I hadn’t used or seen one before and was excited to try it out. A Freescale Semiconductor MPX5050 silicon pressure sensor is an integrated silicon sensor featuring on-chip signal conditioning and temperature compensation. With a 5-V input, I knew this sensor would output 0–5 for an input of 0–50 kiloPascals (kPa) or 0–375 mmHg. This covered the total range quite nicely.
The pump and valve outlets fit the 0.25”OD plastic tubing I found at a hardware store. To attach everything, I also found some “T” fittings (see Photo 1). The pump can produce up to approximately 350 mmHg at 50 mA, and the solenoid requires approximately 300 mA to hold it open. These are controlled by 2N2222 TO-92 NPN transistors.
PRESSURE TESTING
To test the pressure sensor, I needed independent control of the air pump and the solenoid valve. To do this, I created a user interface using the serial port. I knew a number of single-character commands would enable me to do everything from a terminal program running on my PC.
Commands
A(bort)
M(otor)
P(ressure)
R(esults)
T(est)
V(alve) ? (list commands)
'T' when cuff is secured above the elbow
Figure 2—The project outputs a sign-on message plus this command menu when a terminal program opens and connects to the port. The RTS output line is asserted (TTL logic low) when the serial port connection is established.
Figure 2 shows the “sign-on message,” which includes a list of the accepted commands. Single-character commands make it possible to handle all user input within the serial receive interrupt. All characters are converted to uppercase so either case is acceptable. Character recognition simply sets a corresponding bit in a request register. This register’s bits are treated as if they are push-button inputs within the main application loop. Figure 3 details the main loop services.
The application places the most emphasis on sampling pressure. This is based on a recurring timer overflow. The timer merely begins a sample conversion by setting the Go bit of the ADC. Since I am dealing with a single analog channel, I don’t have to worry about acquisition time, just conversion time. I initially set the timer overflow to 500 µs. That’s 2,000 samples per second for testing purposes. Each 10-bit sample, measured as 0–5 V, must be converted to millimeters of mercury. This is accomplished at the end of each conversion (within the analog conversion interrupt). Each bit is equal to approximately 0.4069 mmHg. To avoid working in floating point, I use a scale factor of 256. This way each bit is multiplied by 104 (256 × 0.4069) and the result is presented in the middle byte of the 3-byte result (an easy divide by 256). A sample of 200 would convert to 81 mmHg (200 × 104/256) using floating point, this would be 81.34 (200 × 0.4069). I use an unsigned word × byte routine that is less than 20 instructions to perform the task.
Refer to Figure 2 for a sense of what is happening in this application. A Microchip Technology PIC18F26K22 microcontroller has dual-level interrupts, which means I can enable high-level interrupts to interrupt lower-level functions. There are six interrupt routines used: UARTTX, UART RC, A/D conversion complete, and three timer routines. The first timer takes care of starting A/D conversion on a regular basis. A second timer gives a 1-s tick. A third timer handles the LCD LED backlight (more on this later).
I started by building the framework for this application, with each request simply returning without doing anything. I wrote request or command routines as necessary. The first command “?” included the sign-on message that also displayed the command list for the serial port. I knew this would verify the framework is working with both an
Main
Call check serial connection
Call check push buttons
R(eady) request?
N Y
Call ready
A(bort) request?
N Y
Call abort
M(otor) request?
N Y
Turn motor ON
P(ressure) request?
N Y
Call pressure R(esult) request?
N Y
Call result
T(est) request?
N Y
Call test
V(alve) request?
N Y
Turn valve ON
?(question) request?
N Y
Call sign-on
Goto Main
Figure 3—The Main loop services all the requests from either the physical buttons or the serial user input.
attached LCD and a UART. Next, I added M, V, and A command routines to start the motor, open the valve, and turn everything off, respectively. This gave me sufficient control over the hardware to display some pressure readings. Even at 38,400 bps, I can acquire data faster than I can send it out the UART. So, I chose to send every tenth pressure reading in a xxx<CR><LF> decimal format. I chose Tera Term as my user interface application on my PC. I can use it to copy data received into a text file.
A spreadsheet application (e.g., Excel) enables me to import and graph data easily. Figure 4 shows portions of the pressure data while inflating (motor on) and deflating (motor off). Note: There is a slow leak back through the air pump when the motor is turned off (this is actually beneficial, more shortly). I can quickly deflate the cuff by opening the solenoid valve (on). Abort turns off either the
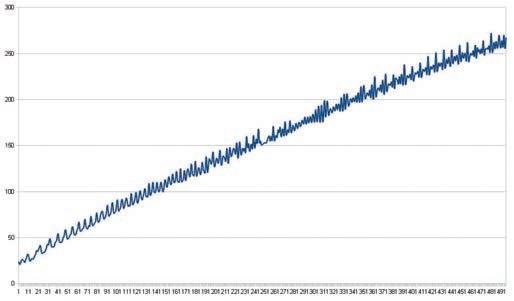
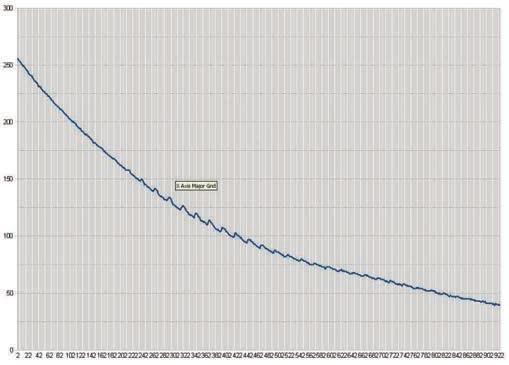
Figure 4—Portions of the pressure data while inflating with the motor on (a) and deflating with the motor off (b)
motor or the valve. The first thing you notice from the two graphs is that inflation is noisy. In fact, it looks impossible to detect any difference between pressure changes due to the rotary pumping cycle and any heartbeat pulsing. However, once off, the lack of pumping pressure changes enables blood pulsing to be seen as pressure increases while the cuff slowly deflates.
THE DETECTION ALGORITHM
It was pretty clear that with the air pump I was using I wouldn’t be able to filter out the 20 mmHg of pressure deviation I saw from the air pump and still be able to see 5 mmHg of change from the blood pulsing. So, I had to concentrate on the deflation period to obtain any information. I expected to see a range of 40 to 160 beats per minute (BPM). These numbers translated into periods of 1.5 s and 400 ms, respectively. The fastest period (400 ms) × 2 was the minimum sample rate (Nyquist) to pick out the peaks and valleys. While this would be 200 ms, I chose a faster rate so I could average out any potential noise.
I tried to work with simple byte values. If I sampled every 10 ms, I could take 255 samples before I rolled past 1 byte: that’s 2.55 s (255 × 10 ms). That was plenty of time to catch the 40 BPM. At 160 BPM, that’s 40 samples (400 ms/10 ms). I could have reduced the sampling frequency to 100 samples per second (1/10 ms), but I decided on an average of 16 samples to smooth out any funny stuff. The divide by 16 (nibble) was pretty simple and the conversion from this average to BPM was another calculation that used an unsigned word/byte routine, which again eliminated the need for floating point. BPM = seconds × sample rate/SampleCount or (6,000/SampleCount). I knew the slowest BPM, 40, would be 150 (6,000/40) and the fastest BPM, 160, would be approximately 37 (6,000/160). Any SampleCount less than 37 would be considered too fast and any SampleCount greater than 150 would be considered too slow.
Note: SampleCount is capped at 255 to keep it to a single byte, as it can’t be any slower than too slow. Actually, a too-slow count is really useful. Got any ideas?
Once the new sampling rate was changed in the application, I ran another test. I wanted to get a better look at what I was trying to discover, the point where I could detect a rise in the deflating pressure, due to a throb of blood spurting by the cuff’s constriction.
Figure 5 shows a close up of a single heartbeat. You can see the pressure falling for FallCount samples. I define FallCount as the number of consecutive samples the value drops or remains the same. Likewise, I define RiseCount as the number of consecutive samples the value rises or remains the same. Should the value change direction even once, the new direction’s count is initialized to 1. At any point in time there is both a FallCount and a RiseCount. You can see that for a complete pulse the value will fall for some FallMinimum count and then it will rise for some RiseMinimum count. I define a legal cycle as at least one FallMinimum count and then one RiseMinimum count.
Now here’s where the too slow count comes into play. When using my design, once deflation begins, I want to make sure that I have some period of time (greater than 150 samples, too slow) before detecting any pressure rise or I may not have inflated past the point of the systolic pressure. By rights, I would need to reinflate to a higher
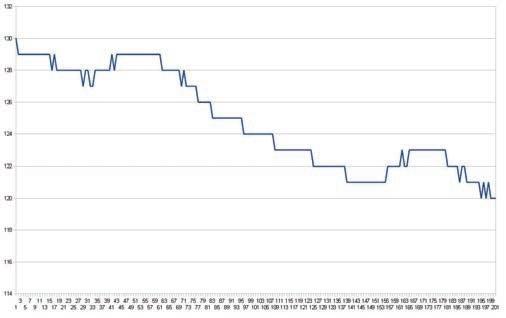
maximum pressure. So, the too-slow count can help determine if I’ve not seen a legal pulse before a too-slow count. Otherwise, the first legal pulse indicates the systolic pressure, and I save the present value (in mmHg) to the systolic register for later display. On subsequent legal pulses, the present value (in mmHg) is saved to the diastolic register for later display. This is done repeatedly until another too-slow count is found. This indicates that the heartbeat can no longer be detected and the last diastolic pressure saved is a good one.
Every time a legal pulse has been detected, the BPM is calculated. This calculation is based on the number of samples taken since the last legal pulse. Remember that a Sample Count less than 37 is considered too fast and greater than 150 is considered too slow. So, if the SampleCount is within these bounds, it is converted to BPM and saved in the BPM register for later display.
Once the pulse is lost, the test phase is just about finished. I open the valve to release the remaining pressure in the cuff until it falls to less than 20 mmHg. Then the results of the test are displayed. The results include the systolic pressure, the diastolic pressure, and the BPM count.
NO SERIAL PORT
The serial port proved to be indispensable for analyzing pressure readings and debugging the application. However, it is not necessary for the final application. As a standalone product, a single push button and the 2 × 16 character LCD are all I need. You can see from the schematic that I am using the 4-bit mode on this display. The only difference you may have noticed is the backlight has three inputs. There is one input for each of the RGB LEDs on the side-lit backlight. Each input is controlled by a PNP transistor and an associated series resistor that sets the LED current to 20 mA. By using transistors to control the current to each LED, they can be turned on or off independently. The display (characters) can now be presented in color. Since this is a transmissive display, it must be backlit with at least one color for the displayed characters to be visible. However, by varying the on times of each color, I can get more than just RGB.
This brings me back to the purpose of the third timer in this application. It is a 100-µs timer that increments PWM Count. Three registers—RedPWM, BluePWM, and GreenPWM—can be set with a value of 0 to 100. These registers are used by Timer 3 to determine whether each LED should be off (0), on (100), or have a duty cycle (1–99) associated with it. While PWMCount is less than 100, any LED will be turned off if its pulse-width modulation (PWM) value matches the PWMCount. When PWMCount reaches 100 it is cleared. While PWMCount is greater than 0, any LED will be turned on when its PWM value = PWMCount. For instance, I find that a mix of equal parts RGB gives a white light. The PWM values used will reflect a percentage of the 20-mA current that is applied (averaged) to each colored LED. With a simple call such as “SetToWhite,” the three PWM values for each color are updated with the proper mix to display the selected color.
I started out using a white backlight and changed to a color to display the results of a test. The color emphasizes the resultant value of the systolic pressure. Green indicates results in the acceptable range, yellow indicates an elevated pressure, and red indicates a result that is in the high range.
Note: This is for experimental use only and should not be used as an absolute indicator of your health. If you are concerned with having high blood pressure, please see your physician.
WHAT NOW?
Possibly the most useful function I could add to this design would be the ability to date stamp and log data. Handling multiple users might be useful too. This would add a new level of complexity to what has been fairly simple (other than determining what algorithm to use). Definitely more than a single button will be necessary to enable a user to set the time, choose users, page through data, and so forth.
We are going to see a steady rise in personal health products that aid us in between visits to our physicians. Hardly an evening in front of the television goes by without seeing a commercial about “receiving testing supplies right to your door.” Access to outpatient testing results may become paramount as an aid in a doctor’s diagnosis. While this is already standard practice in the ambulatory monitoring of targeted patients, we’re going to see more individuals taking a more active role in monitoring themselves in an attempt to take charge of their lives. I
Jeff Bachiochi (pronounced BAH-key-AH-key) has been writing for Circuit Cellar since 1988. His background includes product design and manufacturing. You can reach him at jeff.bachiochi@imaginethat now.com or at www.imaginethatnow.com.
RESOURCE
WebMD, “Hypertension/High Blood Pressure Health Center: Causes of High Blood Pressure,” www.webmd .com/hypertension-high-blood-pressure/guide/bloodpressure-causes.
SOURCES
TAV-0829-R Solenoid valve
Jameco Electronics | www.jameco.com
PIC18F26K22 Microcontroller
Microchip Technology, Inc. | www.microchip.com
Newhaven Display NHD-0216K1Z-NS(RGB)FBW-REV1 LCD and Freescale Semiconductor MPX5050 Silicon pressure sensor
Mouser Electronics (distributor) | www.mouser.com
18831-MI Mini air pump
MPJA, Inc. | www.mpja.com



PRIORITY INTERRUPT
by Steve Ciarcia, Founder and Editorial Director
Google Lunar X PRIZE
This is certainly an exciting time to be an engineer. We have seen the success NASA has had with robotic exploration, especially on nearby planets such as Mars. Contrary to everything coming from NASA in the future, however, thanks to the advances in robotics and launch vehicles, “space” will soon become the province of private enterprise and not just government. Very soon, commercial space flight will become a reality.
The Google Lunar X PRIZE (www.googlelunarxprize.org) provides a focal point for these efforts. Google is offering a $20 million prize to the first team to complete a robotic mission to the moon. The basic goal is to put a lander on the surface of the moon, have it travel at least 500 m once it’s there, and send back high-definition pictures and video of what it finds. There’s a $5 million second prize, and also $5 million in bonus prizes for completing additional tasks such as landing near the site of a previous NASA mission, discovering water ice, traveling more than 5,000 m while on the surface, or surviving the 328-hour lunar night.
When the Lunar X PRIZE registration closed in December 2010, a global assortment of 33 separate teams had registered to compete. Seven of those teams have subsequently dropped out, but there are still 26 active teams, including 11 from the U.S. The first launch is expected sometime in 2013, and there’s plenty of time before the competition ends December 31, 2015. Some teams are even planning multiple launches to improve their chances of winning.
It’s interesting to browse through the team information and see the vast diversity in the approaches they’re taking. This is the part that is most exciting from an engineering point of view. Some teams are building their own launch systems, while others are planning to contract with existing government or commercial services, such as SpaceX. There’s a huge amount of variety among the landers, too: some will roll, some will walk, and some will fly across the moon in order to cover the required distance. Each one takes a different approach to dealing with the difficult terrain on the moon, and issues such as the raw temperature extremes between blazing sunlight and black space.
This sort of diversity is a powerful driver for future development. Each approach will have its strengths and weaknesses, and there will certainly be some spectacular failures. Subsequent missions will draw on the successful parts of each prior one. Contrast this to the approach NASA has tended to take of putting all its effort into a single design that had to succeed.
It’s also interesting to consider the economics of this sort of competition. The prize doesn’t really approach the full investment required to succeed. Indeed, Google is quite up front about the fact that it probably only covers about 40%, based on other recent high-tech competitions such as the Defense Advanced Research Projects Agency’s DARPA Grand Challenge and the Ansari X PRIZE. This means the teams need to raise most of their money in the private sector, which keeps them focused on technologies that are commercially viable.
I have long been a fan of “hard” science fiction, as typified by writers such as Larry Niven, Arthur C. Clarke, and Michael Crichton. To me, hard science fiction means you posit a minimal set of necessary technologies, such as faster than light (FTL) space travel or selfaware computers/robots, and then explore the implications of that universe without introducing new “magic” whenever your story gets stuck. In particular, Larry Niven’s “Known Space” universe—particularly in the near future—includes extensive exploration of the solar system by private entrepreneurs. With the type of competition fostered by the Google Lunar X PRIZE, I see those days as being just around the corner.
The competition among these teams, and the commercial companies that arise from them, will be good for society as a whole. For one thing, we’ll finally see the true cost of getting to space, as opposed to the massive amounts of money we’ve been pouring into NASA to achieve its goals. As a public agency, NASA has many operational constraints, and as a result, it tends to be ultra-conservative in terms of risk taking. Policies that dictate incorporating backups for the backups certainly makes a space mission more expensive than the alternative.
Despite these remarks, however, I don’t mean to sound overly negative about NASA at all. It has had many spectacular successes, starting with the Mercury, Gemini, and Apollo manned space programs, as well as robotic exploration of the solar system with the likes of Pioneer and Voyager, and more recently with the remarkable longevity of the Mars rovers, Spirit and Opportunity. There have been many beneficial spin-offs of the space program and we have all benefitted in some way. We wouldn’t be where we are today without the U.S. space program. But the future is yet to be written. There are striking differences between a publicly run space program and the emerging free-market privately funded endeavors. We would do well to recognize the opportunities and the potential benefits.


