2022 began where 2021 left off: Mortgagerateswere nearhistoriclows,buyercompetitionwasfierce,andhomes weresellingatabreakneckpace,oftenwithmultiplebidsand all-cashoffers,duetopent-updemandandashortageof housingsupply,causingsalespricestosoartonewheights. Butallthatchangedafewmonthslaterasmortgagerates begantorise,addinghundredsofdollarstomonthlymortgage paymentsandcausinghousingaffordabilitytoplummettoits lowestlevelindecades.Asborrowingcostscontinuedto increase,homesalesandhomepricesbegantoslow,and aftertwoyearsofrecord-breakingactivity,thered-hothousing marketwasfinallycooling.
Sales: Pendingsalesdecreased34.5percent,finishing2022 at2,175.Closedsalesweredown30.9percenttoendtheyear at2,335.
Listings: Comparing2022totheprioryear,thenumberof homesavailableforsalewasup72.5percent.Therewere709 activelistingsattheendof2022.Newlistingsdecreasedby 11.0percenttofinishtheyearat3,421.

Bedroom Count: Increasesinsalespricesoccurredacross homesofallsizesoverthelastyear.In2022,propertieswith1 BedroomorLesssawthelargestgrowthat24.9percent.The highestpercentoforiginallistpricereceivedatsalewentto propertieswith2bedroomsat99.3percent.
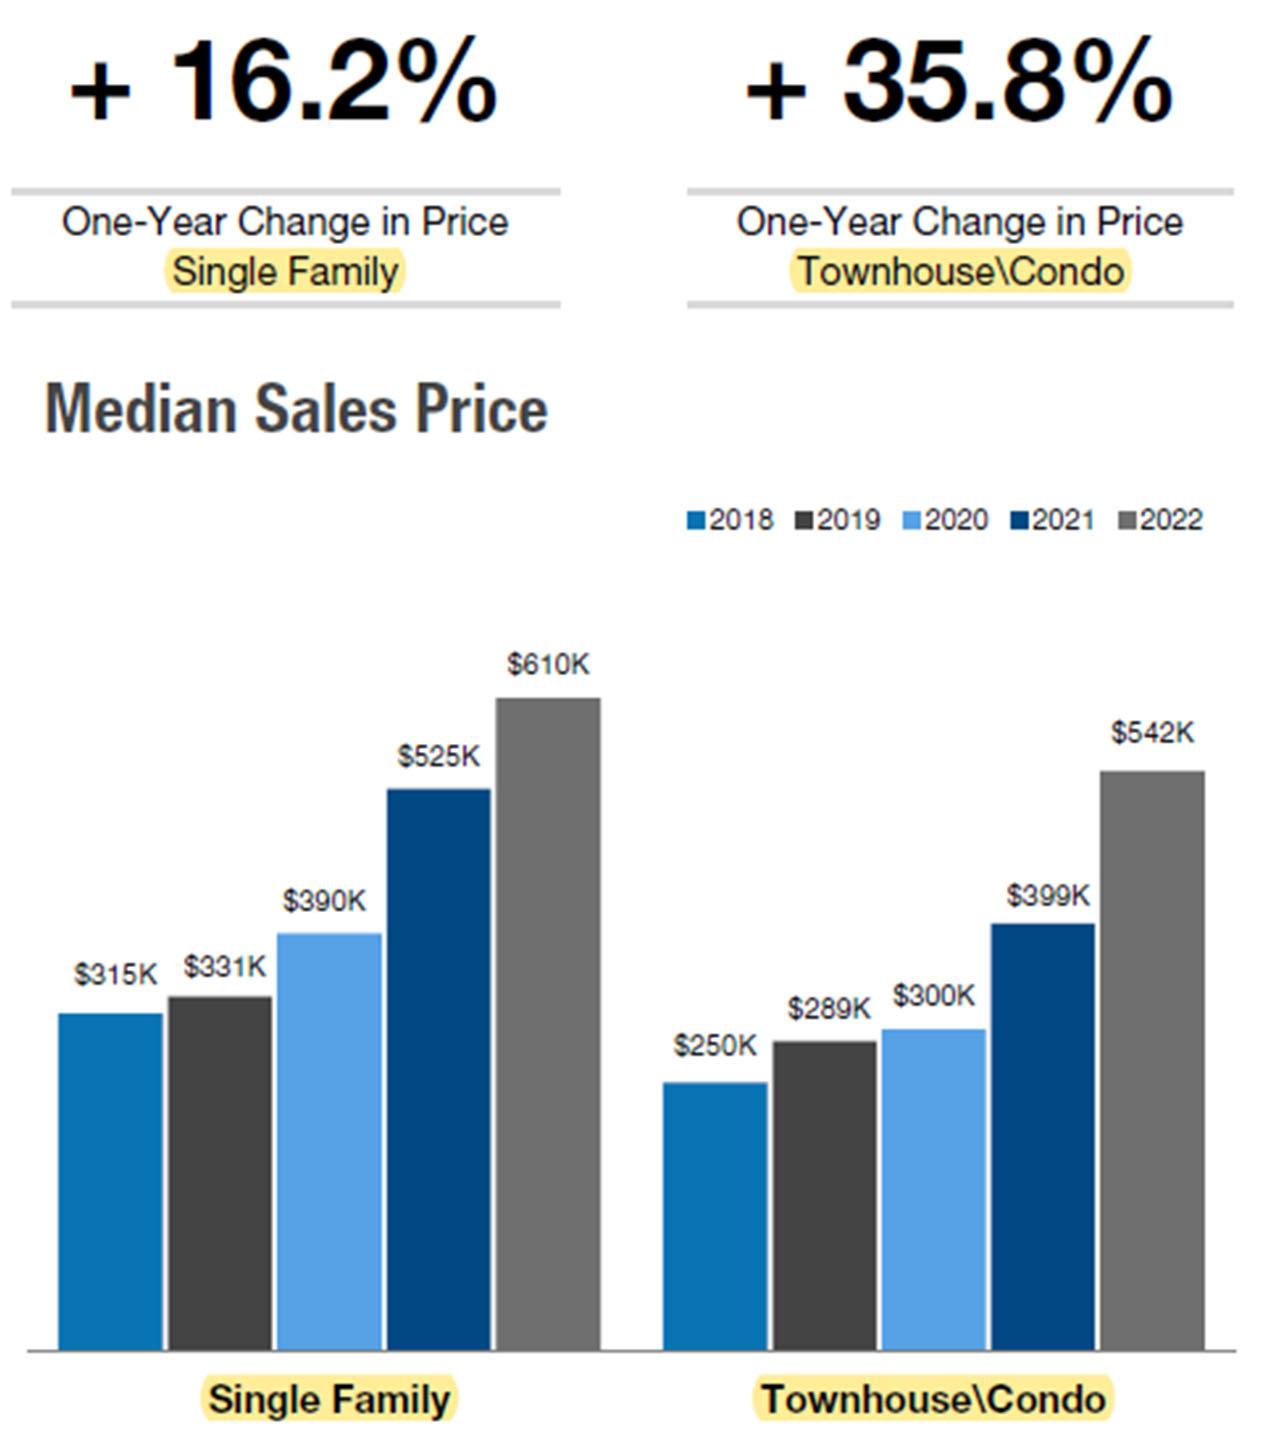
Prices: Homepriceswereupcomparedtolastyear.Theoverall mediansalespriceincreased18.5percentto$590,000forthe year.SingleFamilyhomepriceswereup16.2percentcompared tolastyear,andTownhouse\Condohomepriceswereup35.8 percent.
List Price Received: Sellersreceived,onaverage,98.6 percentoftheiroriginallistpriceatsale,ayear-over-year decreaseof1.6percent.
Homesalescontinuedtodeclinethroughoutmuchoftheyear,as affordabilitychallengestooktheirtollonmarketparticipants, forcingmanyprospectivebuyersandsellerstothesidelines.To helpoffsetrisingcosts,somebuyersmovedfrombigger,more expensivecitiestosmaller,moreaffordableareas,whileothers turnedtotherentalmarket,wherecompetitionandrentalprices surged.Asmortgageratescontinuedtoclimbandmarket conditionsshifted,manyhomeownerswerereluctanttoselltheir homes,andwithbuyerdemanddown,homebuilderseased production,furtherconstraininganalreadylimitedsupplyof housing.
Lookingaheadtothe2023,muchdependsoninflation,mortgage interestrates,andthebroaderstateoftheeconomy,although economistspredictmanyof2022’shousingtrendswillcontinue intothenewyear:homesaleswillsoften,pricegrowthwill moderate,inventorywillremaintight,andtherewillbegreater variabilitybetweenmarketsnationally,withsomeregions possiblyseeingpricedeclineswhileother,moreaffordableareas ofthecountryremaininhighdemandandexperienceprice growth.
Table of Contents 3 QuickFacts 5 PropertyTypeReview 6 BedroomReview 7 PriceRangeReview 8 AreaOverviews 9 AreaHistoricalPrices
FORRESIDENTIALREALESTATEACTIVITYINFLATHEAD,LINCOLNANDLAKECOUNTIES
CurrentasofJanuary5,2023.AlldatafromMontanaRegionalMLS.Report©2023ShowingTime.|2
2022 Annual Report for the Northwest
Montana Association of REALTORS® Service Area
Area Overviews
Total Closed Sales Change from 2021 Percent Single Family
Percent Townhouse/ Condo New Listings
Months Supply of Inventory Days on Market
Pct. of List Price Received
FlatheadCounty1,707-30.5%78.8%21.2%2,529389798.9%
LakeCounty314-31.4%94.9%5.1%449388398.7%
LincolnCounty314-32.0%98.7%1.3%443459997.0%
FlatheadCounty1,707-30.5%78.8%21.2%2,5293.89798.9% LakeCounty314-31.4%94.9%5.1%4493.88398.7% LincolnCounty314-32.0%98.7%1.3%4434.59997.0% Arlee7-50.0%100.0%0.0%133.67196.9% BigArm5-28.6%100.0%0.0%112.07598.1%
Bigfork162-41.7%78.4%21.6%263437898.5%
ColumbiaFalls175-19.7%90.3%9.7%256347398.7%
Eureka103-27.0%100.0%0.0%1303.48998.5%
Bigfork162-41.7%78.4%21.6%2634.37898.5% ColumbiaFalls175-19.7%90.3%9.7%2563.47398.7% Elmo0--0.0%0.0%40.000.0% Eureka103-27.0%100.0%0.0%1303.48998.5%
Kalispell845-28.4%86.6%13.4%1,210288199.6%
Libby114-29.2%96.5%3.5%156499996.4%
Polson158-20.6%91.1%8.9%2052.68898.3%
Kalispell845-28.4%86.6%13.4%1,2102.88199.6% Lakeside48-37.7%85.4%14.6%715.611797.5% Libby114-29.2%96.5%3.5%1564.99996.4% Pablo1-50.0%100.0%0.0%32.047109.7% Polson158-20.6%91.1%8.9%2052.68898.3%
Rollins7-22.2%100.0%0.0%72.067100.7%
Ronan50-38.3%100.0%0.0%653.39399.0%
SwanLake0--0.0%0.0%10.000.0% Troy48-14.3%100.0%0.0%744.310595.4%
WestGlacier2-60.0%100.0%0.0%73.04988.6% Whitefish401-34.7%52.9%47.1%5815.814698.4%
Whitefish401-34.7%52.9%47.1%5815.814698.4%
CurrentasofJanuary5,2023.AlldatafromMontanaRegionalMLS.Report©2023ShowingTime.|9

2022 Annual Report for the Northwest Montana Association of REALTORS® Service Area
Area Historical Median Prices
20182019202020212022
Change From 2021 Change From 2018
FlatheadCounty$315,000$336,425$385,000$527,000$625,000+18.6%+98.4%
LakeCounty$300,000$320,000$384,950$460,000$552,500+20.1%+84.2%
LincolnCounty$201,500$235,000$290,000$350,625$440,000+25.5%+118.4%
Arlee$279,500$329,000$348,000$471,500$440,000-6.7%+57.4%
BigArm$460,000$499,900$605,000$510,000$995,000+95.1%+116.3%
Bigfork$400,250$393,750$469,125$675,000$754,900+11.8%+88.6%
ColumbiaFalls$289,750$315,000$370,000$548,600$600,000+9.4%+107.1%
Elmo$0$217,500$792,000$529,500$0-100.0%--
Eureka$235,000$285,000$320,000$479,000$589,000+23.0%+150.6%
Kalispell$279,000$302,750$334,900$435,000$550,000+26.4%+97.1%

Lakeside$389,500$429,000$460,000$695,000$755,000+8.6%+93.8%
Libby$142,000$182,000$229,000$272,000$295,000+8.5%+107.7%
Pablo$242,500$125,000$145,500$222,000$170,000-23.4%-29.9%
Polson$265,000$317,000$382,500$415,000$524,700+26.4%+98.0%
Rollins$854,250$698,650$1,575,000$1,450,000$1,250,000-13.8%+46.3%
Ronan$199,250$205,000$242,500$306,000$287,500-6.0%+44.3%
SwanLake$4,600,000$331,250$180,000$541,500$0-100.0%-100.0%
Troy$199,500$246,900$301,000$350,000$392,000+12.0%+96.5%
WestGlacier$799,000$428,000$398,000$535,000$1,175,000+119.6%+47.1%
Whitefish$387,200$434,500$537,500$659,000$840,000+27.5%+116.9%
CurrentasofJanuary5,2023.AlldatafromMontanaRegionalMLS.Report©2023ShowingTime.|
Annual
REALTORS® Service Area
2022
Report for the Northwest Montana Association of


