
College and University Chief Academic Officers
A SURVEY BY INSIDE HIGHER ED AND HANOVER RESEARCH
Colleen Flaherty & Doug Lederman
Editors, Inside Higher Ed 2024 Survey of


Colleen Flaherty & Doug Lederman
Editors, Inside Higher Ed 2024 Survey of
Exceed faculty expectations and promote student success with an unrivaled level of service, flexibility and convenience.

No exam scheduling
24/7/365 live support
Low bandwidth compatibility
Anxiety-reducing student tutorials
99% resolution on support issues
University of Florida students consistently praise Honorlock for its exceptional flexibility and support, valuing its non-intrusive, fair testing approach.
Brian MarchmanFormer University of Florida Assistant Provost and Director of Distance & Continuing Education

Inside Higher Ed and Hanover Research sent survey invitations via email to 2,636 provosts, with regular reminders sent throughout the February to March 2024 field period. Hanover collected 331 fully or partially completed surveys, yielding a 13 percent response rate. The survey is an attempted census of all provosts using the most comprehensive sample information available to target all eligible U.S. colleges and universities from the Integrated Postsecondary Education Data System (IPEDS) database. The margin of error for this survey is 5.04 percent, given a total n-count of 331. Conclusions drawn from a small sample size (n<20) should be interpreted with caution. In the charts and percentages that follow, some percentages may not total 100 due to rounding.
● Two in 10 provosts (20 percent) say their institution has published a policy or policies governing the use of artificial intelligence, including in teaching and research, with those at private baccalaureate institutions and public doctoral institutions more likely than their peers from other kinds of institutions to say so. Another six in 10 provosts (63 percent) say such a policy is under development. Nearly all provosts surveyed (92 percent) say faculty and staff members at their institution have asked for additional training related to developments in generative AI, while three-quarters of provosts (78 percent) say their institution has offered training in response to faculty concerns or questions about AI within the last 18 months.
● Just one in seven provosts (14 percent) says their institution has reviewed the curriculum to ensure that it will prepare students for the rise of AI in the workplace, with provosts from the Midwest less likely than their peers from other regions to say so. Most provosts are concerned to some degree about the risk generative AI poses to academic integrity, with the plurality (47 percent) being moderately concerned, and older provosts expressing the most concern, by age. At the same time, most provosts are at least somewhat enthusiastic about AI’s potential to boost their institution’s capabilities: Just 2 percent are not at all enthusiastic. As for how institutions are using AI already, the top use from a long list is virtual chat assistants and chatbots (45 percent).
● Most provosts say they’re aware of how various campus groups are doing with their mental health. Nearly all provosts say they’re either somewhat (40 percent) or very (57 percent) aware of the general state of undergraduates’ mental health. Asked whether their institution provides training for those in leadership positions on supporting the mental health needs of their faculty and staff, nearly half of provosts (45 percent) say it has optional training.
● Regarding last year’s U.S. Supreme Court decision limiting race-conscious admissions, a majority of provosts agree (44 percent) or strongly agree (17 percent) that it will decrease student racial diversity in higher education in general. But few provosts agree (9 percent) or strongly agree (2 percent) that it will decrease student racial diversity at their own institution. As for whether their institution has curtailed its diversity and inclusion efforts beyond admissions in response to the court’s decision or to other pressure from lawmakers, one in 10 provosts says it has. Provosts at public institutions in the South are most likely to have scaled back. Training programs have been most affected.
● Seven in 10 provosts rate the state of race relations on their own campus as good (61 percent) or excellent (10 percent). As for race relations in higher ed as whole, however, just three in 10 provosts say it’s good (27 percent) or excellent (2 percent).

● Asked to rate the effectiveness of their institution at providing a quality undergraduate education, three in four provosts say it’s very effective (72 percent). More than half of provosts say their institution is very effective (57 percent) at preparing students for the world of work. More than half also say their institution is very effective (55 percent) at offering undergraduate support services beyond academic advising. On providing academic advising itself, provosts are more split on whether their institution is very effective (45 percent) or somewhat effective (48 percent). About a third of provosts each say their institution is very effective at using data to measure student outcomes (37 percent); using data to inform student success initiatives (35 percent); using data to aid campus decision-making (34 percent); and controlling rising prices for students and their families (37 percent).
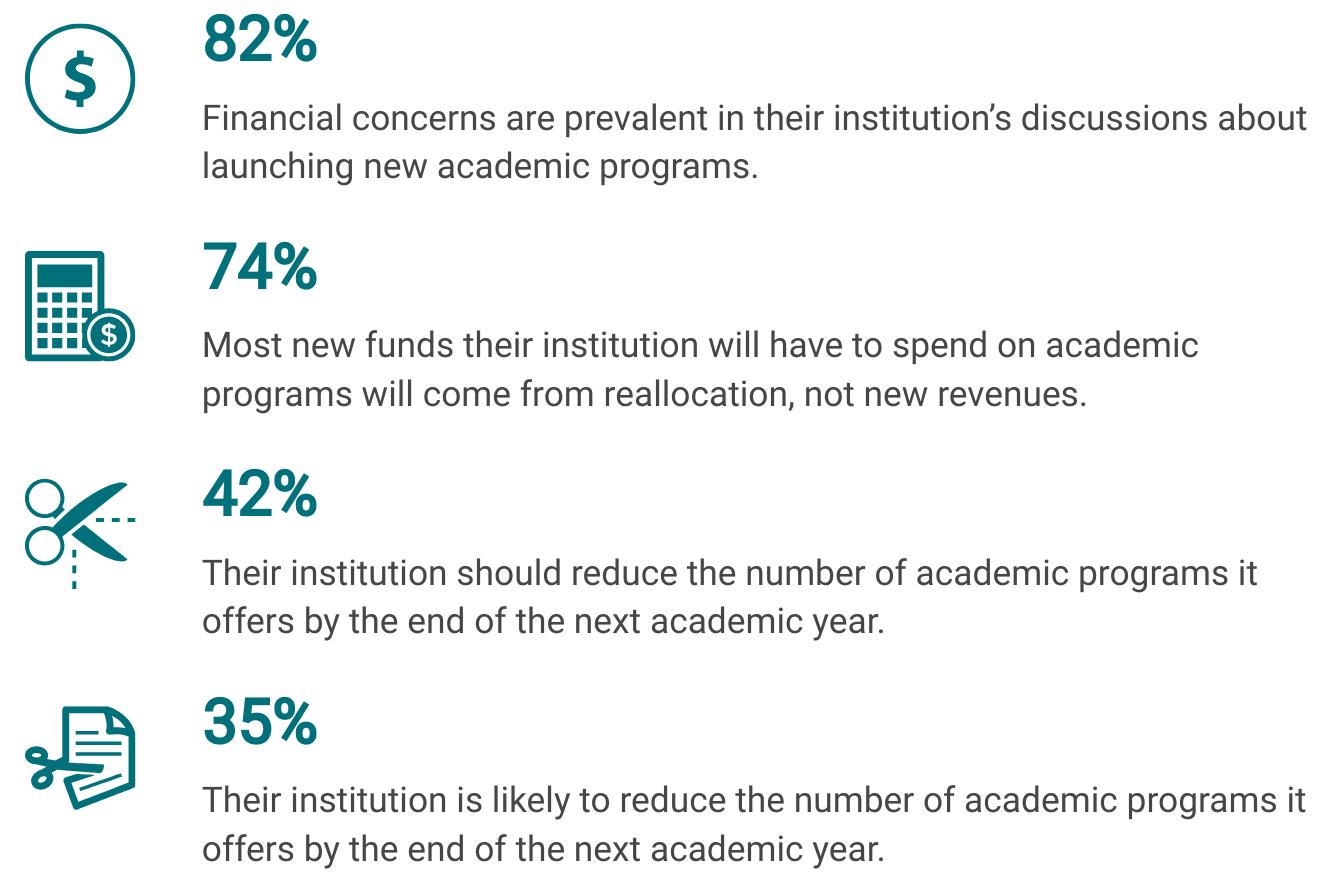
● On budgets and finances, eight in 10 provosts (82 percent) agree or strongly agree that financial concerns, including revenue, market opportunities and profit, factor in to discussions about launching new academic programs. About three in four provosts across institution types (74 percent) agree or strongly agree that most new funds that their institution spends on academic programs will have to come from reallocation, not new revenue. Not quite half of provosts (42 percent) agree or strongly agree that their institution should reduce its number of academic programs by the end of next academic year, while nearly as many (35 percent) say their institution is likely to do so by then. Provosts in the Midwest are likelier than peers elsewhere to want to make cuts.
● Based on student enrollment data, nearly six in 10 provosts (56 percent) say that students tend to prefer in-person courses over online or hybrid courses when both are offered. Three in 10 provosts (29 percent) say that students prefer online or hybrid courses. The numbers are similar for provosts on faculty preferences for teaching: 62 percent say faculty members prefer in-person courses over online or hybrid when both are offered, while 24 percent say professors prefer online or hybrid. Provosts at private nonprofit institutions are more likely than their public counterparts to report both a student and faculty preference for in-person courses. About half of provosts (53 percent) say that up to a quarter of course sections are offered online or in hybrid format.
● Two in three provosts (64 percent) agree or strongly agree that their institution is currently seeing higher-than-usual staff turnover rates. Nearly as many provosts (60 percent) agree or strongly agree that recruiting faculty members now is more challenging than it was before the pandemic. About a third each say they’re seeing higher-than-usual faculty turnover (35 percent) and faculty retirement rates (30 percent). The majority of provosts (60 percent) say their institution has made adjustments to employee compensation in light of inflation, but fewer (39 percent) say their institution is doing more now to retain and engage faculty members than it was prior to the pandemic. Provosts in the South seem more affected by faculty turnover.
● On tenure, half of provosts (50 percent) say it’s very or extremely important to the overall health of their institution, with provosts at public doctoral institutions especially likely to say so. Asked how viable tenure is within their institution—meaning how well it works and its likelihood to endure—nearly two-thirds of provosts (62 percent) say it’s very or extremely viable. At the same time, more than half of provosts (57 percent) favor long-term contracts for faculty members over the current tenure system, with those at private nonprofit master’s and doctoral institutions especially likely to say this.
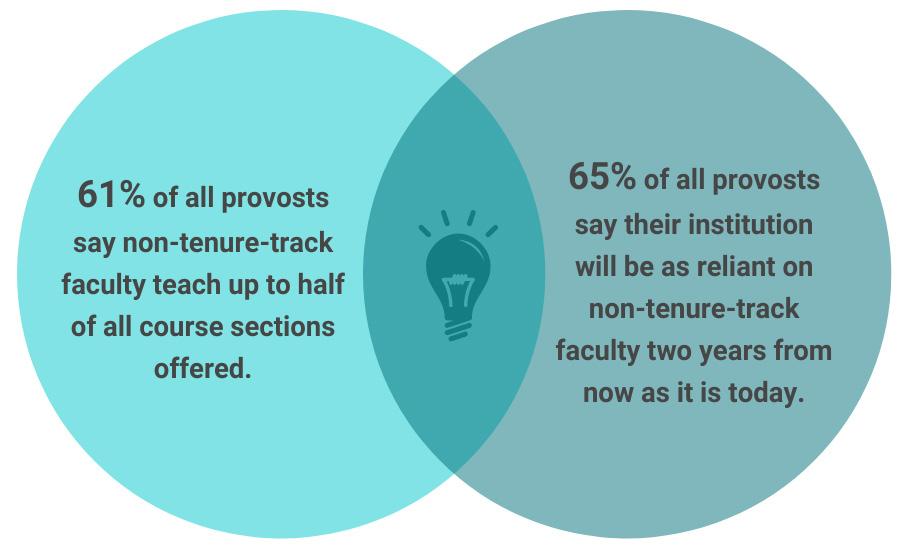
● The plurality of provosts (38 percent) say a quarter to half of course sections at their institution are taught by untenured or non-tenure-track professors. Two in three provosts (65 percent) say their institution will be about as reliant as it is today on non-tenure-track faculty members for instruction in the near future.
● Some 45 percent of provosts agree or strongly agree that U.S. graduate programs admit too many Ph.D. students, given the current job market, with provosts at public doctoral and at private baccalaureate institutions most in agreement.
● On campus speech, seven in 10 provosts (73 percent) agree or strongly agree that their institution has a clear response plan in place for addressing student complaints about professors’ speech in the classroom. About half as many provosts (36 percent) say the same for addressing student complaints about professors’ extramural speech. Three in 10 provosts (31 percent) say they have a policy or plan for addressing online trolling or other outside attacks against professors. Six in 10 provosts (61 percent) say they have a clear response plan in place for addressing complaints about individual students’ speech. Roughly the same share (58 percent) say they have a clear response plan in place for addressing complaints about student organizations’ speech. Provosts at public institutions are more likely than their private nonprofit counterparts to report having every kind of speech plan, those at public doctoral institutions most of all.
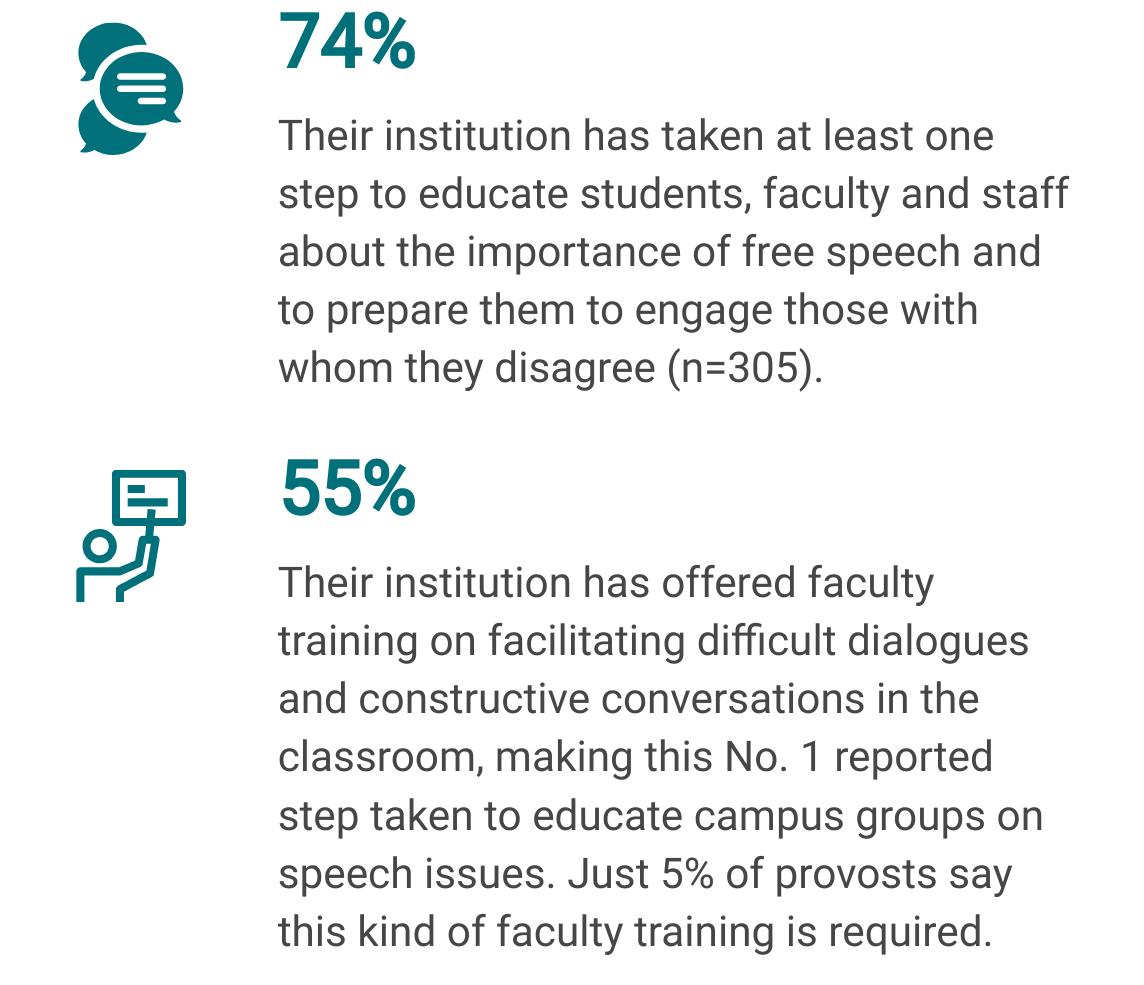
● A quarter of provosts rate the climate for open inquiry and dialogue across higher education as good (26 percent) or excellent (1 percent). Regarding their own institution, however, provosts feel differently: Nearly two-thirds rate the climate for open inquiry and dialogue on their own campus as good (52 percent) or excellent (10 percent). About four in 10 provosts agree (32 percent) or strongly agree (7 percent) that current world events have stressed their institution’s speech policies to the point that they may need to be revisited. Most institutions (74 percent) have taken at least one of a list of steps to educate students, faculty and staff about the importance of free speech and prepare them to engage with those with whom they disagree. The top action taken in this area is offering faculty training on facilitating difficult dialogues or constructive conversations in the classroom (55 percent).
● More than half of provosts say they’re extremely (28 percent) or very (25 percent) concerned about the 2024 election results affecting the climate for free inquiry at their institution, with younger provosts least likely to be highly concerned, by age.
● Nine in 10 provosts (88 percent) agree or strongly agree that high-quality undergraduate education requires healthy departments in disciplines such as English, history, political science and other liberal arts fields, with provosts at public doctoral institutions especially likely to agree. Yet a majority of provosts (67 percent) also agree or strongly agree that politicians and board members are prioritizing STEM and professional programs over those that support general education. A third of provosts (34 percent) believe that the number of students majoring in a program is an appropriate way to determine which departments to cut, with community college provosts most likely to say this.
● Regarding assessment of student learning, some eight in 10 provosts (83 percent) agree or strongly agree that faculty members at their college or university view assessment as requiring a lot of work on their parts. About two-thirds of provosts (65 percent) say their institution regularly makes changes in the curriculum, teaching practices or student services based on what it finds through assessment. About half of provosts each say the following: the growth of assessment systems has improved the quality of teaching and learning at their college (52 percent); assessment has led to better use of technology in teaching and learning at their college (48 percent); and faculty members value assessment efforts at their college (44 percent). About three in 10 provosts (29 percent), meanwhile, say that their institution’s use of student learning assessment is more about keeping accreditors and politicians happy than it is about teaching and learning. Provosts in the West are most likely to say their faculty members value assessment.
● On textbooks, three in five provosts (61 percent) agree or strongly agree that open educational resources, or freely available online materials, are of sufficiently high quality that they should be used in most general education courses. Seven in 10 provosts (70 percent) say that their institution has adopted open educational resources. About a third (34 percent) say their institution has adopted inclusive access, meaning digital-first materials plans from which students can opt out. About half as many (16 percent) say their institution has adopted equitable access, or digital-first materials typically bundled with tuition. Relatively few provosts (15 percent) say they’ve adopted none of these models.
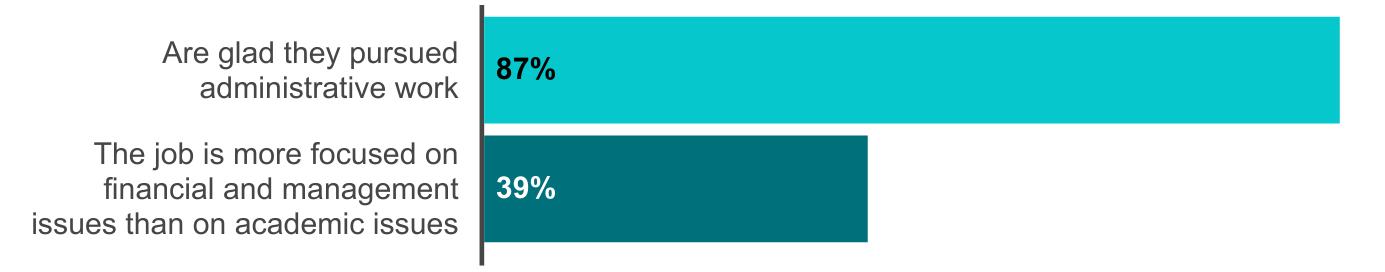
● Four in 10 provosts (39 percent) agree, strongly or somewhat, that their job is more focused on financial management than on academic issues. Still, nine in 10 provosts (87 percent) agree or strongly agree that they’re glad they pursued administrative work.
Two in 10 provosts (20 percent) say their institution has published a policy or policies governing the use of artificial intelligence, including in teaching and research. Another six in 10 provosts (63 percent) say that such a policy is under development. The remainder (17 percent) say no such policy is being drafted. This breakdown is similar to how presidents answered the same question in Inside Higher Ed’s and Hanover Research’s 2024 Survey of College and University Presidents (18 percent).
Back to provosts, by institution type, a quarter (25 percent) of those at public doctoral institutions say they’ve published a policy governing the use of AI, compared to just an eighth (13 percent) of those at associate degree-granting institutions and one-sixteenth (6 percent) of those at public master’s and baccalaureate degree-granting institutions. Among provosts at private nonprofit institutions, 30 percent at baccalaureate institutions report having published an AI use policy, as do 23 percent at doctoral and master’s institutions.
By age, younger provosts—those 40 to 49—are somewhat more likely than older ones to say their institution has developed an AI use policy (27 percent versus 19 percent each for those 50-59 and 60-69).
Nearly all provosts surveyed (92 percent) say faculty and staff members at their institution have asked for additional training related to developments in generative AI. This is consistent across institution types. About three-quarters of provosts (78 percent) say their institution has offered training in response to faculty concerns or questions about AI within the last 18 months, while most of the remainder (20 percent) say such training is forthcoming.
Provosts who indicate the following regarding their institution and AI (n=331):
Has published a policy or policies governing the use of AI, including in teaching and research
Has not yet published but is currently drafting a policy or policies governing the use of AI, including in teaching and research
Faculty or staff have asked for additional training related to developments in generative AI
Has offered training in response to faculty concerns or questions about AI within the last 18 months
Has not offered training in response to faculty concerns about AI within the last 18 months, but such training is forthcoming
Has reviewed the curriculum to ensure that it will prepare students for AI in the workplace
Has not yet reviewed the curriculum to ensure that it will prepare students for AI in the workplace, but is planning to do so
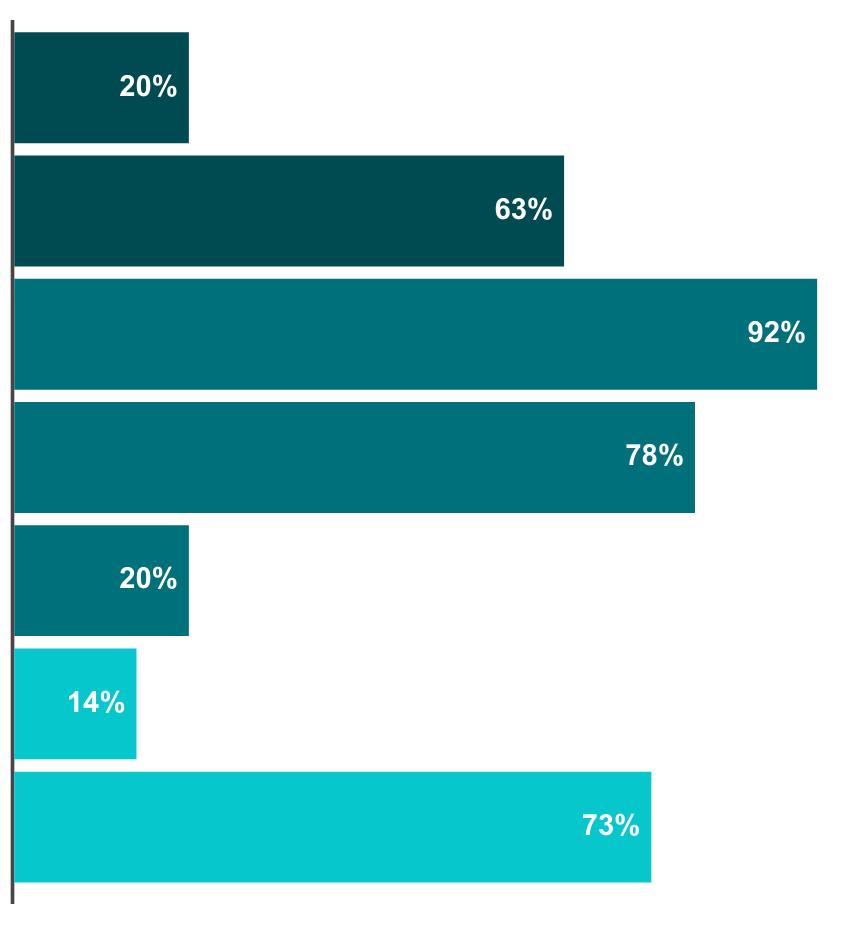
Just one in seven provosts (14 percent) says their institution has reviewed the curriculum to ensure that it will prepare students for the rise of AI in the workplace. Most remaining provosts (73 percent) say their institution is planning such a review, while another one in seven (13 percent) says no such review is planned.
Provosts whose institutions are in the West (20 percent), Northeast (18 percent) and South (15 percent) are more likely than those in the Midwest (6 percent) to have conducted a curricular review based on the rise of AI in the workplace. Provosts from the Midwest are also likeliest to say that their institution isn’t planning this kind of review (19 percent). Among provosts at public colleges and universities, those at doctoral institutions are especially likely to report having reviewed the curriculum in this way (28 percent versus 11 percent of community college and 12 percent of master’s and baccalaureate institution provosts).
Just 8 percent of provosts at private nonprofit baccalaureate institutions say they’ve conducted such a review and another quarter (25 percent) have no plans to do so.
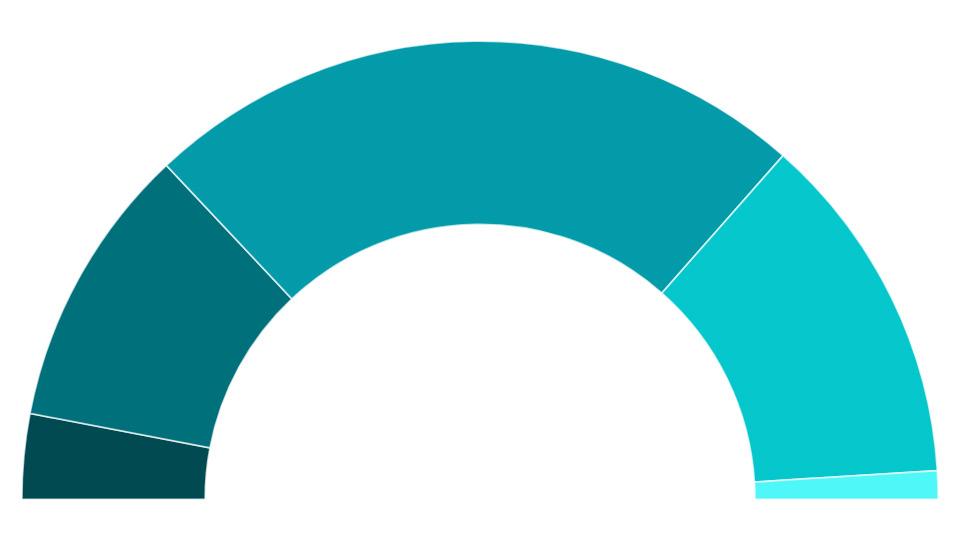
Most provosts are concerned about the risk generative AI poses to academic integrity. About a quarter are extremely (6 percent) or very (20 percent) concerned, while about half are moderately (47 percent) concerned. Another quarter are slightly concerned (25 percent) and just 2 percent are not at all concerned. This is relatively consistent across institution types, though more provosts are highly concerned at private nonprofit institutions (32 percent) than at public institutions (22 percent). Older provosts, those 60 to 69, show elevated rates of alarm, as well (33 percent are highly concerned, compared to 24 percent each for provosts 40 to 49 and 50 to 59).
Provosts express their level of concern about the risk generative AI poses to academic integrity (n=331)
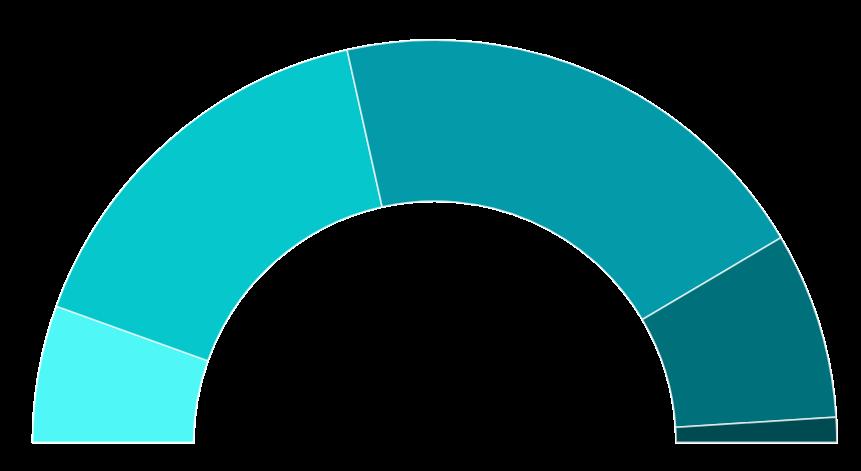
At the same time, most provosts are at least somewhat enthusiastic about AI’s potential to boost their institution’s capabilities: just 2 percent are not at all enthusiastic, while 15 percent are slightly enthusiastic, 40 percent are moderately enthusiastic, 32 percent are very enthusiastic and 11 percent are extremely enthusiastic.
Provosts express their level of enthusiasm about AI’s potential to boost their institution’s capabilities (n=329)
As for how institutions are using AI already, the top six uses from a long list are:
● Virtual chat assistants and chatbots (45 percent)
● Research and data analysis (26 percent)
● Learning Management Systems (23 percent)
● Predictive analytics to predict student performance (21 percent)
● Admissions (18 percent)
● Grading and assessment (18 percent)
About two in 10 provosts say their institution does not currently use AI.
These results mirror how presidents answered a similar question on AI in their annual survey, with the top reported AI use being chat assistants and chatbots (also 45 percent).
Provosts at private nonprofit institutions (27 percent) are significantly more likely than those at public institutions (15 percent) to say they’re not using AI. Provosts at public institutions are also much more likely to say that they’re using virtual chat assistants and chatbots (55 percent) than provosts at private nonprofit institutions (35 percent).
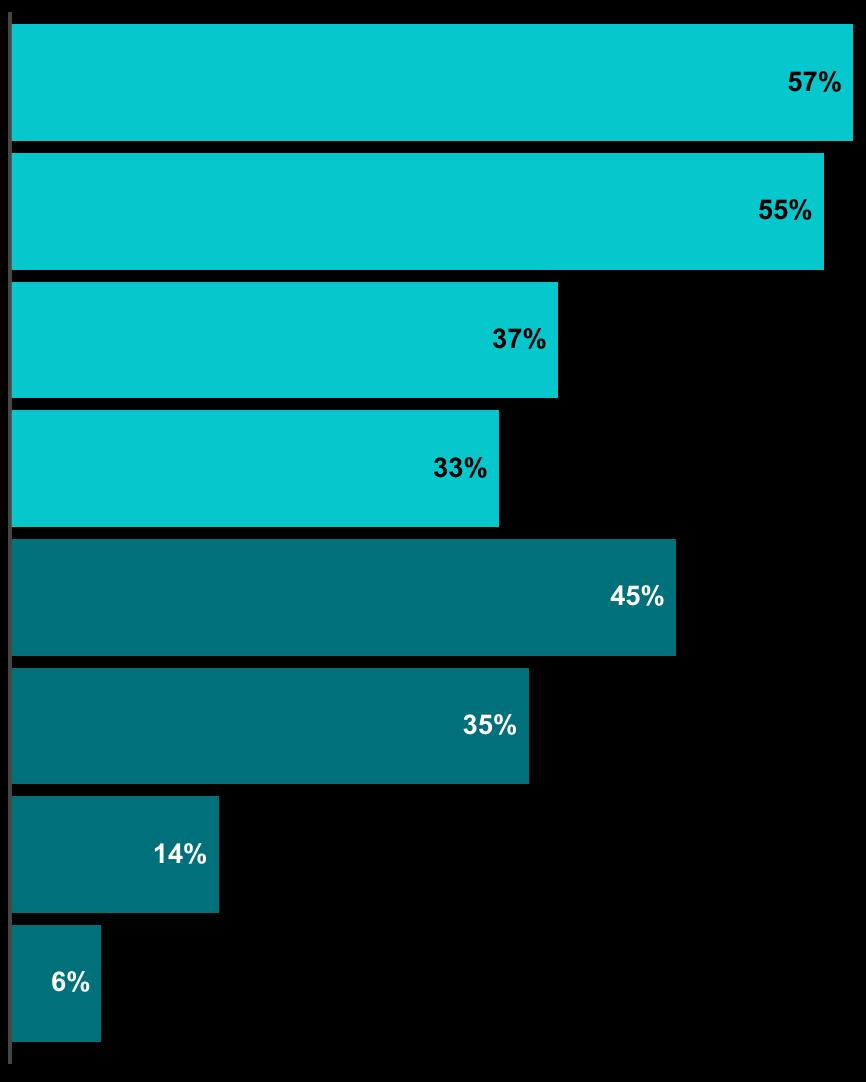
Most provosts say they’re aware of how various campus groups are doing with their mental health. Regarding undergraduates, nearly all provosts say they’re either somewhat (40 percent) or very (57 percent) aware of the general state of their mental health. On faculty members, provosts generally say they’re somewhat (40 percent) or very (55 percent) aware of the state of their mental health. On staff members, provosts say they’re somewhat (55 percent) or very (37 percent) aware. Last, on graduate students, provosts say they’re very (33 percent) or somewhat (47 percent) aware.
Asked whether their institution provides training for those in leadership positions on supporting the mental health needs of their faculty and staff, nearly half of provosts (45 percent) say they have optional training. A third (35 percent) say they don’t have any such training, representing growth since last year’s survey of provosts by Inside Higher Ed and Hanover, when half (53 percent) said their institution offered no training.
Say they’re very aware of the general state of undergraduates’ mental
Say they’re very aware of the general state of faculty members’ mental health
Say they’re very aware of the general state of staff members’ mental health
Say they’re very aware of the general state of graduate students’ mental health
Their institution offers optional training for those in leadership positions on supporting faculty and staff mental health needs
Their institution does not offer any training for those in leadership positions on supporting faculty and staff mental health needs
Their institution has both required and optional additional training for those in leadership positions on supporting faculty and staff mental health needs
Their institution requires training for those in leadership positions on supporting faculty and staff mental health needs
This year, the remainder of provosts are split between reporting having required leadership mental health training (6 percent) and having both required and additional optional training (14 percent). Provosts at private nonprofit institutions are much more likely than those at public institutions to report there is no mental health leadership training (48 percent versus 21 percent, respectively).
Asked about last year’s U.S. Supreme Court decision limiting race-conscious admissions, a majority of provosts agree (44 percent) or strongly agree (17 percent) that it will decrease student racial diversity in higher education overall. A quarter are neutral (24 percent), while the rest disagree (10 percent) or strongly disagree (4 percent) that it will.
Asked how the decision will affect their own institution, however, few provosts agree (9 percent) or strongly agree (2 percent) that it will decrease student racial diversity. The rest disagree (38 percent) or strongly disagree (26 percent). This is relatively consistent across institution types and with how presidents answered the same set of questions in their survey—both in sentiment and in viewing conditions at their own institution more favorably than at colleges and universities as a whole. This is an established phenomenon across topics and job titles in Inside Higher Ed’s and Hanover’s annual surveys.
Provosts who agree or strongly agree that last year’s U.S. Supreme Court ruling on affirmative action will decrease student racial diversity, in higher ed generally and at their institution:
Across higher ed (n=315)
At their own institution (n=310)

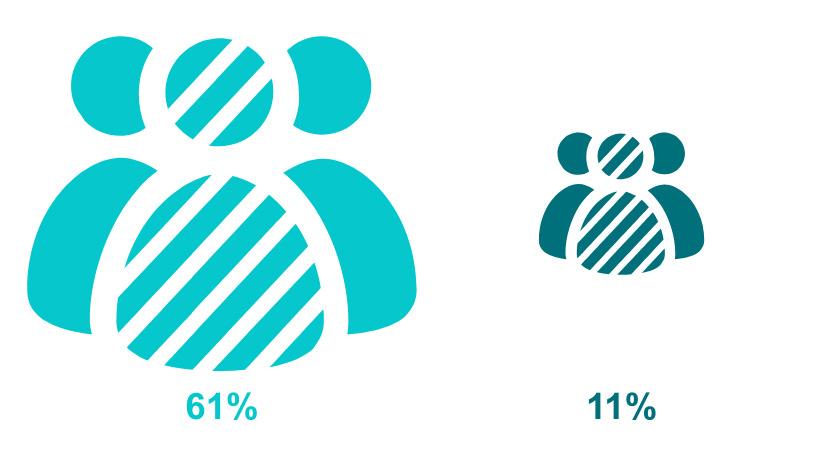
To that point, seven in 10 provosts rate the state of race relations on their own campus as good (61 percent) or excellent (10 percent). The rest say it’s fair (28 percent) or poor (2 percent). Regarding the state of race relations in higher ed generally, however, just three in 10 provosts say it’s good (27 percent) or excellent (2 percent). Most say it’s fair (60 percent) or poor (11 percent).
Provosts who say the state of race relations is good or excellent, in higher ed generally and at their institution:
Across higher ed (n=315)
At their own institution (n=310)
By race, Black and white provosts are about as likely to rate their own campus racial climate and that of higher ed as a whole good or excellent. Small sample sizes for other racial groups prevent a more thorough analysis by race.
By region, provosts in the South are both likeliest to rate general campus race relations (39 percent) and their own campus race relations (78 percent) as good or excellent.
Provosts in the West (74 percent) and South (70 percent) are more likely than those in the Midwest (56 percent) and Northeast (62 percent) to disagree that racial diversity will decrease at their institution following the court’s the ruling on affirmative action.
As for whether their institution has curtailed its diversity and inclusion efforts beyond admissions in response to the decision, or in response to other pressure from lawmakers, one in 10 (10 percent) says yes. The majority (87 percent) say no (the rest are unsure). Relatively more provosts at public institutions than private nonprofit ones have scaled back on DEI beyond admissions since last year, however (19 percent versus 3 percent, respectively). By region, provosts in the South are especially likely (25 percent) to say so (compared to 9 percent of provosts in the Midwest, 1 percent in the Northeast and 3 percent in the West). Provosts at public institutions in the South are driving most of this difference: 41 percent say they’ve scaled back DEI efforts beyond admissions in the last year.
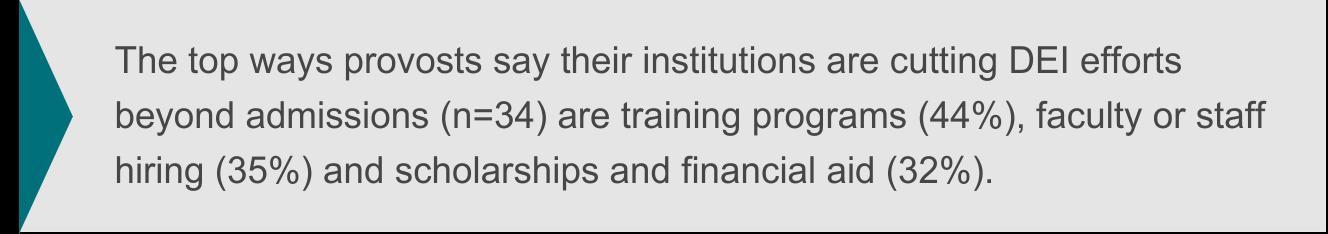
Among those institutions broadly scaling back DEI efforts, the plurality are cutting back training programs (44 percent). About a third each are cutting back faculty and staff hiring (35 percent) and scholarship and financial aid (32 percent).
Provosts who say their institution has scaled back DEI efforts beyond admissions in response to the U.S. Supreme Court’s 2023 decision on affirmative action or due to other pressure from lawmakers, by region and sector:
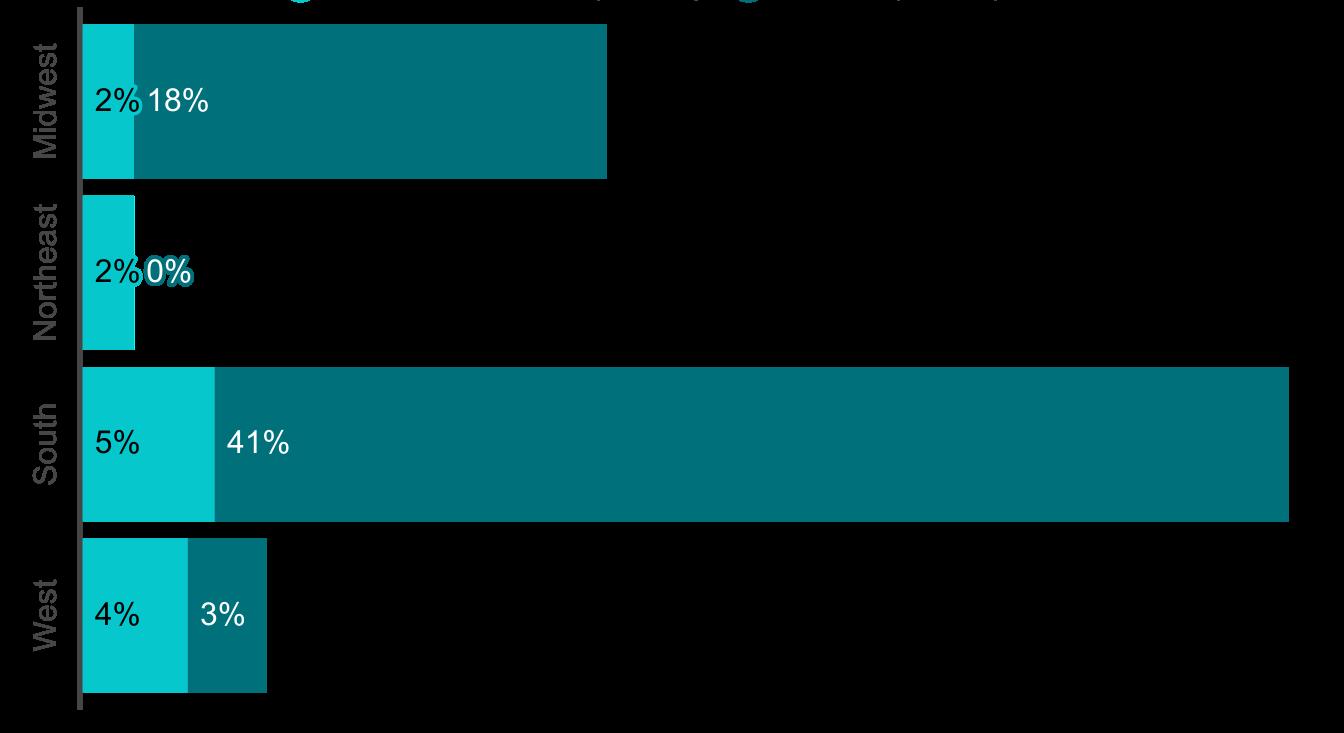
Private nonprofit (n=165)
Public (n=154)

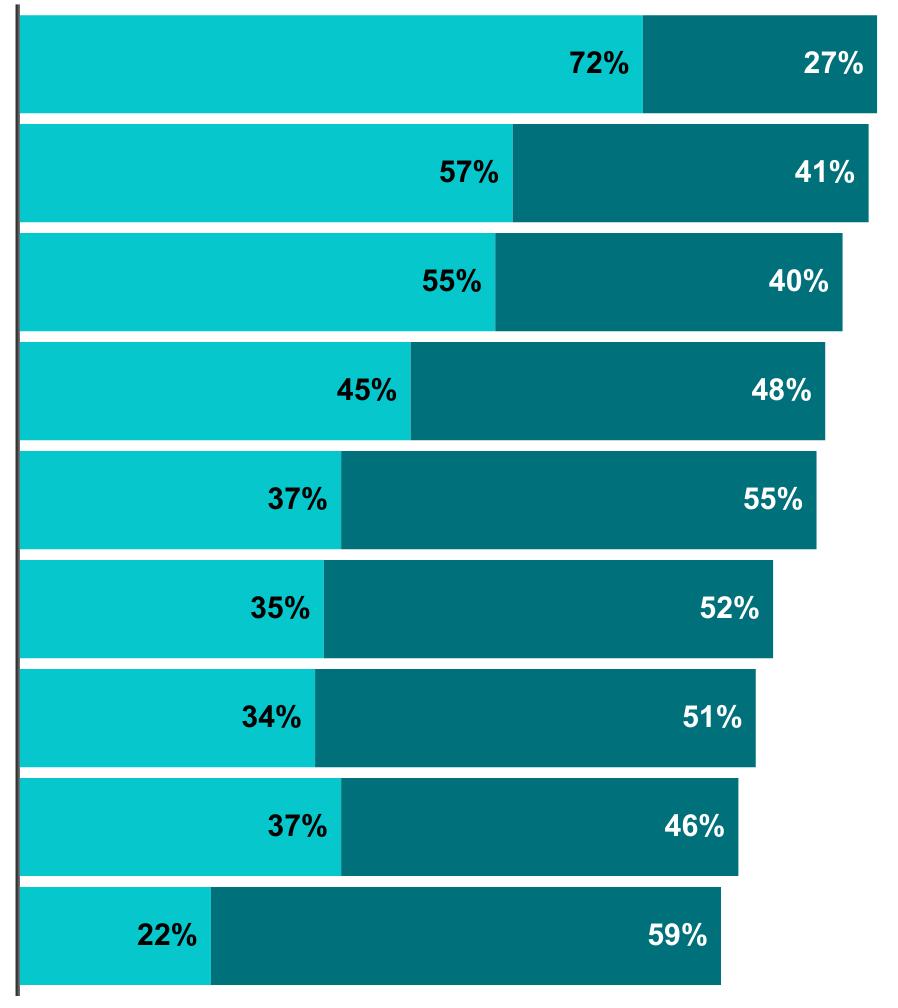
Asked to rate the effectiveness of their institution at providing a quality undergraduate education, three in four provosts say it’s very effective (72 percent), while another one in four says it’s somewhat effective (27 percent). In last year’s survey, fewer provosts (60 percent) said their institution was very effective at this fundamental mission.
In 2024, more than half of provosts say their institution is very effective (57 percent) at preparing students for the world of work, while most of the remainder say it’s somewhat effective (41 percent).
This also represents an increase from last year, when 46 percent of provosts said their institution was effective in this area.
About half of provosts this year say their institution is very effective (55 percent) at offering undergraduate support services beyond academic advising, while most of the rest say it’s somewhat effective (40 percent). On providing academic advising itself, provosts are more split on whether their institution is very effective (45 percent) or somewhat effective (48 percent).
Fewer provosts—about a third each—say their institution is very effective at the following: using data to measure student outcomes (37 percent); using data to inform student success initiatives (35 percent); using data to aid campus decision-making (34 percent); and controlling rising prices for students and their families (37 percent).
Just 22 percent of provosts say their institution is very effective at recruiting and retaining talented faculty, about the same as last year (19 percent).
Provosts who say their institution is very effective or somewhat effective at the following functions (n=321):
Very effective
Somewhat effective
Providing a quality undergraduate education
Preparing students for the world of work
Offering undergraduate support services beyond academic advising
Providing academic advising
Using data to measure student outcomes
Using data to inform student success initiatives
Using data to aid and inform campus decision-making
Controlling rising prices for students and their families
Recruiting and retaining talented faculty

Public and private nonprofit institution provosts are in relative alignment as to their general effectiveness across these areas, though those at public doctoral institutions express somewhat more confidence in how they use data than do provosts at other kinds of public institutions. For example, 93 percent of provosts at public doctoral institutions indicate they’re at least somewhat effective at using data to inform student success initiatives, compared to 82 percent of provosts at community colleges.
By region, provosts in the South are least likely (12 percent) to say that they’re very effective at recruiting and retaining talented faculty.
On budgets and finances, eight in 10 provosts (82 percent) agree or strongly agree that financial concerns, including revenue, market opportunities, and profit, factor in to discussions about launching new academic programs, with those at associate institutions least likely to say this (70 percent) and those at private doctoral and research institutions most likely to say so (91 percent). About three in four provosts across institution types (74 percent) agree or strongly agree that most new funds that their institution spends on academic programs will come have to come from reallocation, not new revenue.
Fewer than half of provosts (42 percent) agree or strongly agree that their institution should reduce its number of academic programs by the end of next academic year, while nearly as many (35 percent) say their institution is likely to do so by then. By region, provosts in the Midwest are more likely to report that their institution should reduce the number of academic programs it offers (48 percent). Provosts at private nonprofit master’s and doctoral institutions are most likely to want to cut academic programs (58 percent) and those at public master’s and baccalaureate institutions are least likely to want this (29 percent).
Provosts who agree or strongly agree with the following on budgets and finances (n=317):
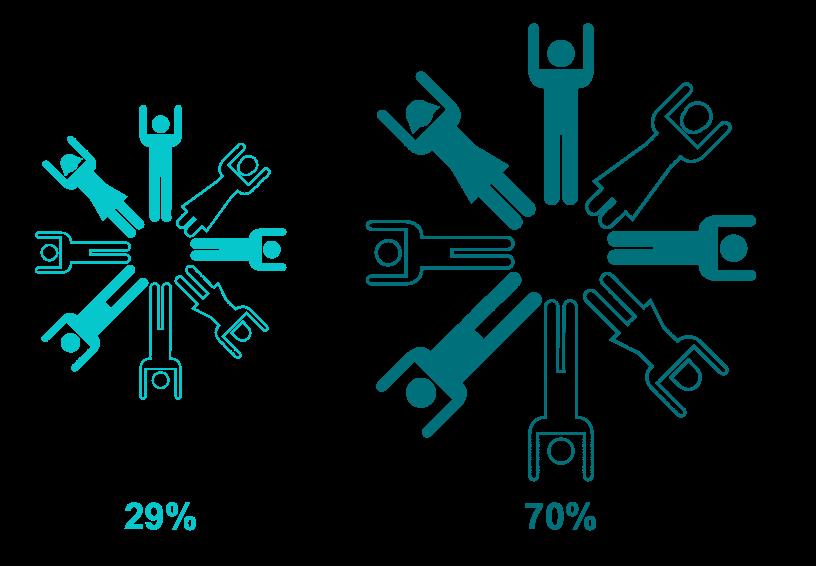
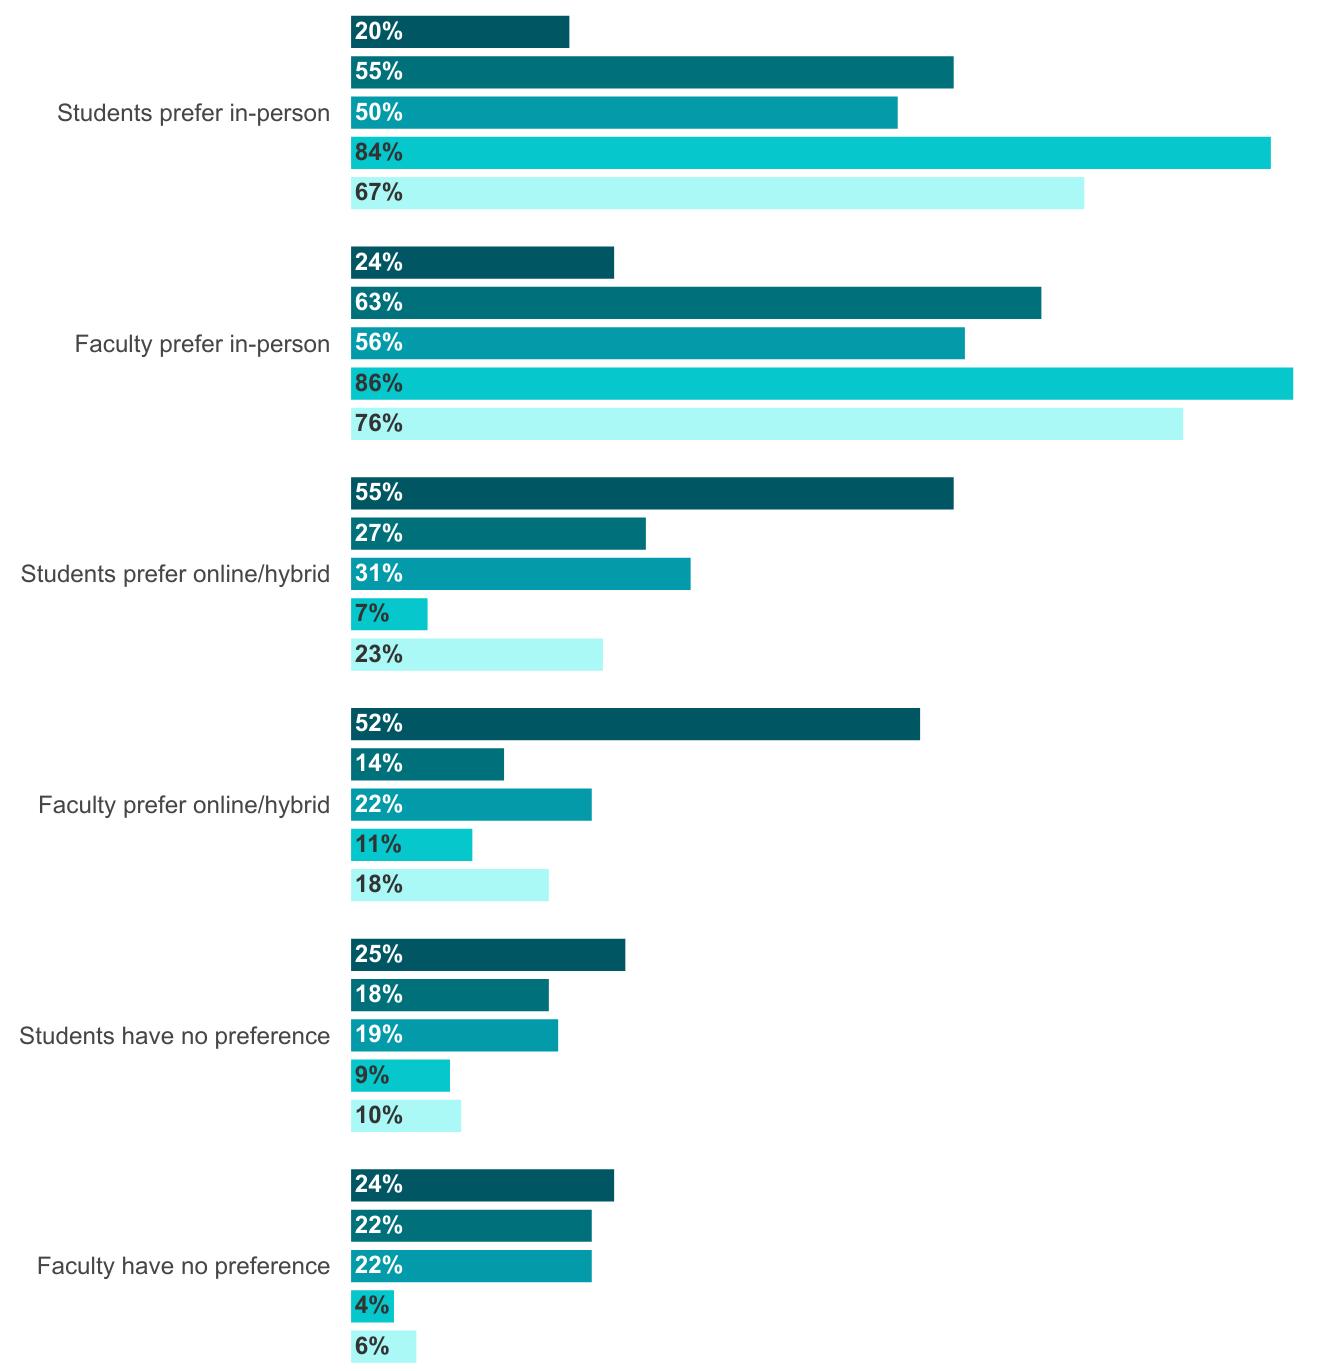
Nearly six in 10 provosts (56 percent) say that based on enrollment data, students tend to prefer inperson courses over online or hybrid courses when both are offered. Three in 10 provosts (29 percent) say that students prefer online or hybrid courses over in-person ones. The rest (15 percent) say students have no preference. The numbers are similar for provosts on faculty preferences for teaching: 62 percent say faculty members prefer in-person courses over online or hybrid when both are offered while 24 percent say they prefer online or hybrid, and 14 percent say faculty members have no preference.
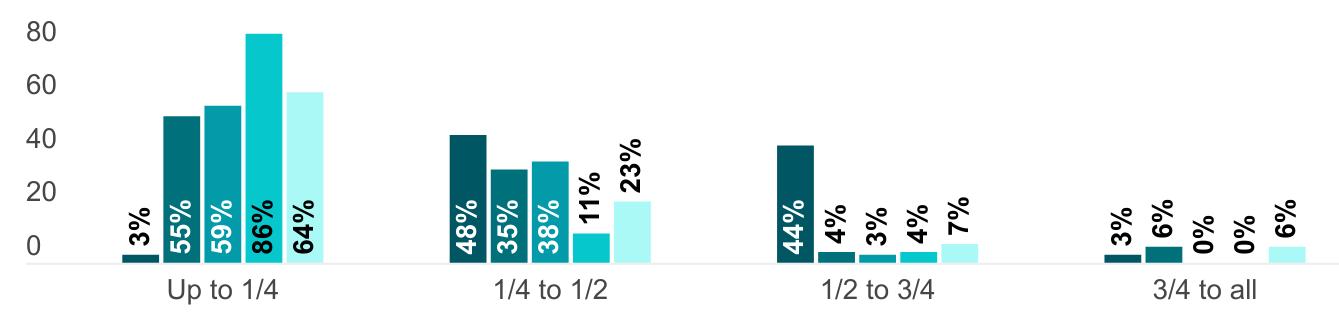
Provosts say what share of their institution’s courses are offered online or in hybrid format, by institution type:
By region, provosts in the West (44 percent) and South (36 percent) are most likely to say that students prefer online or hybrid courses. Provosts in the Midwest and Northeast (both 68 percent), meanwhile, are most likely to say that faculty members prefer teaching in person. Younger provosts (age 40 to 49) are also more likely than older ones to say that both students (44 percent) and faculty members (36 percent) prefer online/hybrid courses.
By sector, provosts at private nonprofit institutions are significantly more likely than their public counterparts to report a preference for in-person courses, both among students (75 percent versus 38 percent, respectively) and faculty members (80 percent versus 43 percent). And among public institution provosts, in particular, those at associate degree-granting institutions are most likely to say that both students (55 percent) and faculty (52 percent) prefer online or hybrid courses to in-person courses when both are offered.
About half of provosts (53 percent) say that up to a quarter of their course sections are offered online or in hybrid format, while 28 percent say between a quarter and half of course sections are offered online or in hybrid format. Few provosts report that up to three-quarters (14 percent) or all (4 percent) of their courses are offered this way. Just 25 percent of provosts at private nonprofit institutions report that more than a quarter of courses are offered online, compared to 66 percent of public institution provosts. Nearly all provosts at community colleges (95 percent), in particular, say that more than a quarter of classes are offered online or in hybrid format.
Provosts who say students and faculty tend to prefer the following course modalities when both are offered, by institution type:
Two in three provosts (64 percent) agree or strongly agree that their institution is currently seeing higher-than-usual staff turnover rates. Nearly as many provosts (60 percent) agree or strongly agree that recruiting faculty members now is more challenging than it was prior to the pandemic, while about a third each say they’re seeing higher than usual faculty turnover rates (35 percent) and higher-than-usual faculty retirement rates (30 percent).
Three in five provosts (60 percent) say their institution has made adjustments to employee compensation in light of inflation, but just two in five (39 percent) say their institution is doing more now to retain and engage faculty members than it was prior to the pandemic.
Provosts who agree or strongly agree with the following on their institution’s faculty and staff retention, by sector:
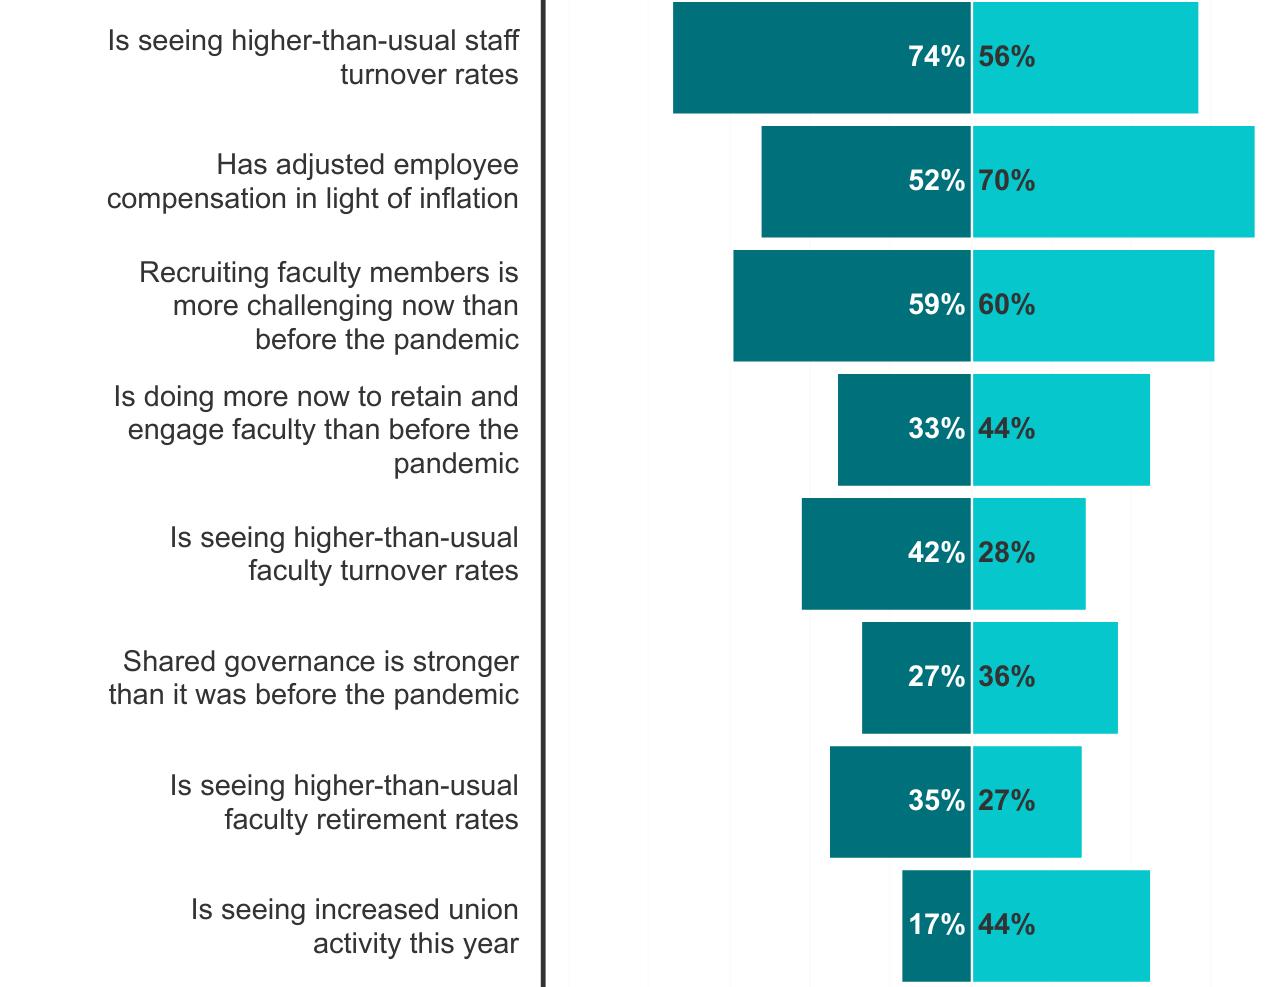
Provosts at private nonprofit institutions are more likely to report seeing increased turnover than their public counterparts, both in terms of staff (74 percent versus 56 percent, respectively) and faculty (42 versus 28 percent). Provosts at private nonprofit institutions are also less likely to say they’ve made recent changes to employee compensation (70 percent versus 52 percent of public institution provosts) and that they’re doing more now to retain and engage faculty (44 percent versus 33 percent).
By region, provosts in the South are most likely to say they’re seeing increased faculty turnover (45 percent) and to say that recruiting faculty members is now more challenging than it was before the pandemic (71 percent). Provosts in the South are also least likely to say they’ve made changes to employee compensation (51 percent).
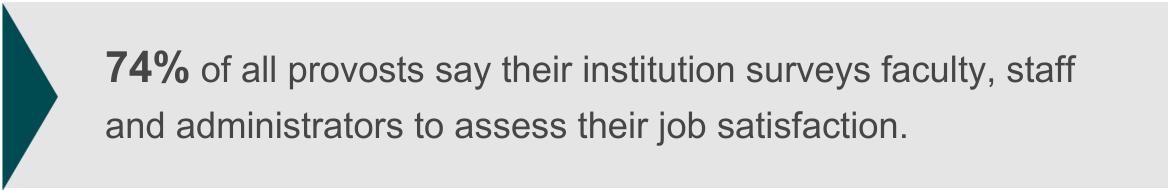
Three in four provosts (74 percent) say their institution surveys faculty, staff and administrators to assess their job satisfaction, with public institution provosts more likely to say so than private nonprofit ones (79 percent versus 68 percent, respectively.) Among public institution provosts, those at doctoral institutions are most likely to survey their employees in this way (91 percent). By region, provosts in the Northeast are least likely to report such surveying (62 percent).
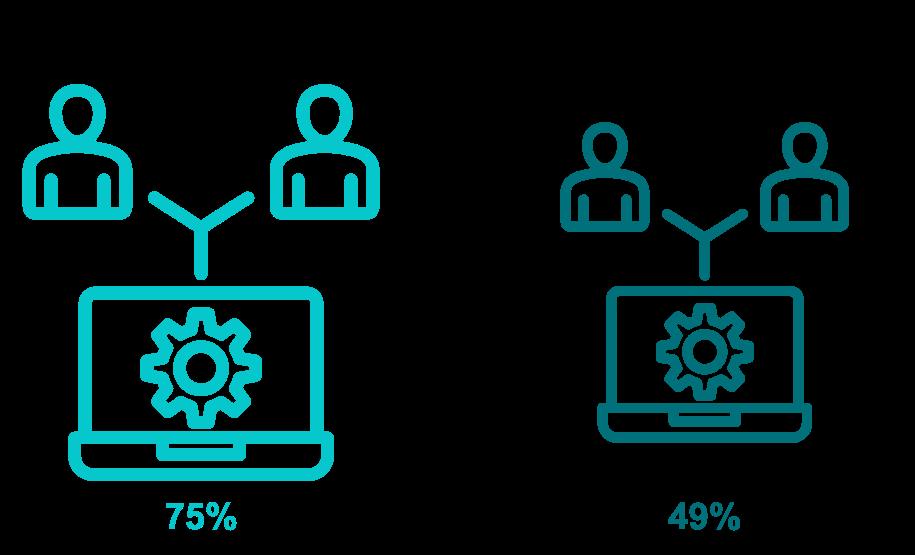
About half of provosts (49 percent) say they’ve altered their employment policies in ways that give employees more latitude to work remotely full-time since the pandemic. By region, provosts in the South are least likely to say they’ve done this (39 percent). Three in four provosts altogether (75 percent) say they’ve altered their employed policies in ways that give employees more latitude to work remotely part-time since the pandemic. Again, provosts in the South are least likely to say this (62 percent). Provosts at public doctoral universities are most likely to have allowed flexibility part-time (97 percent versus 59 percent of provosts at community colleges and 80 percent at public master’s and baccalaureate institutions). For additional context, about six in 10 presidents in their recent survey said that up to a quarter of their faculty members and non-faculty staff are working in flexible, hybrid or remote arrangements this spring.
Provosts who say their institution has altered its employment policies to allow more remote work, part-time and full-time, since the pandemic (n=317):
Three in 10 provosts (30 percent) agree or strongly agree they’re seeing increased union activity on their campus this academic year. By region, provosts in the Northeast (47 percent) and West (42 percent) are most likely to report increased union activity on their campus.
Just about the same share (31 percent) say shared governance is stronger than it was before the pandemic.
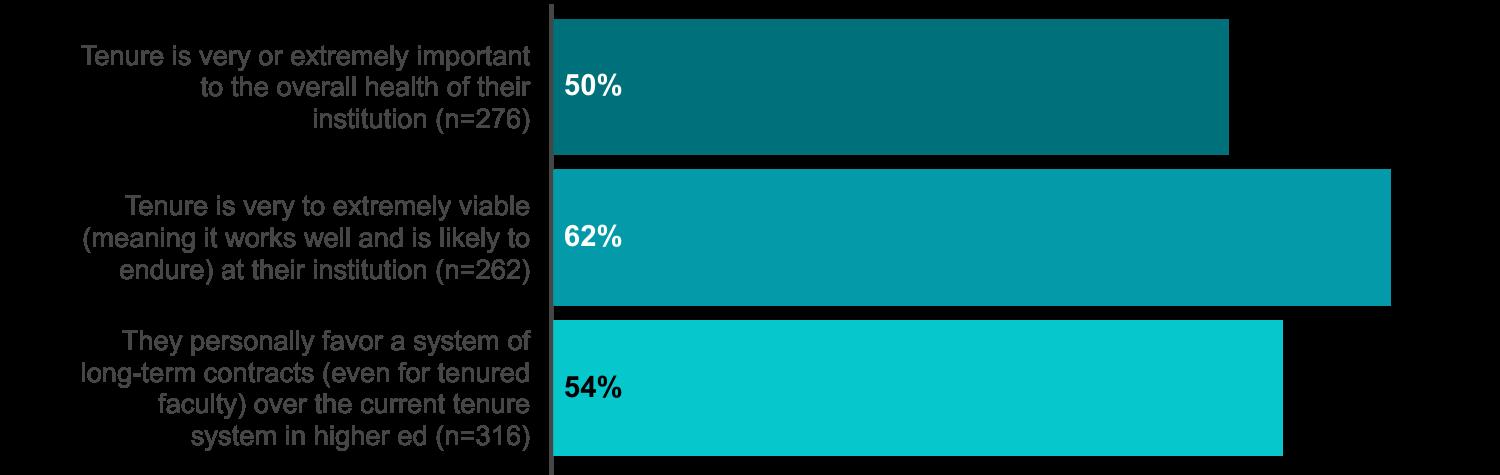
On tenure, half of provosts (50 percent) say it’s very or extremely important to the overall health of their institution. About a quarter (22 percent) say tenure is moderately important and the rest deem it slightly (11 percent) or not at all (17 percent) important.
Asked how viable tenure is within their institution—meaning how well it works and its likelihood to endure—nearly two-thirds of provosts (62 percent) say it’s very or extremely viable. Some 18 percent say it’s moderately viable, 9 percent say it’s somewhat viable and 11 percent say it’s not at all viable. Provosts at public and private nonprofit institutions are in relative agreement on these points, though provosts at private doctoral and master’s institutions are less likely than those at private baccalaureate institutions to say both that tenure is highly important (45 percent versus 61 percent, respectively) and highly viable (50 percent versus 72 percent). By region, provosts in the Northeast are most likely to say that tenure is highly viable (75 percent).
Provosts are split on support for a system of long-term faculty contracts over the existing tenure system in higher education, with 54 percent favoring this idea and 46 percent opposing it. Among private nonprofit institution provosts, those at doctoral and master’s institutions are especially likely to favor long-term contracts over the existing tenure system (67 percent, versus 44 percent of provosts at private baccalaureate institutions).
Among provosts at public institutions, however, those at doctoral institutions are the least likely to favor long-term contracts over the current tenure system (41 percent versus 54 percent of community college provosts and 53 percent of those at master’s and baccalaureate institutions).
Provosts aged 40 to 49 (60 percent) and those 50 to 50 (57 percent) are also likelier to favor long-term contracts over the current tenure system than are provosts 60 to 69 (46 percent). By region, provosts in the South (45 percent) are less likely to favor long-term contracts over tenure than are provosts in the Northeast (62 percent).
Provosts who say the following on faculty tenure:
A plurality of provosts (38 percent) say a quarter to half of all course sections are delivered by instructors who are not tenured or on the tenure-track. One in four provosts (23 percent) says up to a quarter of courses. The rest say half to three-quarters (16 percent) or three quarters to all courses (20 percent). Two in three provosts (65 percent) say their institution will be about as reliant as it is today on non-tenure-track faculty members for instruction in the next two years to near future. About a quarter (23 percent) say they’ll be more reliant while 11 percent say they’ll be less reliant.
Private nonprofit institution provosts are more likely than their public counterparts to say they have less than a quarter of course sections taught by non-tenure-track faculty (31 percent versus 16 percent, respectively). Among public institution provosts, in particular, those at community colleges are most likely to report (29 percent) that non-tenure-track instructors are teaching three-quarters to all of their course sections. By region, institutions in the South are also most likely to report that three-quarters to all of their course sections are taught by non-tenure-track professors (34 percent).
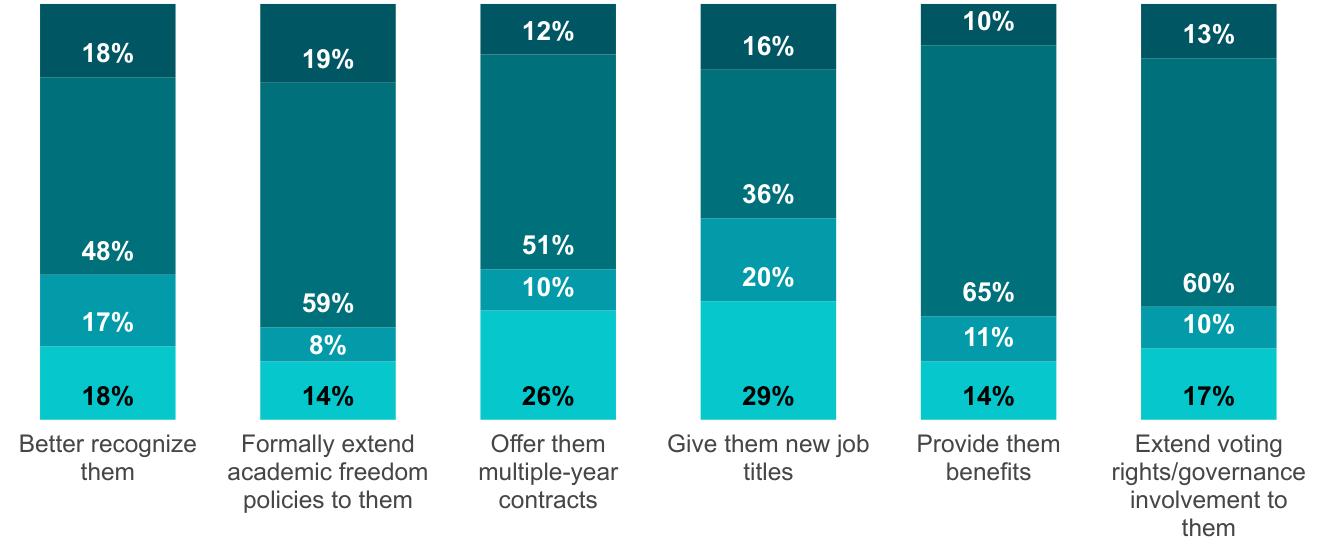
The following shares of provosts say their institution has done the following for non-tenure-track faculty:
● Provided benefits: 65 percent
● Offered faculty voting rights/involvement in shared governance: 60 percent
● Formally extended academic freedom policies to non-tenure-track faculty: 59 percent
● Offered multiple-year contracts: 51 percent
● Offered better recognition of those whose duties focus on teaching: 48 percent
● Offered new job titles: 36 percent
Most provosts indicate their institution has at least considered taking the above steps.
Provosts who say whether their institution has considered doing or done the following for non-tenure-track faculty (n=311): Has not considered Has considered Has done Unsure/doesn’t apply
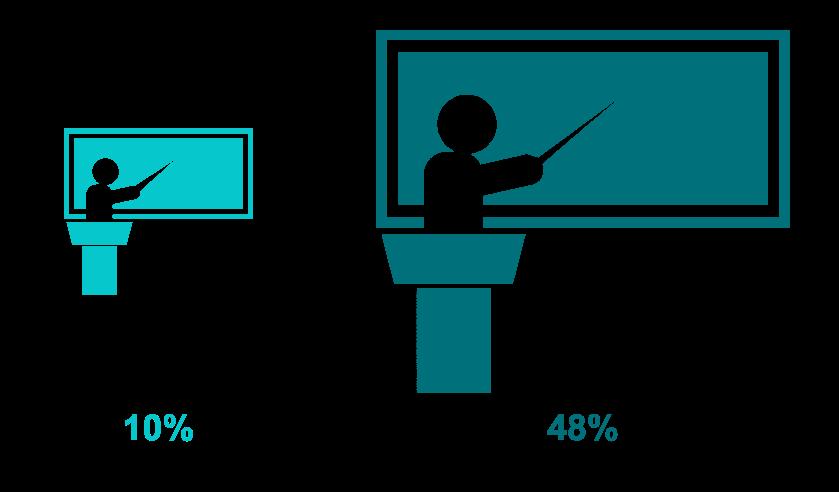
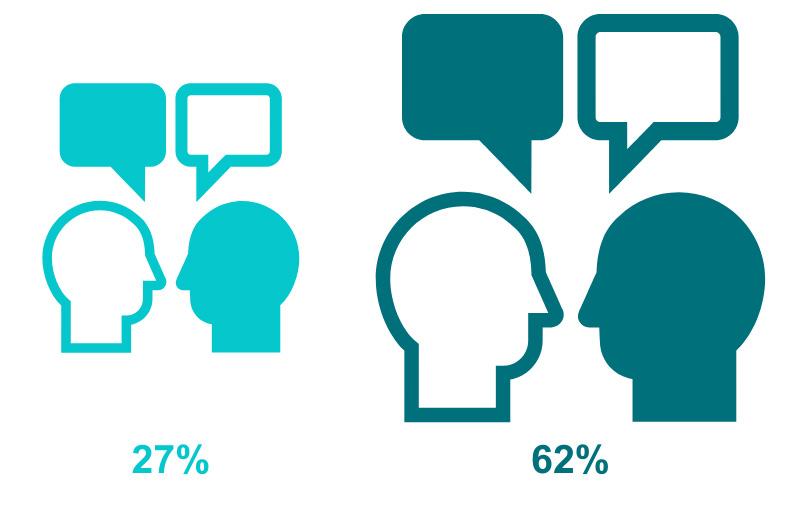
Asked about their beliefs on faculty duties at their institution, 48 percent of provosts indicate that teaching is much more important. Another 32 percent say teaching is more important than research and 15 percent say teaching and research are equally important. Just 5 percent say research is more important (4 percent) or much more important (1 percent) than teaching.
Asked the same question about higher education as a whole, a much larger share of provosts (44 percent) say that teaching and research are equally important. Unsurprisingly, provosts at both public doctoral and private master’s or doctoral institutions are more likely than those at other kinds of institutions to say that research matters at least as much as teaching, with just 13 percent of public doctoral institution provosts, for instance, saying that teaching is more or much more important than research at their institution.
Provosts who believe that teaching is much more important than research, in higher ed generally and at their institution:
Across higher ed (n=310)
At their own institution (n=311)
Nearly half of all provosts agree (33 percent) or strongly agree (13 percent) that graduate programs at higher education institutions in the U.S. admit more Ph.D. students than they should given the current job market. Another third (33 percent) neither agree nor disagree while the rest disagree (16 percent) or strongly disagree (5 percent). Provosts at public doctoral institutions are especially likely to agree or strongly agree that Ph.D. programs admit too many students (61 percent). Just 42 percent at private doctoral and master’s institutions agree or strongly agree, however, compared to 59 percent of baccalaureate private provosts. By age, younger provosts (40 to 49) are less likely to agree or strongly agree (38 percent) that Ph.D. programs admit too many students than are older provosts (46 percent of those 50 to 59 and 48 percent of those 60 to 69).
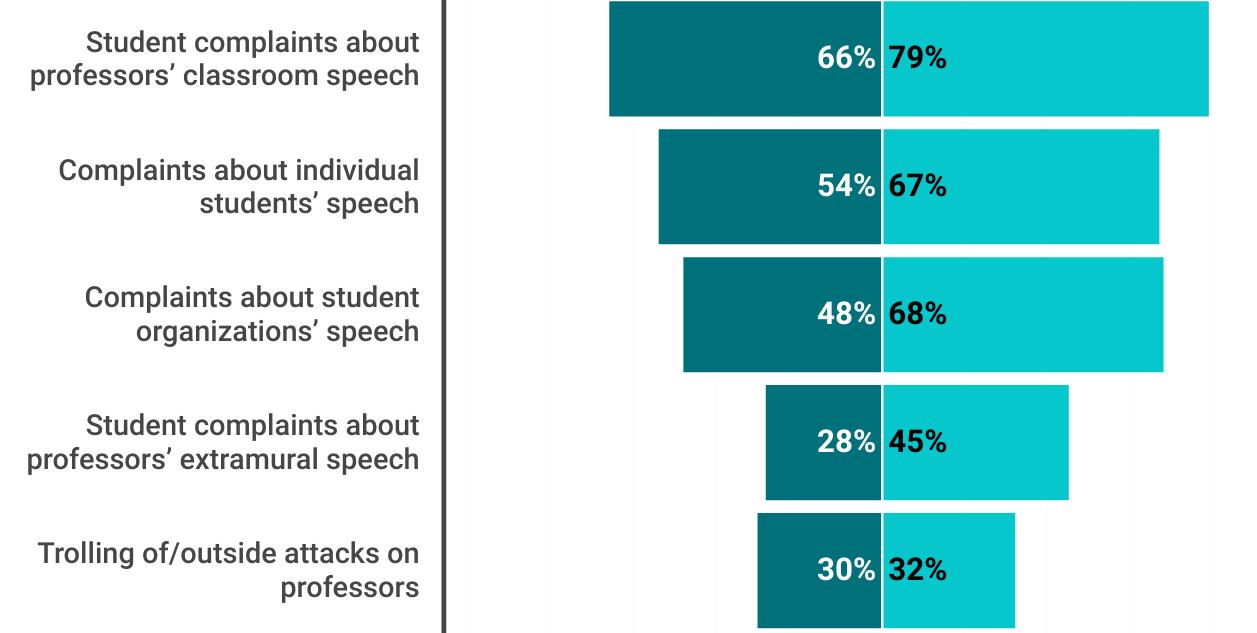
On campus speech, seven in 10 provosts (73 percent) agree or strongly agree that their institution has a clear response plan in place for addressing student complaints about professors’ speech in the classroom. About half as many provosts (36 percent) say the same for addressing student complaints about professors’ extramural speech. Three in 10 provosts (31 percent) say they have a policy or plan for addressing online trolling or other outside attacks against professors.
Six in 10 provosts (61 percent) say they have a clear response plan in place for addressing complaints about individual students’ speech. About the same share (58 percent) say they have a clear response plan in place for addressing complaints about student organizations’ speech.
Provosts at public institutions (79 percent) are more likely than their private nonprofit counterparts (66 percent) to say that they have a clear response plan for addressing student complaints about professors’ classroom speech. Public institution provosts are also significantly more likely to say that they have a response plan for addressing complaints about individual students’ speech (67 percent versus 54 percent, respectively), complaints about student organizations’ speech (68 percent versus 48 percent) and for addressing student complaints about professors’ extramural speech (45 percent versus 28 percent).
Provosts who agree or strongly agree that their institution has a clear response plan or policy in place for addressing the following speech issues, by sector:
Private nonprofit (n=154)
Public (n=145)
By region, provosts in the West are especially likely to have a clear response plan for addressing student complaints about classroom speech (82 percent). They’re also most likely to have a response plan in place for addressing student complaints about professors’ extramural speech (48 percent).
Provosts at doctoral institutions are likelier than their peers at associate and master’s or baccalaureate institution to have every kind of speech response plan. For example, 81 percent of public doctoral institutions have a policy in place for addressing complaints about student organizations’ speech, versus 65 percent each for associate and master’s or baccalaureate public nonprofit institutions.
As for how provosts rate the climate of open inquiry and dialogue in higher education generally, a quarter rate it good (26 percent) or excellent (1 percent). Half (49 percent) rate it fair, while the rest rate it poor (20 percent) or very poor (4 percent).
Regarding their own institution, however, provosts feel differently: Nearly two-thirds rate the climate for open inquiry and dialogue on their own campus as good (52 percent) or excellent (10 percent). A third rate it fair (32 percent) while very few rate it poor (5 percent) or very poor (1 percent).
Provosts who rate the climate for open inquiry and dialogue good or excellent, in higher ed generally and at their institution (n=305):
Across higher ed
At their own institution
Black provosts (45 percent) are less likely to agree that the speech climate on their own campus is good or excellent than are multi-racial (60 percent) or white presidents (62 percent). By institution type, public doctoral institution provosts are most likely (44 percent) to agree that the general higher ed climate for open inquiry and dialogue is good or excellent and private baccalaureate institution provosts are least likely to agree (17 percent).
Provosts in the West, who are also more likely than those in other regions to have policies governing various campus speech concerns, are the most likely by region to say that the overall higher ed climate for open inquiry and dialogue is good or excellent (41 percent), though they’re about as likely as those in other regions to view their own campus’s speech climate as good or excellent.
Additionally, provosts who say that their institution requires faculty training on facilitating difficult dialogues (81 percent) and those who say that their institution has embedded training on difficult dialogues in freshman orientation (76 percent) are more likely than the overall sample (62 percent) to rate their campus speech climates as good or excellent.
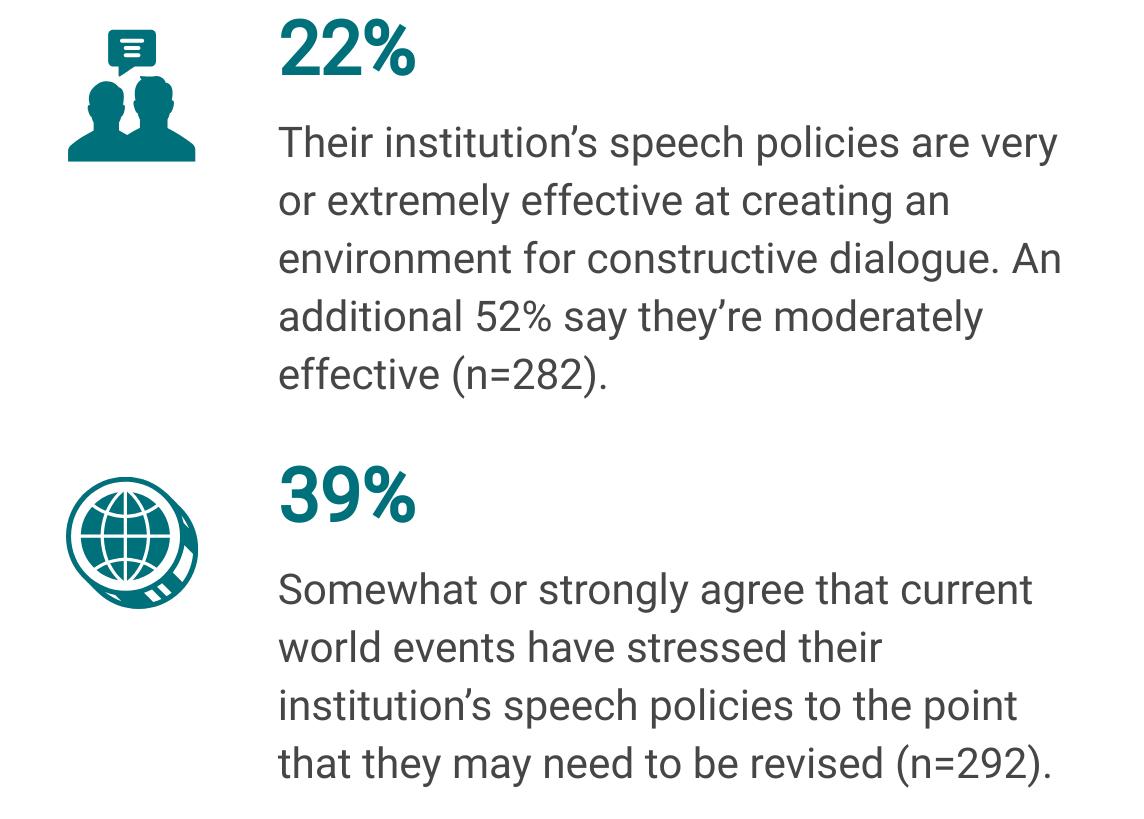
As for how effective they think their campus speech policies are at creating an environment for constructive dialogue, relatively few provosts say they’re extremely effective (3 percent) or very effective (19 percent). Half say they’re moderately effective (52 percent). The rest say they’re somewhat effective (23 percent) or not effective at all (3 percent).
Public and private nonprofit provosts are in relatively alignment, but 34 percent of public doctoral provosts say their policies are highly effective, compared to 23 percent of community college provosts and just 4 percent of public master’s or baccalaureate provosts. By region, provosts in the West are likeliest to agree that their policies are effective, at 35 percent, versus 21 percent in the South, 19 percent in the Midwest and 17 percent in the Northeast.
Female provosts are also less likely than their male counterparts to agree that their campus speech policies are highly effective (17 percent versus 30 percent, respectively). And gay and lesbian provosts are less likely than their heterosexual counterparts to agree that their campus speech policies are highly effective (13 percent versus 24 percent, respectively).
About four in 10 provosts agree (32 percent) or strongly agree (7 percent) that current world events have stressed their institution’s speech policies to the point that they may need to be revisited. An additional 26 percent of provosts neither agree nor disagree while the rest somewhat disagree (23 percent) or strongly disagree (13 percent). Gay and lesbian provosts are significantly more likely than their heterosexual counterparts to say that their campus speech policies need revisiting in light of world events (61 percent versus 36 percent, respectively). Provosts in the Northeast (47 percent) are most likely to agree that their institution’s speech policies may need revising. And despite their relative confidence in the effectiveness of their campus speech policies, presidents in the West (44 percent) are also more likely than those in the Midwest (38 percent) and especially the South (29 percent) to say their speech policies may been revisiting in light of current world events.

As for how concerned provosts are about the 2024 general election results affecting the climate for free inquiry at their institution, more than half say they’re extremely concerned (28 percent) or very concerned (25 percent). A quarter are moderately concerned (25 percent) and the rest are slightly concerned (16 percent) and not at all concerned (8 percent).
Provosts express their level of concern about the 2024 election results affecting the climate for free inquiry and civil dialogue at their institution (n=301):
Relatively more gay and lesbian provosts are highly concerned about the election and the climate for free speech (66 percent) than are heterosexual provosts (52 percent). By age, younger provosts (40 to 49) are least likely to be highly concerned (29 percent versus 52 percent of provosts age 50 to 59 and 64 percent of provosts age 60 to 69). Provosts in the South are most likely to be unconcerned (16 percent), by region.
Nine in 10 provosts (88 percent) agree or strongly agree that high-quality undergraduate education requires healthy departments in disciplines such as English, history, political science and other liberal arts fields, about the same share as said so in last year’s survey of provosts (87 percent). Yet a majority of provosts this year (67 percent) and last year (74 percent) also agree or strongly agree that politicians and board members are prioritizing science, technology, engineering and math (STEM) and professional programs over those that support general education. And this year (34 percent) and last (33 percent), a third of provosts believe that the number of students majoring in a program is an appropriate way to determine which departments to cut.
Provosts who agree or strongly agree with the following on academic programs, by institution type:
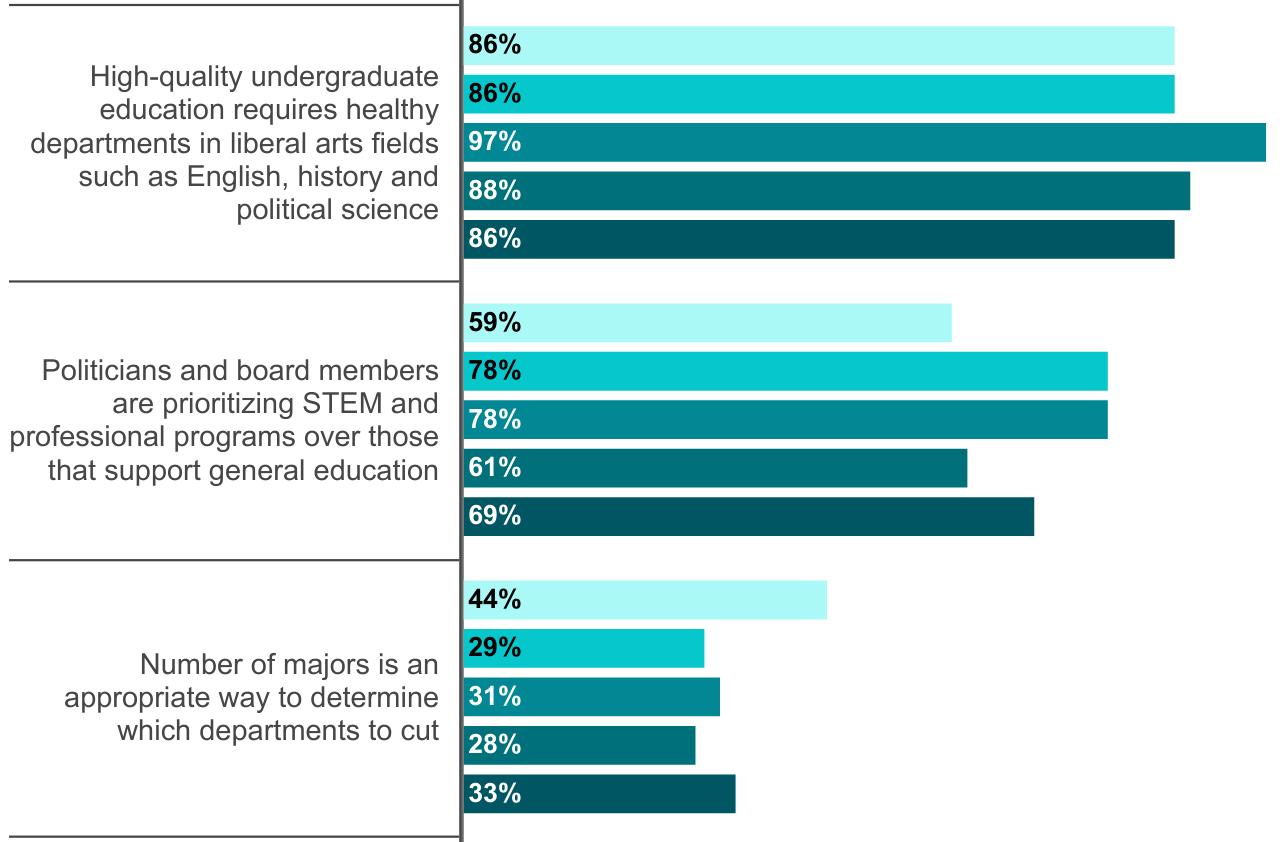
Public and private nonprofit institution provosts are in alignment on all these issues this year, but among public institution provosts, those at doctoral universities are especially likely to say that high-quality undergraduate education requires healthy liberal arts programs (97 percent). Community college provosts, meanwhile, are least likely to agree that politicians and board members are prioritizing STEM and professional programs over other fields (59 percent versus 78 percent each for provosts at public nonprofit master’s or baccalaureate and doctoral institutions). Community college provosts are mostly likely to indicate that the number of students majoring in a program is an appropriate way to determine which departments to cut (44 percent).
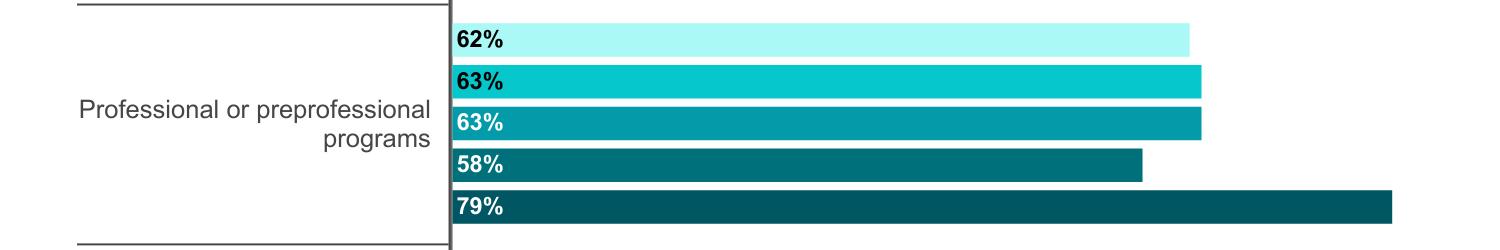
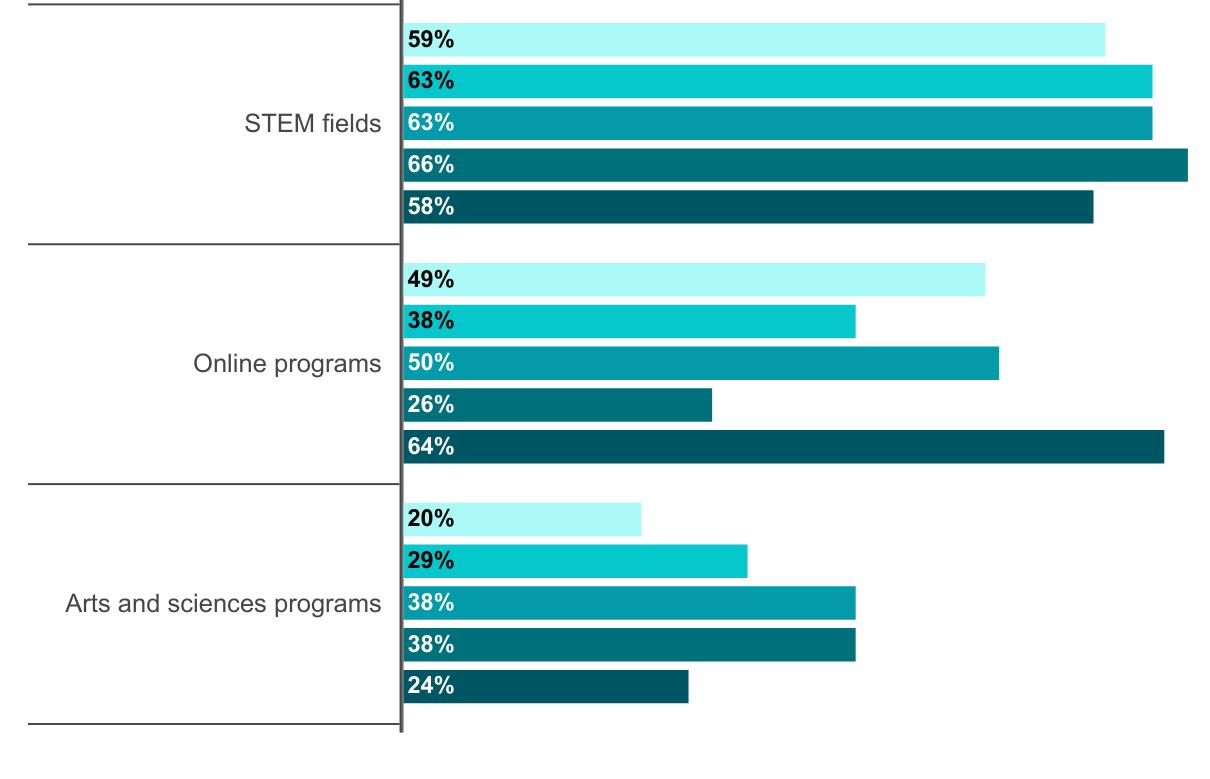
Overall, two-thirds of provosts each agree or strongly agree that they’ll see a major allocation of funds to professional or preprofessional programs (66 percent) and STEM fields (62 percent) in their budget next year. About half say they’ll see a major allocation of funds toward online programs (47 percent). And less than a third say they’ll see a major allocation of funds toward arts and sciences programs (29 percent).
By region, provosts in the West are especially likely to expect a major allocation of funds toward online programs (60 percent). Community college provosts in the West, in particular, expect this (74 percent). Provosts in the Northeast are especially likely to expect a major allocation of funds toward STEM fields (70 percent).
Provosts who anticipate or strongly anticipate a major allocation of funds to the following categories in the next budget year, by institution type:
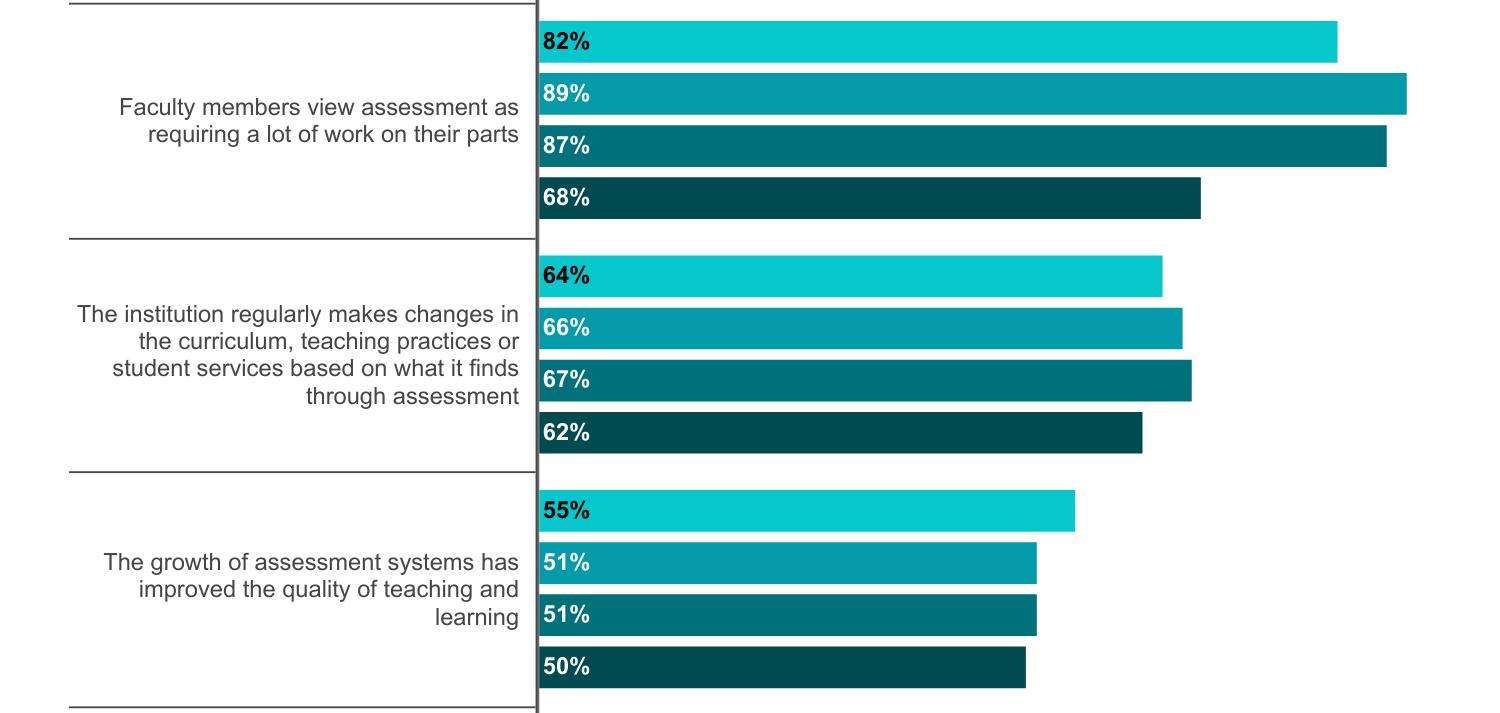
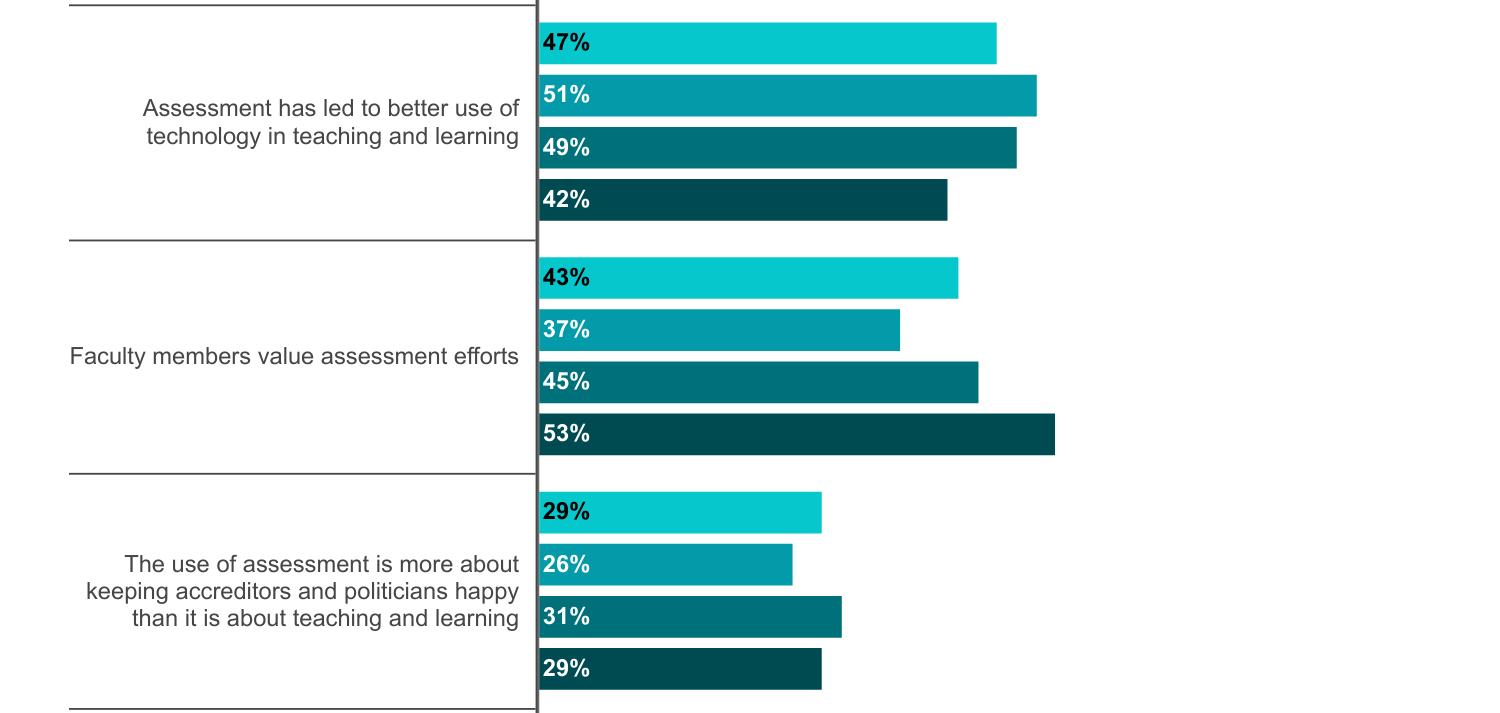
Regarding assessment of student learning, some eight in 10 provosts (83 percent) agree or strongly agree that faculty members at their college or university view assessment as requiring a lot of work on their parts. About two-thirds of provosts (65 percent) say their institution regularly makes changes in the curriculum, teaching practices or student services based on what it finds through assessment.
About half of provosts each say the following: the growth of assessment systems has improved the quality of teaching and learning at their college (52 percent); assessment has led to better use of technology in teaching and learning at their college (48 percent); and faculty members value assessment efforts at their institution (44 percent).
Three in 10 provosts (29 percent) say that their institution’s use of student learning assessment is more about keeping accreditors and politicians happy than it is about teaching and learning. That’s about the same share as last year.
Provosts
Assessment has led to better use of technology in teaching and learning
Faculty members value assessment efforts
The use of assessment is more about keeping accreditors and politicians happy than it is about teaching and learning
Provosts at private nonprofit institutions are somewhat more likely than those at public institutions to say that faculty members at their institution view assessment as requiring a lot of work (87 percent versus 79 percent, respectively). By region, provosts in the West are least likely to agree (68 percent) that faculty members view assessment as requiring a lot of work on their part. Provosts in the West are also most likely to agree that their faculty members value assessment efforts at their college (53 percent); provosts in the Northeast are least likely to agree (37 percent).
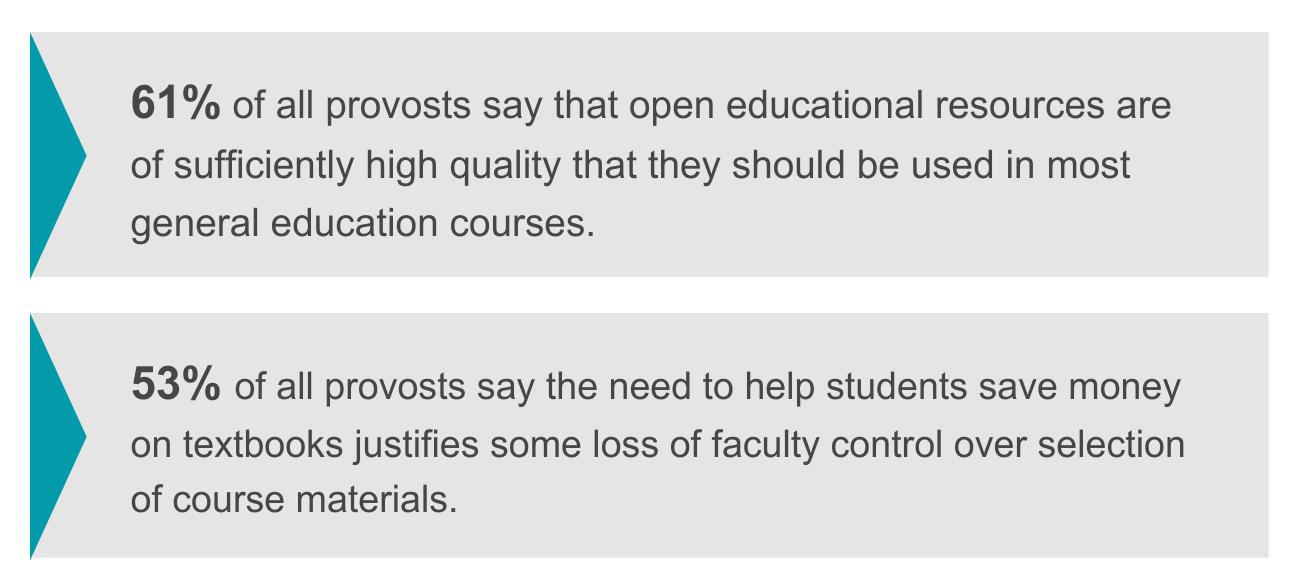
Six in 10 provosts (61 percent) agree or strongly agree that open educational resources, or freely available online materials, are of sufficiently high quality that they should be used in most general education courses. That’s about the same as last year’s survey of provosts (56 percent). This year, public institution provosts (68 percent) are more likely to say this than are private nonprofit institution provosts (55 percent). Among provosts at public institutions, those at community colleges are especially likely to agree (75 percent).
Half of provosts (53 percent) agree, somewhat or strongly, that the need to help students save money on textbooks justifies the loss of some faculty control over selection of materials for the courses they teach. Public institution provosts are slightly more likely to agree (57 percent versus 50 percent of private nonprofit institution provosts), with community college provosts (70 percent) driving most of this difference.
On adoption of new course materials models, seven in 10 provosts (70 percent) say their institution has adopted open educational resources. About a third (34 percent) say their institution has adopted inclusive access, meaning digital-first materials with opt-out options for students. About half as many (16 percent) say their institution has adopted equitable access, or digital-first materials typically bundled with tuition. Relatively few provosts (15 percent) say they’ve adopted none of these models. The rest (6 percent) say they’ve adopted other models.
Provosts who agree or strongly agree with the following on academic programs, by institution type: Private nonprofit (n=150) Public (n=143)
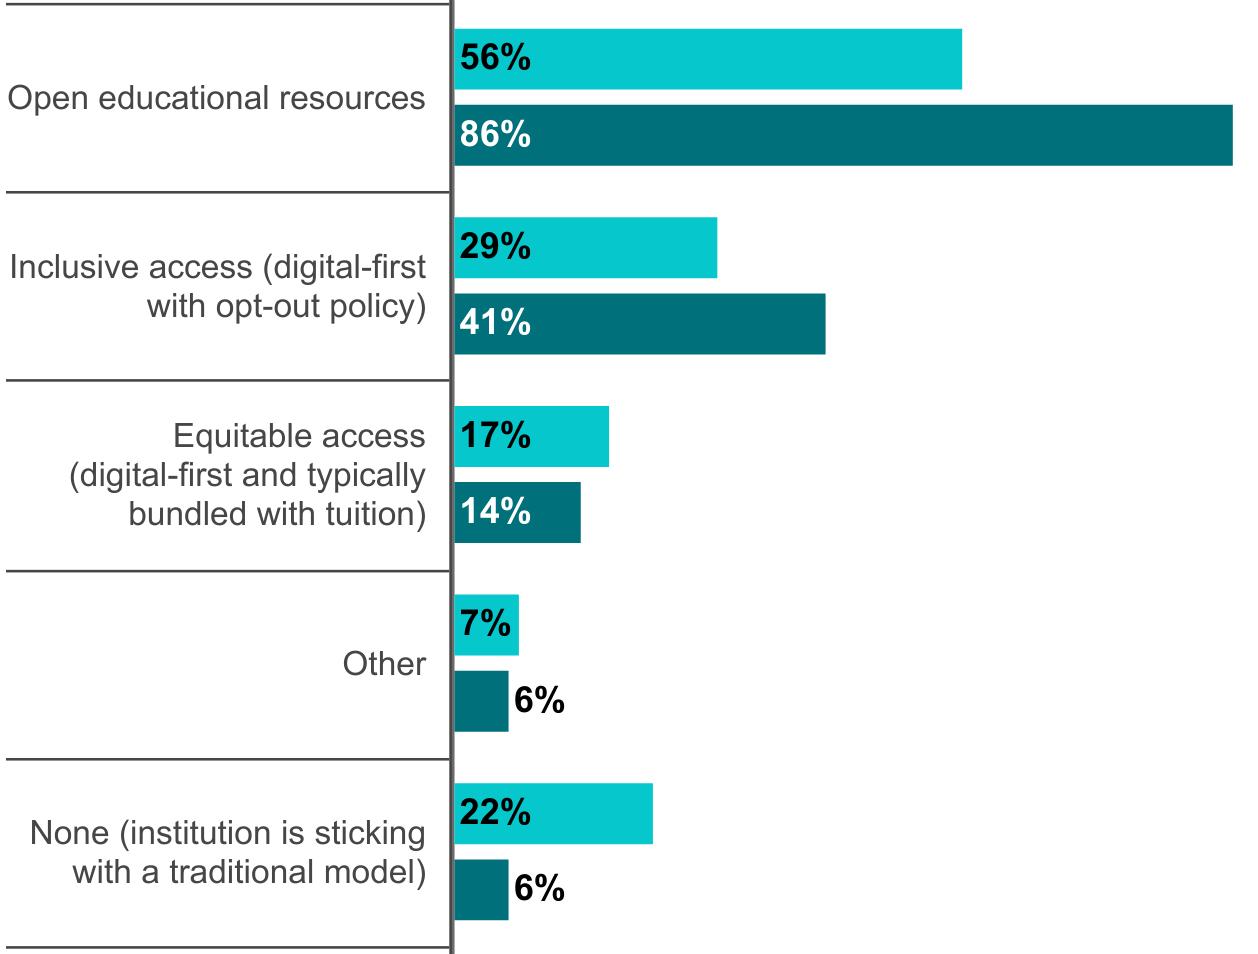
Consistent with their relative support for open educational resources, provosts at public institutions are significantly more likely than their private nonprofit counterparts to say they’ve adopted open educational resources (86 percent versus 56 percent, respectively). Provosts at private institutions, meanwhile, are significantly more likely than public institution provosts to say they’re not experimenting with any new course materials models (22 percent versus 6 percent).
Nine in 10 provosts (87 percent) agree or strongly agree that they’re glad they pursued administrative work, and this is relatively consistent across institution types and demographics, though gay and lesbian presidents (78 percent) are somewhat less likely to agree than their heterosexual counterparts (87 percent). Older provosts, those 60 to 69, are also somewhat more likely (94 percent) to say they’re glad they pursued administrative work than are younger provosts (82 percent each for those 40 to 49 and 50 to 59).
Four in 10 provosts (39 percent) agree, strongly or somewhat, that their job is more focused on financial management than on academic issues. This increases to nearly half when considering only private nonprofit institution provosts (46 percent) and decreases to about a third when considering just public institution provosts (34 percent). Among public institution provosts, those at doctoral institutions are most likely to agree their job is more about finances and management than academics (45 percent versus 33 percent of public master’s and baccalaureate institution provosts and 29 percent of community college provosts).
Provosts who agree or strongly agree with the following about being a chief academic officer (n=299):
Which of the following best describes your primary role at your institution?
How many years have you served as the provost or chief academic officer at any institution?
What type of higher education institution do you work for?
Do you consider your institution to be a liberal arts institution?
Have faculty or staff asked at your institution for additional training related to developments in generative AI?
Has your institution offered training in response to faculty concerns or questions about generative AI within the last 18 months?
Has your institution reviewed the curriculum to ensure that it will prepare students for AI in the workplace?
How concerned are you about the risk generative AI poses to academic integrity?
How enthusiastic are you about AI’s potential to boost your institution’s capabilities?
In what areas or ways is your institution currently using artificial intelligence? Please select all that apply.
How would you rate your own level of awareness of the general state of mental health as it relates to the following members of your community?
% Yes, we
Does your institution provide training for those in leadership positions to help them support the mental health needs of their faculty and staff?
To what extent do you agree or disagree with the following statements regarding the U.S. Supreme Court’s ruling on affirmative action in 2023? Last year’s U.S. Supreme Court decision on affirmative action will...
Has your institution curtailed its diversity and inclusion efforts beyond admissions in response to the decision (or from pressure from lawmakers)?
In what areas is your
Generally speaking, would you say the state of race relations on college and university campuses as a whole is excellent, good, fair or poor?
Generally speaking, would you say the state of race relations on your campus is excellent, good, fair or poor?
Based on student enrollment data, do students at your institution prefer in-person or online/hybrid courses when both are offered? Students tend to...
% ...prefer in-person courses
% ...prefer
In your opinion, do faculty members at your institution prefer teaching in-person or online/hybrid courses when both are options? Faculty tend to...
% ...prefer in-person
%
% ...not have a preference between in-person and online/hybrid courses when both
Approximately what share of your courses are offered online or in a hybrid format?
In your opinion, how important is tenure to the overall health of your institution?
In your opinion, how viable is tenure within your institution?
Note: When thinking about viability, please consider how well tenure works at your institution along with its likelihood to endure.
What proportion of course sections at your institution are delivered by instructors who are not tenured (or on the tenure track)?
As you may know, some colleges are exploring new faculty models beyond a tenure track versus non-tenure-track distinction. Please indicate whether your college has done or has considered doing each of the following for non-tenure-track faculty members.
%
How would you rate the effectiveness of your institution in the following areas?
Does your institution survey its faculty, staff and administrators to assess their job satisfaction?
%
Which comes closest to your view about faculty roles within higher education as a whole?
Which comes closest to your view about faculty roles at your institution?
In the next two years/near future, do you anticipate that your institution will become more reliant, less reliant or about as reliant as it is today on non-tenure track faculty members for instruction?
Do you favor or oppose a system of long-term contracts for tenure-track and tenured faculty over the existing tenure system in higher education?
Please indicate your level of agreement with the following statement: Graduate programs at higher education institutions in this country are admitting more Ph.D. students than they should, given the current job market.
Has your institution taken any of the following steps to educate students, faculty, and staff about the importance of free speech and to prepare them to engage with those with whom they disagree? Please select all that apply.
% Embedded training on difficult dialogues/constructive conversations into the curriculum beyond the first year
% Established a voluntary difficult dialogues/constructive conversations initiative on campus
% Offered faculty training on facilitating
%
% None of the above - my institution has not taken steps to educate students, faculty, and staff about the importance of free speech or to prepare them to engage with those with whom they disagree.
How would you rate the climate for open inquiry and dialogue in higher education generally?
How effective do you believe your campus speech policies are at creating an environment for constructive dialogue?
To what extent do you agree or disagree with the following statement: Current world events have stressed my institution’s speech policies to the point that they may need to be revised.
How concerned are you about the 2024 election results affecting the climate for free inquiry and civil dialogue at your institution?
Please indicate your level of agreement with the following statements regarding speech on campus:
%
Please indicate your level of agreement with the following statements: I anticipate major allocation of funds to the following categories in the next budget year.
Most colleges have now been engaged in assessment of student learning for a number of years. Given that, please indicate your level of agreement with the following statements.
Most colleges have now been engaged in assessment of student learning for a number of years. Given that, please indicate your level of agreement with the following statements.
Has your institution adopted any of the following course material models? Please select all that apply.
% None of the above - my
Please
Please indicate your level of agreement with the following statements about budget and finances:
Please indicate your level of agreement with the following statements:
%
Please indicate your level of agreement with the following statements:
We've
With which of the following gender identities do you most identify?
With which of the following categories do you identify? Please select all that apply.
Inside Higher Ed is the leading digital media company serving the higher education space. Since our founding in 2004, we have become the go-to online source for higher education news, analysis, resources and services. Our mission is to serve all of higher education—individuals, institutions, corporations and non-profits—so they can do their jobs better, transforming their lives and those of the students they serve. We are proud to have earned the trust and loyalty of our 3.2 million monthly readers by speaking as a fiercely independent voice, providing thoughtful, substantive analysis on the pressing issues facing higher education today.
Learn more about Inside Higher Ed at www.insidehighered.com
Founded in 2003, Hanover Research is a global research and analytics firm that delivers market intelligence through a unique, fixed-fee model to more than 1,200 clients. Headquartered in Arlington, Va., Hanover employs high-caliber market researchers, analysts, and account executives to provide a service that is revolutionary in its combination of flexibility and affordability. Hanover was named a Top 50 Market Research Firm by the American Marketing Association in 2015, 2016, 2017 and 2018 and has also been twice named a Washington Business Journal Fastest Growing Company.
To learn more about Hanover Research, visit www.hanoverresearch.com

Copyright © 2024. All rights reserved.