
4 minute read
of irrigation and the position of the drip hose


fertilized with shredded bines was only slightly higher than that of the controls in 2019 and 2020, which indicates a low short-term N-fertilization effect (Figure 4.11). A conclusion regarding the long-term N-fertilization effect of shredded bines, however, will only be possible after the results of the next test years are in.
Figure 4.11: Nitrogen detected at harvest time and divided into cones and residual plant matter in kg/ha relative to either mineral or organic fertilization, for the year 2020, for Herkules, at an easy growing location, using three fertilization levels: 90 N = 90 kg N mineral (control), 90 N + Shredded Bines = 90 kg N mineral + 100 kg N organic (bines), and 180 N = 180 kg N mineral
4.5 Investigation of the roots and nutrient supply in the soil profile as a function of irrigation and the position of the drip hose
Team: I. Riedl (Bachelor Thesis) F. Weiß (Bachelor Thesis) J. Stampfl Collaboration: Dr. Sabine von Tucher, (Chair of Plant Nutrition, Weihenstephan, Munich Technical University) Lehrstuhl für Pflanzenernährung, Technische Universität München Duration: May 2019 to November 2019
Background and objectives
Between 2017 and 2019, the Bavarian State Institute for Agriculture was the site for extensive N-fertilization tests as part of a project entitled "Improving nutrient efficiency in hops through fertilization systems with fertigation." Among other tasks, the effects of fertilization, irrigation, and the position of drip hoses were closely examined. Two drip hose positions, one on the furrow (AB) and below ground next to it (NB), are associated with different effectiveness with regard to biomass and yield generation. This led to studies of the soil profiles in terms of their root distribution, macronutrient content, and other soil properties in the irrigated area, relative to the different irrigation methods.
Methodology
The area for this test is located in the center of the Hallertau, on a favorable growing site (IS) that is planted with Perle. The following variations were investigated:
Table 4.3: Test variations with respect to irrigation and fertilization Variation Irrigation A none Fertilization
none
B C none AB Granulated, scattered none
D E F AB AB NB Granulated, scattered Fertigation none
G H NB NB Granulated, scattered Fertigation
To investigate the root distribution, soil volumes of 2 meters wide and 1 meter deep were excavated with a small excavator. The blocks of soil were equidistant between two hop plants and in a perpendicular direction to the rows. Next, using a spade, the sides of the soil block were smoothed. This ensured a straight profile even for looser soil blocks. To expose the fine roots, water at a pressure of 6 bar was sprayed with a nozzle against the sides. This caused about 1.5 to 2 cm to be washed off. A 5 x 5 cm wire mash grid was placed over the sides, whereby each square served as a counting unit for the number of roots. (Figure 4.12). Only the exposed root tips were counted. In addition, soil samples were taken from the sides according to a precisely calibrated sampling scheme. These were examined for macro-nutrient content (Nmin, P, K, Mg) and dry matter content. The density of the soil to be irrigated below the respective drip hose positions was determined with the help of sample cylinders.
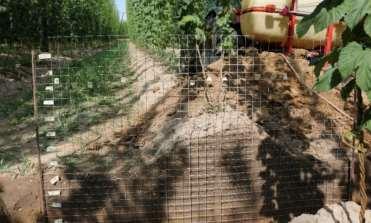
Figure 4.12: Soil block side perpendicular to the hop row, with counting grid
Results
After examination of all test soils, a pattern emerged: The fine-root density in very top soil layer was significantly higher it was than below the soil surface (Figure 4.13). Between 40 and 58% of the total number of fine roots was in the very top layer. Another 35-50% were in the first 20 cm below the soil surface. In the deeper soil layers, however, there were virtually no fine roots.
Figure4.13: An example of fine root distribution in the side of a soil fertilized via above-ground fertigation (E), with Perle, 2019. The deeper the green color, the more roots were counted for squares of 5 x 5 cm. A comparison between the fine root distribution relative to the irrigation method, the AB examinations showed that plants irrigated above-ground had higher root densities belowground than did plants irrigated underground. Especially in the center row, the NB examinations showed a reduction in fine-root formation. Compared to the non-irrigated portions (B), theroot density in the dam was 24% lower in the below-ground irrigated portions (F, G, H) (Table 4.4).
Table 4.4: Distribution of fine roots in the soil depending on irrigation method and N-fertilization
Variation Fine Roots (Number/m2 Sample Soil Block Side)
Irrigation N-Fertilization Side)Summary Profile Row 0 to -70 cm A none none 1250 3278 771 B none Granulated, scattered 1444 4573 741 C AB none 1437 4116 829 D AB Granulated, scattered 1566 4314 1101 E AB Fertigation 1400 4587 823 F NB none 1191 3241 762 G NB Granulated, scattered 1235 3799 757 H NB Fertigation 1241 3365 863
Analyses of the soil macronutrients revealed no deficiencies in any of the soil layers.


