
6 minute read
A La Niña triple dip summer – Will there be any winners?


A LA NIÑA TRIPLE DIP SUMMER –
WILL THERE BE ANY WINNERS?
Nava Fedaeff and Ben Noll : National Institute of Water & Atmospheric Research (NIWA)
The climate driver La Niña is set to strike for the third consecutive year and will influence our weather patterns in the months ahead – an occurrence called a “triple dip.” While it is an unusually long time to have the phenomenon at play, it is not unprecedented. The last triple dip event occurred between 1998 and 2000.
So how does La Niña affect our climate?
There is a saying often used by climate scientists and meteorologists when asked about what La Niña (or El Niño) means for the forecast: “we know the average outcome of La Niña, but no single event is average.” On average, easterly and north-easterly winds tend to become more common during La Niña, bringing moist, rainy conditions to north-eastern areas of the North Island and reduced rainfall to the lower and western South Island. Warmer than average sea and air temperatures generally occur, except in the east of both islands where onshore winds bring more cloud, keeping nights cool and daytime highs subdued. Just like we know that the average drive time between Auckland and Hamilton can be influenced by a crash or heavy traffic, our 2022 weather to-date has been strongly influenced by La Niña driving along Mother Nature’s highway. There are other climate drivers on the road too, and even the chance of an atmospheric traffic jam to consider. For example, a negative phase of the Indian Ocean Dipole (IOD – a sea surface temperature seesaw in the Indian Ocean) over the last few months has been associated with greater moisture availability for low pressure systems in the wider Australasian region. This has contributed to recent flooding events here and across the ditch – as many growers would have experienced. The IOD is set to ease from November to December though, and then take an off-ramp while other climate drivers move onto the on-ramp. Tropical cyclone season officially runs from November to April and typically, at least one ex-tropical cyclone passes within 550 km of New Zealand each year. The recently released Southwest Pacific Tropical Cyclone Outlook1 for the coming season considers the risk for an ex-tropical cyclone affecting New Zealand to be near normal to elevated. Extreme events like this can bring a month’s worth of rain or more in just a day or two. We know from previous events that there is a near-equal probability of an ex-tropical cyclone passing to either the east or west of the North Island.
What goes into an outlook
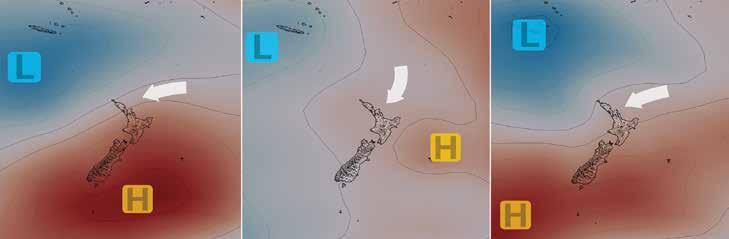
To understand what the season ahead may hold we need to consider all the climate drivers at play, as well as the impact of an already warmer climate on these. When NIWA scientists get together to update NIWA’s Seasonal Climate Outlook2 each month, there are three broad areas of discussion. To start, we always look in the rear-view mirror. What has happened to date? How is it progressing and does it match up with expectations? You can then turn your attention to the front windscreen. Several sophisticated computer models consider a range of data that describes what is happening now and use that information to project forward. As the saying goes, “all models are wrong, but some are useful.” As meteorologists, we combine our knowledge of how the earth system works, with our understanding of what the models show. When did a model last update and did it pick up on the atmospheric traffic jam that recently developed? Should we ignore this model as it drives poorly in wet conditions? Are they all taking the same route to Hamilton or are some veering off and going to Tauranga? Another tool in the prediction toolbox is analogues – past seasons that had similar climate drivers. These can be both objective (automatically chosen based on a set of criteria) or subjective (chosen by an expert). While the official summer outlook won’t be released for another month, Figure 1 shows three plausible analogues of air pressure for our summer ahead. Broadly, we expect more east to north-easterly winds than normal, with higher than usual pressure to the south and lower than usual pressure to the north-west. However, the nuance is in the detail and we’re yet to see exactly how those pressure systems will line up. The most recent analogue in the mix is the summer of last year.3 It was our fifth warmest summer on record. Summer rainfall was highly variable and featured extended dry spells alongside extreme rainfall events (two ex-tropical cyclones affected the country).

Summer 1998/99 Summer 2010/11 Summer 2021/22
Air pressure anomalies (differences from average) for three analogue La Niña summers. Red colours indicate higher than normal pressure while blue areas show lower than normal pressure
Summer 2021–22 temperature difference from average (left) and rainfall difference from average (right). Note that the average period for comparison is 1981–2010
A common feature of La Niña in New Zealand is marine heatwaves. These can provide extra fuel to our climate drivers. Warmer than average seas keep nights warm on land – especially in coastal areas – and provide a warmer start to the day, allowing daytime highs to get higher than usual. Marine heatwaves can also invigorate incoming storms, adding both energy and moisture. Coastal waters near the north and west of both islands are already warmer than usual for the time of year, and we expect this trend to continue as we approach summer.
Does anyone win in a triple dip?
There are always ‘winners’ and ‘losers’ to any climatic pattern. It really depends where you are and what you’re doing (or growing). Last year, late summer rain for Hawke’s Bay affected apple crops and led to blueberries splitting during harvest, but apples in the South Island had a good season. Many grape growers prepared for humid and wet conditions by opening up canopies to increase airflow. Disease pressure was still an issue, but the impact was minimised. Harnessing forecasts, from weather to seasonal climate, and using them to plan and prepare as best as possible is key. And don’t forget that we must all expect the unexpected while travelling along Mother Nature’s highway – hazards may pop up that require us to be agile and shift course. Although forecasts are much more accurate than they were a few decades ago and continue to improve all the time, they will never be perfect. Construction is ever-present on this highway. The November to January Seasonal Climate Outlook is due to be released on 28 October and will be accompanied by a video and livestream on our Facebook page discussing the drivers along the highway that leads to summer.
1 https://niwa.co.nz/climate/southwest-pacific-tropical-cycloneoutlook/southwest-pacific-tropical-cyclone-outlook-october-2022 2 https://niwa.co.nz/climate/seasonal-climate-outlook 3 https://niwa.co.nz/climate/summaries/seasonal/summer-2021-22
NIWA SEASONAL CLIMATE OUTLOOKS
Predictions of temperature, rainfall, soil moisture and river flows.
niwa.co.nz/outlook
PRODUCT GROUPS
ALL THE LATEST NEWS FROM YOUR PRODUCT GROUPS
68 TOMATOESNZ UPDATE


