
8 minute read
Automating the future


LA NIÑA
INTENSIFIES RAPIDLY
Words by Georgina Griffiths : MetService Meteorologist
La Niña conditions have recently intensified in the tropical Pacific Ocean, with a better-than-even chance that this event becomes a strong (major) La Niña event between now and Christmas.
Forecast models were initially reasonably cautious with respect to the intensity of this event, originally favouring a ‘moderate’ intensity scenario, but at the current time of writing (19 October), half of all climate models now predict an event that exceeds the ‘strong’ threshold by the end of 2020. In part, this shift in the predictions reflects the rapid intensification in La Niña conditions seen in the first six weeks of spring.
Recent factors for New Zealand:
As expected, the first half of spring 2020 (the period from 1 September – 15 October) was characterised by two things:
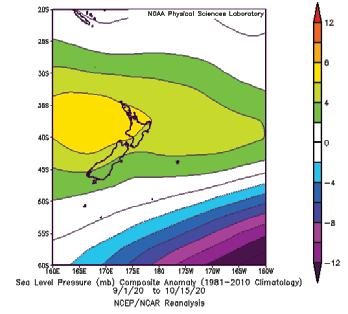
Intense highs, most often centred over the Tasman
Sea and extending a ridge of high pressure onto the
North Island, produced drier than normal early spring conditions in most North Island areas, with westerlies frequent across the South Island (Figure 1).
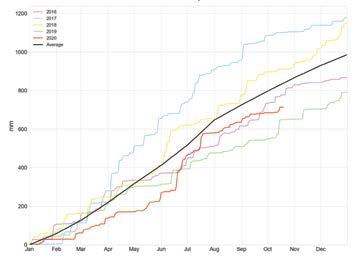
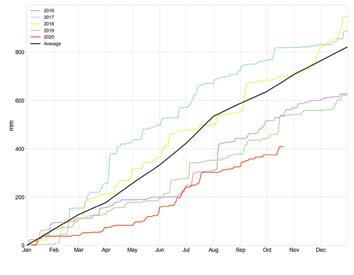
Unusual temperature volatility, including some unusually late in the season low snowfalls, and some abnormally late frosts. The early spring dryness can be observed in Figures 2–5. At the time of writing, year-to-date rainfall accumulation at Gisborne was sitting at 85% of normal, with Napier sitting at an extremely low 59% of year-to-date normal. Palmerston North had clocked up around 82% of normal year-to-date rainfall, while Nelson was sitting at 66% year-to-date normal.
La Niña – what does it mean longer term for us?
La Niña conditions are forecast to peak in intensity around Christmas time, and then persist through into early autumn 2021. La Niña becomes an important driver for New Zealand over longer durations (for example, across two to six months), especially when the event is a strong one. Although every La Niña event is different, you can plan for certain types of weather patterns to play out more frequently than usual.
1
The independent long-range European Centre for Medium-Range Weather Forecasts (ECMWF) multimonth pressure, rainfall and temperature predictions that MetService operate over the three-month to sixmonth window all indicate a fairly typical La Niña summer (December to February) weather pattern overall.* *Of course, day to day, and week to week, Mother Nature will throw the usual wide variety of weather maps at New Zealand – you will still have to watch the weather map and the MetService weather forecast. However, when you ‘zoom out’ at the end of a season, there is every expectation that the weather maps that have shown up most will be La Niña-like. From a planning point of view, one should work on the principal of more frequent Highs than usual across the South Island, with a clear signal for drier-than-normal conditions in western and inland regions of the South Island. Similarly, an ‘active tropics’ to the north of New Zealand is indicated, with frequent easterly winds across the upper North Island, and an increased risk of a wetter than normal summer over the far north of New Zealand (Northland, potentially Auckland, Coromandel, parts of the Bay of Plenty, Gisborne, and sometimes Hawke’s Bay).
As always, keep up to date at with our latest thinking via the MetService long-range commentary at http://metservice.com/rural/monthly-outlook.
Rainfall accumulation plot for Gisborne
2 Rainfall accumulation plot for Napier
Rainfall accumulation plot for Palmerston North
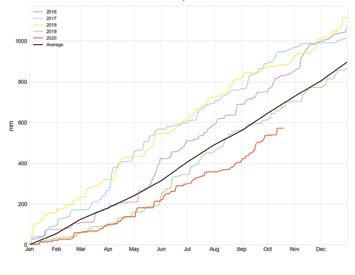
4 Rainfall accumulation plot for Nelson
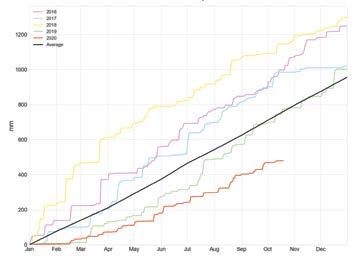
Figure 1: Mean sea level pressure anomaly (deviation from normal) for the first half of spring 2020 (i.e. for the period 1 September to 15 October 2020). Yellow colours indicate higher than usual pressures; purple and blue colours show lower than usual pressures. In this image, higher than usual pressures (yellow colour) are observed over the Tasman Sea, with a ridge of high pressure extending onto the North Island. Similar to a weather map, the black lines can be viewed as anomalous ‘isobars’, indicating more westerlies than normal observed across the South Island. Map produced courtesy of National Oceanic and Atmospheric Administration (NOAA)/Earth System Research Laboratories (ESRL) Physical Sciences Division. Figure 2: Gisborne annual rainfall accumulation (mm) for the last five years (2016 to 2020). The annual average rainfall accumulation is shown in black. Figure 3: Napier annual rainfall accumulation (mm) for the last five years (2016 to 2020). The annual average rainfall accumulation is shown in black. Figure 4: Palmerston North annual rainfall accumulation (mm) for the last five years (2016 to 2020). The annual average rainfall accumulation is shown in black. Figure 5: Nelson annual rainfall accumulation (mm) for the last five years (2016 to 2020). The annual average rainfall accumulation is shown in black.
HUMIDITY
CONTROL
Words by Elly Nederhoff : Crophouse Ltd
Greenhouse climate control with a dedicated computer seems easy: the grower choses the desired levels or set points, and the computer steers the heating, venting, fans, screens, and so on.
But it is not easy to choose settings that are both good for crop production and energy-efficient. Temperature and humidity settings combined govern the heating and venting, and these two factors can be at odds. It is important to realise that every degree higher temperature or percent lower humidity in the set points costs energy (we are talking winter conditions). Note that there are various ways to describe humidity, including absolute and relative humidity, VD, VPD (vapour pressure deficit) and dewpoint. In this article we use relative humidity (RH), because everyone is familiar with it, and it works well enough for our purposes. Other units such as dewpoint and VPD can be technically better, but are a bit complicated.
Greenhouse air humidity
Air humidity in a greenhouse is a dynamic balance. The base is the amount of water vapour in the outside air. On top of that comes water vapour added by plant transpiration. Subtracted from it, is water vapour disappearing due to ventilation and condensation. Humidity control is aimed at avoiding extremes: in winter avoiding high humidity that would cause fungal diseases, in summer avoiding low humidity that would cause plant stress. From an energy perspective, we are interested in winter conditions only. In a planted heated greenhouse in cold conditions, the absolute and relative humidity are much higher inside than outside. Therefore venting, which is air exchange with outside air, has a dehumidifying effect. But venting is also loss of energy (warmth and water vapour), so heating is needed to maintain the required temperature. A bit of venting is necessary for avoiding high humidity in winter, but excessive venting is waste of energy.
Humidity and fungal diseases
When choosing the setpoints for air humidity in the winter, most growers set the RH at a safe low level to reduce the risk of fungal diseases. This prompts simultaneous heating and venting, which costs a lot of energy: every percent lower RH costs more money. The first way to save energy is by choosing a setpoint not too low. As disease prevention remains paramount, the question is, what RH setpoint is safe in winter?
First some background. Spores of fungal diseases such as grey mould (Botrytis) often hang around in a greenhouse waiting for the right conditions. The right condition is a thin layer of water on a plant part (leaf, stem, flower or fruit) to let the fungal spores germinate. If the plant part remains wet for some hours, the hyphen from the germinated spores can penetrate the plant. Once inside the plant, the fungus is not depending on air humidity anymore. Thus, fungal diseases can be prevented by drying the plants in time, to give spores not enough time to infect a plant.
Condensation
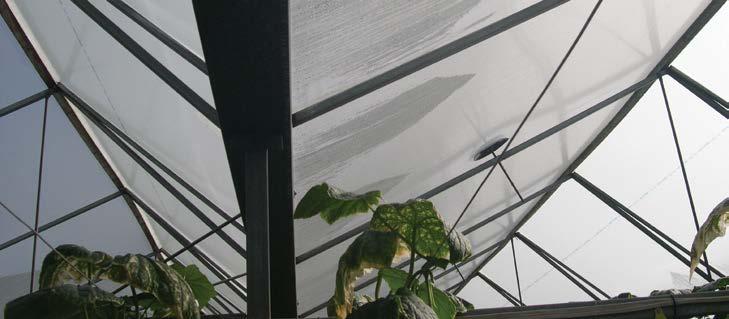
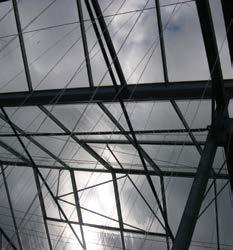
Plant wetness can be for various reasons: spraying, fogging, condensation. Spraying must be done when the plants have a chance to dry. Condensation occurs when the RH is very high and there is a cold surface with a temperature below the dewpoint. This can be a cold glass roof or cold plant part. Leaves can be cold, but particularly solid parts such as fruit can be cold early in the morning. This is when the heating system or the sun warms up the plants, but the fruit with their bigger mass take longer to warm up. As fruit lag behind in temperature they get below the dewpoint and become wet from condensation.
Cold spots
Nearly all greenhouses have cold spots, be it a corner with inadequate heating or broken windows, or spots deeper in the plants that get little sunshine and air movement. These places are the first to get wet from condensation, and this is where diseases start. A series of temperature measurements can show if the temperature is uniform or if there are serious temperature differences. Temperature uniformity can be established by improving the heating lay-out, repairing broken glass, increasing air movement, or opening dense foliage. This will reduce the risks of condensation and thus diseases.
The next step is avoiding too high air humidity. If a greenhouse has no cold spots at all, the RH setpoint can be set high, in theory close to 100% (but that is unrealistic). In contrast, if there are large temperature differences, the grower must maintain a safety margin and keep the RH under 85% or 80% or even lower. Such a low setpoint means that a lot of energy is used for heating combined with venting. Therefore, identifying and resolving cold spots will significantly improve energy efficiency while keeping diseases in check.
Other effects of humidity
Humidity control in winter is important for maintaining plant health, but also for influencing transpiration, which takes care of nutrient uptake and transport. Humidity also affects for instance pollination in fruit crops, leaf stretching, plant shape and the general vulnerability of the plants. Humidity control can be improved by using more refined measurements. More on humidity and its control in a following article.


