12 minute read
Reducing variability in apple tree productivity


What are the opportunities to reduce variability in apple tree productivity through targeted (sub-block) water and nutrient application?
By Mike Nelson, Greg Dryden, Anna Weeks & Chris Hosie : Fruition Horticulture, Nelson, and Dr Ken Breen & Rob Diack : The New Zealand Institute for Plant & Food Research Limited.
This project investigated variability among apple trees in an orchard block with varying soil textures, to correlate tree variability with soil texture and consider if variable fertiliser and irrigation applications were warranted.
In Hawke’s Bay and Tasman, most apple production occurs on soils that have formed from alluvial (river movement) deposits. These soils range from clays to sand to gravels from a wide range of parent material, even within a defined soil type. Orchard blocks are usually laid out with only surface features in mind – roads, drains, boundaries, and little thought is given to soil features unless they are to be critically detrimental. As a result, orchard blocks can have considerable variation in soil composition and texture running through them, while a uniform management strategy is applied to them. Soil texture has a major influence on how much water a soil can hold and make available to plants over time. Soil texture also influences the amount of nutrient that can be temporarily stored for plant use, particularly the cations e.g., potassium, calcium and magnesium. It is well documented that soils with light texture (larger spaces between particles) need smaller amounts of nutrient and water, applied more often, compared with heavier textured soils. Current industry practice is that orchards are generally managed at a block level without regard to soil texture variation within them. There is no accounting for the considerable variation in tree requirements due to variability in soil texture. As world leaders in the move to higher production levels, New Zealand orchardists have become better at solving the more obvious yield limiting factors at a block level. However, improving yield and
quality further will require understanding and reducing subblock tree level variation. In addition, block-level irrigation and fertilisation can be wasteful of resources – some plants are oversupplied while others are undersupplied, and can also result in pollution of aquifers and waterways. Reducing between-tree variation also has the potential to achieve more even fruit maturity and quality, which is also important for the economics of mechanisation and postharvest outturn.
The block selected for this study was 23 ha of Scilate’ (EnvyTM) on ‘M9’ rootstock planted in 2010. Running through the block were four soil types having different soil textures. Three soil types were selected for the study – Hau stony sandy loam, Riwaka medium sandy loam and a heavier Riwaka silt loam – to give a range of soil textures.

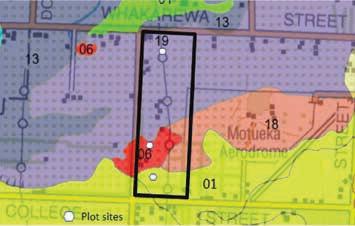
06, Riwaka Soils, Medium Sandy Loam 01, Hau Soils, Stony Sandy Loam
18, Riwaka Soils, Silt Loam 19, Riwaka Soils, Silt Loam
Figure 1
Within each of three soil types 20 plots of 62 m2 each were selected.

On each of the three soil types, 20 plots were selected randomly, with each plot made up of 21 adjacent trees (1 bay X 3 rows). Soil moisture levels were monitored using Sentek continuous monitoring probes (capacitance sensors) to 90cm on one site, on each soil type. On each plot measurements were made of trunk crosssectional area (TCA) which is a reasonable indicator of total tree biomass in blocks of this age, with variations in size an indicator of historical variation within a block. Soil samples were taken for chemical analysis and soil texture determination. Unfortunately, due to hail damage, recording fruit yield and size was not viable, so instead branches were measured to determine branch cross-sectional area (BCA) as an indicator of potential fruit production. Normalized Difference Vegetation Index (NDVI) mapping was used to measure tree vitality. NDVI mapping uses satellite (or drone) imagery to measure near-infrared light reflectance. It can provide an accurate indication of the presence of chlorophyll, which with accurate interpretation, correlates with plant health and vigour. This can then be displayed graphically with colours, or each pixel can be given a numerical value. An image was obtained by satellite later in the season, on 9 February, when it was considered trees would be under some stress (Fig 2).
112%
Hau stony sandy loam Riwaka medium sandy loam
-0.8 -0.6 -0.4 -0.2 NDVI
Riwaka silt loam
Figure 2 Image of Normalised Difference Vegetation Index (NDVI) variation within each of the soil type areas. Yellow through to red has a lower NDVI index value showing lower chlorophyll levels which may indicate stress or reduced vigor, with green through to blue showing a larger index value and high chlorophyll levels which indicate more active photosynthesis and less stress
An electromagnetic (EM) soil survey was also conducted over the study areas (Fig 3).This involves using a magnetic field to measure soil conductivity. Coarse soil texture such as sand has a low conductivity compared with a soil having a higher proportion of clay, which has a high conductivity, and a silt soil having a medium conductivity. Measurements were taken at two depths (0.4m and 1.2–1.4m) and mean values for each plot were derived from a 3m radius from the plot centre
Hau stony sandy loam Riwaka medium sandy loam
EC_Deep_dS
1.6748 – 2.2300 2.2301 – 3.1400 3.1401 – 3.7700 3.7701 – 4.9300 4.9301 – 8.0000
Riwaka silt loam
Figure 3 Image of Electromagnetic survey mapping of each soil type at the 1.2 to 1.4 metre depth. The smaller the electrical conductivity (EC) value the coarser the base material. Red brown and yellows would be prograding gravels (red indicates bigger gravels, yellow smaller), the light green likely sands, and the darker greens sandy to silty
RESULTS
Soil Texture
All three soil types consisted mostly of sand and silt components with very little clay found in any of the plots. This left the proportion of sand to silt as the main influence on soil texture. The greater proportion of sand in a sample makes a lighter texture soil with less water holding capacity and less ability to retain nutrients. Although there were observed differences in the sand fraction among soils as was shown in the chemical analysis, variability among samples was as large or larger than variability among soils. However, as would be expected the Riwaka silt loam generally had less proportion of sand particles and was of a heavier texture.

100 90 80 70 60 50 40 30 20 10 0
Soil texture – percentage sand
Hau stony sandy loam Riwaka medium sandy loam Riwaka silt loam
Figure 4 Mean percentage of sand (as an indicator of texture) by soil type. Influence of soil type on size of tree (mean trunk cross-sectional area in cm2)
50 50
square cm square cm 45 45 40 40 35 35 30 30 25 25 20 20
15 15
Trunk cross-sectional area
Hau stony sandy loam Hau stony sandy loam Riwaka medium sandy loam Riwaka silt loam

Figure 5 Influence of soil type on size of tree (mean trunk crosssectional area in cm2)
Tree Growth
Tree biomass was significantly less for trees grown on the Hau stony sandy loam, with a mean TCA of 27 cm2 , compared with 41 cm2 and 39 cm2 for the Riwaka medium sandy loam and the Riwaka silt loam respectively. Trees on the Hau stony sandy loam also had smaller branches, with a mean BCA of 2.5 cm2, compared with 3.3 cm2 and 2.7 cm2 for the Riwaka medium sandy loam and the Riwaka silt loam respectively (see images a and b ).
a
b
Electromagnetic Survey
The electromagnetic (EM) survey did not detect differences in localised soil textures, within a soil type, that may explain soil texture (percentage of sand, determined in the 15cm core sampling).

EM value 15
10
Shallow EM
5
R2 = 0.2552
0
0 20 40 60 80
% Sand (texture)
Figure 6 Mean percentage sand of a plot compared to shallow (1.4m) EM value
Production
Production levels for the 2018–2020 seasons are given in Figure 7. Over three seasons, production on the light textured Hau stony sandy loam was higher at 280 t/ha compared with 234 t/ha and 207 t/ha on the other two soil types that had much greater biomass in trunk and branches.
120
100
80
t/ha 60
40
20
0
2018
Hau stony sandy loam
Production
2019
Riwaka medium sandy loam 2020
Riwaka silt loam
Figure 7 Production levels in t/ha from blocks within each of the soil types
NDVI
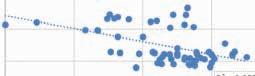
NDVI images taken on 9 February strongly correlated (R2 0.79) to tree trunk cross-sectional area. Plants with a high NVDI value in February had developed larger trunks over time.
Trunk cross-sectional area – NDVI
TCA 50 45 50 35 30 25 20 R2 = 0.7916 15 10 5 0 0.57 0.58 0.59 0.6 0.61 0.62 0.63 0.64 0.65 0.66 0.67 NVDI value
Figure 8 Relationship of tree biomass (TCA) and NDVI values taken on 9/2/2021
Discussion
Growers aim to apply water and nutrients at levels that are sufficient to support plant and fruit growth and development. The rates of nutrient applied are dependent on soil test results, previous seasons’ leaf tissue test results and plant performance at a whole block level, and do not take into account within block variability. Consequently, there will be areas of oversupply of nutrient, particularly as growers prefer to avoid undersupply.
In this research, soil tests showed that nutrition was generally not limiting at either a block or sub-block (plot) level. However, for example, the soil test survey of 10 plots per soil type indicated that there was significant variation in phosphate levels in both the Riwaka medium sandy soil and the Riwaka silt loam soil, while the Hau stony sandy loam had low variability. This suggests that there is opportunity to reduce inputs by a more targeted, sub-block application of phosphorus. Similar opportunities may be available with other elements such as potassium. However, this could not be determined or correlated to any of the variables measured such as soil texture, so would depend on more cost-effective soil chemical analysis processes than what is currently available.
In the case of irrigation, seasonal traces of soil moisture content showed that soil moisture was not limiting at block level, and there was strong indication that irrigation frequency and/or volume could be reduced in both the Hau stony sandy loam and Riwaka medium sandy loam soils. However, with only a single monitoring station per block, we were unable to interpret this at a plot level. Given that results showed greater variability in texture among plots than among soils, opportunities may exist to save inputs through more targeted application at subblock level, but because measurement of soil moisture at a plot level was outside of the scope of this work, this should be included in a subsequent study. A more intensive project measuring NDVI scores throughout the season may be warranted and yield more insight into tree performance in relation to soil texture/soil moisture dynamics.
Interpretation of the NDVI data was limited because overhead satellite frequency and cloud cover restricted the number of successful images received. The strong (R2 = 0.79) positive correlation between NDVI and tree biomass may not so much show that trees with lower biomass were less healthy or under stress, but that those trees were less vigorous. And that this one snapshot in time reflected tree biomass that had accumulated since planting. High vigour and dark green leaves in the mid to late-season, at the stage that the NDVI imagery was taken, is usually an indicator of excess vigour. In trees with excess vigour, post-harvest fruit quality is reduced, and high leaf area may cause shading, reducing marketable yield through reduced fruit colour. Examination of the trees across the plots suggested the smaller trees (by TCA and BCA) with lower NDVI scores observed in the Hau stony sandy loam soil were likely to be better performing trees; an observation supported by yield data. This also suggests that there is opportunity to improve productivity by reducing inputs at a block level. Given the wide variation in soil texture as measured by percentage of sand, there may also be opportunity to improve productivity by managing inputs at a sub-block level. The large differences in tree biomass could not be explained by soil texture either through the sample fraction method or the EM survey, despite the wide differences in soil texture within and among the soil types. It is possible that the tendency of growers to liberally supply inputs so as to avoid areas of deficiency may have clouded this relationship. In conclusion, we could not confidently link soil type or texture and tree growth or productivity. This may be because orchard management tended to oversupply inputs to avoid areas of deficiency that might cause reduced productivity. A number of factors investigated at both the block and sub-block (plot) level supported this view. Consequently, the original concept of supplying a secondary irrigation line to mitigate soil texture-based moisture deficiencies is unlikely to have any positive effect on productivity under the current management practices. However, if management objectives were to shift towards minimising inputs, a situation easily conceivable under improved ecological sustainability targets, application of nutrition or irrigation at a sub-block level, possibly based on soil texture, may become feasible and desirable.
Potential Future Research
1 Investigate NDVI values within and among seasons to understand their relationship with tree growth and yield. 2 Explore the use of soil moisture deficit management using NDVI in conjunction with soil moisture monitoring. 3 Further explore the reasons for tree variability.
Funded by the Rural Professionals Fund – Our Land and Water National Science Challenge.
We wish to thank the following for their support of this project: Kono Horticulture for allowing access to their property and production records for this study; Carl Sladen, Complete Water Solutions, Motueka, for irrigation costings; Lachie Grant, LandVision, for EM mapping; Our Land and Water for funding this project.