2 minute read
A stormy winter and big shifts in weather patterns


By Georgina Griffiths : Meteorologist, MetService
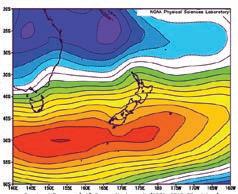
For the first five months of 2022 (January to May), New Zealand experienced an unusual number of highs sitting to the south of the country, and frequent easterlies over the upper North Island (left hand side of Fig 1 ). It was a relatively settled start to the year for South Island areas, and soil moistures in the east of the South Island – as well as in the west of the North Island – remained in significant deficit into May (Fig 2 ).
However, a major pattern change to a higher than normal frequency of deep lows across both the Tasman Sea and south of New Zealand occurred in winter (June and July-so-far). This shift produced an extremely wet, windy and wild regime, complete with multiple heavy South Island snowfalls. (See Figures 3 to 7 for selected rainfall accumulation plots.) Saturated soils became the norm for north-facing and west-facing areas of both Islands by mid-July.
Climate driver update
The 2021–2022 La Niña has now weakened to a point that most commentators have ended the event. However, many climate models forecast a return to La Niña conditions for late in the year, for the third year running. For winter and spring, the most important factors for the New Zealand weather maps are likely to be an active winter Tasman Sea jet stream and the likely formation of a negative Indian Ocean Dipole (IOD) event. Both of these climate drivers produce more ‘active’ lows over the north Tasman Sea, and in turn, more frequent northerly rain events over New Zealand than usual. The MetService long-range forecast continues the stormy weather patterns of July into August. For the latest long-range predictions, you can sign up for free to the Monthly Outlook at
www.metservice.com/emails

Figure 1 Mean sea level pressure anomaly (deviation from normal) for January to May 2022 (left hand side) and the period 1 June to 8 July 2022 (right hand side). Red/orange colours indicate higher than normal pressures, while purple/blue colours indicate lower than usual pressures (more lows). Map produced courtesy of NOAA/ESRL Physical Sciences Division
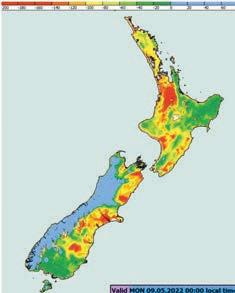

Figure 2 A ‘snapshot’ of estimated soil moisture deficit at 4km resolution on 9 May 2022 (left hand side), compared to 11 July 2022 (right hand side). Blue colours indicate saturated soils. Orange colours show significant soil moisture deficit, while red colours signal severe soil moisture deficit
Rainfall accumulation plots tell a wet story

Figures 3 - 7 : Regional annual rainfall accumulation (mm) for the last five years (2018 to 2022). The annual average rainfall accumulation is shown in black
Figure 3 : Kerikeri

Accumulated Rainfall (mm)
Figure 4 : Hamilton

Accumulated Rainfall (mm)
Figure 5 : Napier

Accumulated Rainfall (mm)

Figure 7 : Christchurch
Accumulated Rainfall (mm)
Figure 6 : Blenheim

Accumulated Rainfall (mm)


