
17 minute read
Latin America & Caribbean
Green gas goes digital
The gas industry faces big challenges with renewable gas injections. Innovative digital and data-driven solutions help gas network operators to optimise investments, to reduce operational costs and to minimise CO2 footprint.
Geert Meulenbelt

EXPORT MANAGER, DCBRAIN Geert Meulenbelt is export manager for DCbrain, a Paris headquartered specialist in the design and optimization of digital network twins. With a 25-year long background in the software industry he is specifically focusing on business and partnership development with gas TSOs and DSOs.
Geert Meulenbelt is export manager for DCbrain, a Paris headquartered specialist in the design and optimization of digital network twins. With a 25-year long background in the software industry he is specifically focusing on business and partnership development with gas TSOs and DSOs.
Widely known for its complexity, its risks and for having expensive and capital-intensive assets, the gas industry faces a growing need for renewables with new actors entering the ecosystem. Today’s gas Transportation and Distribution networks are changing at an unprecedented pace.
Managing the injections of renewable gases such as biomethane and hydrogen is a key challenge for the gas industry today. Not only European regulations such as the Gas Package strongly promote decarbonization, the recent geo-political developments put into question existing natural gas supplies which only reinforces the trend towards net-zero emissions. All this means that transporters and distributors of gas need to adapt their existing gas infrastructures for a nearly complete expected transition from natural gas to green gas over the next 30 to 40 years.
This is pushing gas network managers in a race for digitalization and innovation with one word in mind: data. They are reconsidering the old static and time-consuming network steering tools for a more data-driven approach, allowing them to cope with a higher level of complexity in a much better way.
Challenges for gas Transport and Distribution network managers include: • Simulate renewable gas inflows and their impacts on the network • Better forecast consumptions and allocations
• Invoice adequately the calorific value of gas • Detect errors (calibration errors, leakages, losses…) and improve data quality, • Optimise settings of assets, maintenance activities and investments
DCbrain: Digital twins of gas networks
By gathering the millions of measurements from sensors and topology as defined in the Geographic Information System (GIS), a new generation of tools allows operational teams to have quick and deep insight and recommendations on their networks functioning through digital twins.
Tools are themselves evolving and are now integrating Artificial Intelligence to simulate scenarios, analyse their impacts and find optimum paths in the gas network DCbrain is a software editor dedicated to gas network operators. By using data from the network topology, injections and consumptions; and combining this data with artificial intelligence, DCbrain allows network operators to visualise, calculate, analyse, simulate and optimise assets and flows such as pressure, volume and PCS (quality).
The historical approach to simulate the behaviour of a network relies on physical formulas, and then using mathematical solvers to obtain an outcome. This method has however some major drawbacks: for a physical model to be usable they are often simplified mathematically because the reality of certain parameters, such as the exact shape and rugosity of a pipe, are simply not known. While the study of a subset of the network may be relatively easy, solving the network as a whole takes a lot of time and resources. Because of the complexity to scale to a full network, fewer mathematical solutions are explored when optimising the network which results in a less than perfect optimization exercise. This is the reason why the use of Artificial Intelligence is not only interesting, but increasingly necessary. However, in order for AI to understand how the network works, it must be provided with data in order to reproduce the network in a datadriven way.
Exploiting Hybrid Artificial Intelligence
There are clear advantages to using data and AI to build digital network twins. Its capabilities to complete nonexisting data points allows it to create a model even with incomplete or “small” data. This being said, there is one major limitation: AI is a prisoner of the world it has to learn from.
For example, if a valve is half-closed while the input data state it is fully closed, the model will learn from incorrect assumptions. As a result, the quality of the model will be less good and time is required to either
improve the quality of the source data or to adjust the digital twin model. The DCbrain hybrid AI can be defined by two complementary approaches.
The first consists of linking physical thermodynamic laws with artificial intelligence in order to anchor the algorithms in reality; you can never go against these laws and they become therefore the “boundaries” of the system. The second is to provide near-human intuition capabilities to optimise networks by generating such intuitions artificially. Because this Hybrid AI approach is very fast, it is possible to test more scenarios, and increase its quality. The technology used for that is called reinforcement learning, which became famous when a model created by Google beat the AlphaGo world champion. This technology is also particularly useful to optimise a network by evaluating the most relevant scenarios. Scalability is also a big advantage: the number of kilometres of pipes is not a major constraint in designing a digital network model. Extrapolation is easy with digital solutions.
Last but not least, Hybrid AI provides the same performance as a regular AI yet without the black box effect (meaning that we no longer understand the reasoning of the model). It is much easier to acknowledge what a model does by placing boundaries using physical models. In addition, designing a limited number and easyto-understand parameters is now possible. Of course, the understanding of the network is reinforced with real-time data. This unique technology combines graphs (for a realtime network mapping) with Artificial Intelligence (for an understanding of the network’s behaviour).
Human beings will always remain in the driving seat
Technical results are a mixture of artificial intelligence, human expertise, theoretical behaviour and data from the real world. How ever technology may be excellent, it has a limited impact if it cannot be applied. It always requires human expertise to make the best possible decisions. As a conclusion, the following elements are of vital importance to turn technology into a success: • Effective decisions need visualisations to create and compare simulations, view alerts and impacts. • Information needs to be shared with stakeholders: collaboration is key. • New tools may trigger organisational change. Hence the importance at DCbrain of consistently engaging a Customer Success Officer to ensure that value is maintained and improved over time after an initial delivery. • A well-documented and secure IT integration process is a prerequisite to move a tool from a proof of concept to an industrialised solution. This element should be taken into account right from the start.

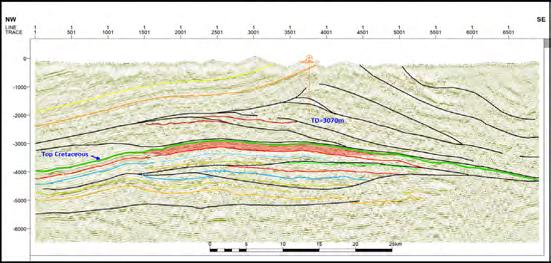
The Madre de Dios basin is a foreland basin with a prospec�ve area of 43,000 km2 and some 5,000m of sedimentary infill. The basin includes the complex fold thrust belt with outcrops of Paleozoic, Cretaceous and Ter�ary age on the south and SW bordered by a foreland basin covered by Quaternary alluvial deposits. Hydrocarbon explora�on in the Madre de Dios basin has been progressively carried out by different companies, which show the existence of a gas poten�al that has been proven with the discovery of the Candamo field.
• There exist at least 5 prospects and 17 leads located in the fold thrust belt and in the foreland area. The leads can be upgraded through acquisi�on of addi�onal detailed seismic and non-seismic methods to confirm closures. • The es�mated volume for prospec�ve resources is of 18,915 BCF.
Prospect “Kusak”
Reservoirs: Vivian, Lower Chonta and Nia Avr. Depth: 5,000 m Fluid type: Gas and Condensate
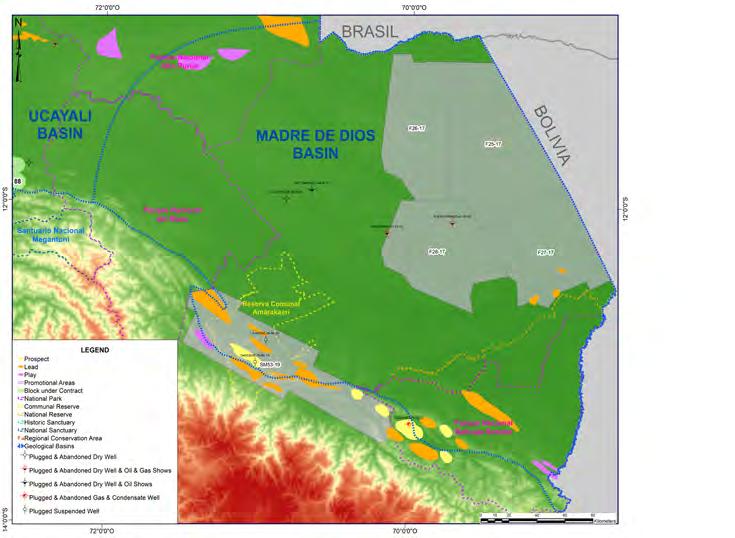
Basin Area: 7.5 MM Ha. Source Rocks: Cabanillas (Devonian), Ambo (Lower Carboniferous) Reservoir Rocks: Vivian-Lower Chonta (Cretaceous), Upper Nia -Lower Nia (Permian) Fluid Type/ °API: Flow Gas and Condensate (Candamo-1X) and 50.8° (Pariamanu-1X)
AVAILABLE DATA
Wells: 7 Exploratory Wells (Wildcats) Acquired 2D Seismic: 8,272 Km (1973-2010) 2D Seismic Reprocessed 2019: 1,800 Km (PSTM), 780 Km (PSDM) 2D Seismic Enhanced by Searcher 2021: 7,923.7 Km Magnetotelluric: 2 lines with 78 sta�ons
PROSPECTIVE RESOURCES
06 Prospects : 5.7 TCF 21 Leads: 14.7 TCF 05 Plays (An�cline 3-4 way closure) Total: 20.4 TCF and 320.59 MMSTB LGN (2U) (Unrisked)
promo�on@perupetro.com.pe
www.perupetro.com.pe
www.UpstreamOpportuni�es.pe
Promo�on Execu�ve Vilma Ruiz Burneo (vruiz@perupetro.com.pe) General Manager Daniel Hokama Kuwae (dhokama@perupetro.com.pe) Explora�on Manager Eris Gabriel Valverde (egabriel@perupetro.com.pe) Promo�on & Contrac�ng Manager Carlos Pan�goso Andonaire (cpan�goso@perupetro.com.pe) Contract Supervision Manager Carlos Bianchi Ramirez (cbianchi@perupetro.com.pe)
The LNG state of play post-COP27
The post COP27 energy landscape is characterised by continued pledges to implement measures to reduce emissions, but with an implementation deficit. Commitments and actions are growing, but they still fall well short of what is needed to limit the rise in global temperatures to 1.5 °C and avert the worst effects of climate change.
The combination of the push to net-zero and a sustainable future world is expected to cost trillions of dollars and requires far more energy than renewable technologies alone can provide. For developed countries, not achieving global climate targets means some additional discomfort in the medium term and a rocky transition to a cleaner energy future; for developing countries, not achieving global climate and emissions targets means continuous testing of their resilience as these countries teeter on the edge of viability.
As the world moves toward cleaner energy sources, natural gas is recognised as having an important role to play in the new energy future. LNG will remain a critical input in ensuring that we achieve affordable and secure climate mitigation.
In the medium term, LNG fundamentals remain strong. Global LNG markets are expected to be tight as Europe’s quest to reduce its dependency on Russian gas increases demand for LNG. This will have knock-on effects on demand growth in China and emerging Asian demand as European markets outbid them for the limited amount of flexible LNG supply.
With tight supply anticipated in the coming five years, prices are expected to remain at elevated levels compared to historical averages over 2017-19, before COVID-19. Moreover, we expect LNG-derived coalto-gas substitution during this period to reduce carbon emissions. With more coal power generation than the LNG needed to substitute for coal, it is expected that there will be healthy LNG demand as well as a short-term fall in emissions.
Expansion in LNG export capacity is projected from countries in Africa such as Mozambique, Australia, the US, Canada and the Middle East. Complementing this is a projection of increased LNG import capacity in key European countries.
There are plans for additional LNG import capacity development in India, Thailand, Vietnam, China and Korea. Global LNG consumption could more than double by 2030, potentially reaching over 600 MT/year under current proposals.
The expansion of LNG infrastructure in this period can be considered as an unanticipated mitigation measure against a potential lack of global climate action implementation to limit temperatures to 1.5 °C or 2 °C. However, long-term LNG expansion is generally not compatible with the potential for emissions reductions (with Paris climate targets of limiting global warming to between 1.5 °C and 2 °C) from LNG through coal-to-gas switching has a hard limit, determined by the availability of coal-based generation. Demand for LNG is expected to gradually decline as developed countries decarbonise, partially substitute renewables for LNG and ramp up their use of hydrogen from non-fossil fuel sources.
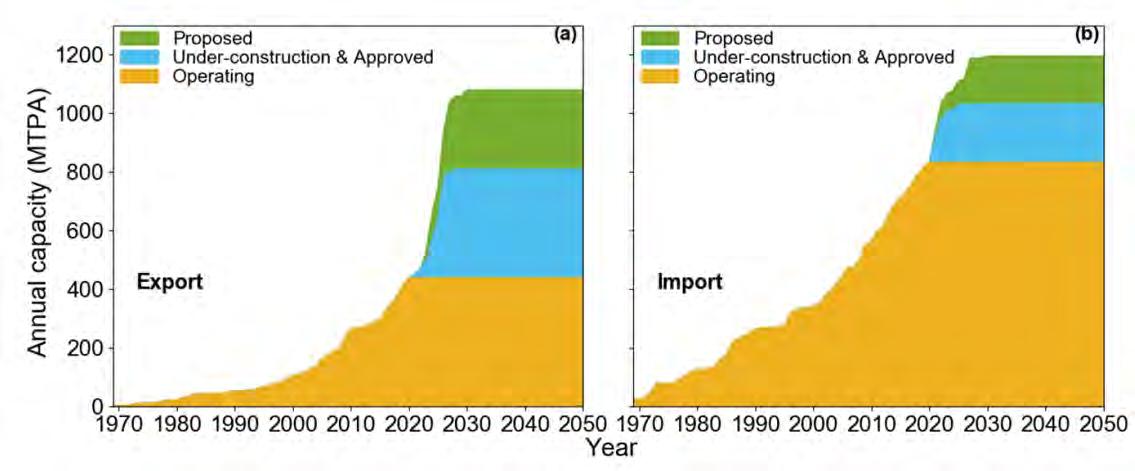
While there is no bottleneck in terms of aggregate LNG terminal import capacity, there is a potential shortfall in LNG export capacity additions that can fully utilise the spare capacity in import terminals, as growth slows in natural gas consumption. Figure 1 shows the shifts in LNG export and import capacity between 1970 and 2050.
But this is not the whole story. Most countries will rely on a combination of mitigation actions, adaptations to climate change, and stakeholder collaboration with internal and external parties to balance the core dimensions of the energy trilemma: affordability and access, energy security and environmental sustainability. In addition, developing countries will have to battle a combination of fiscal constraints, limited financing headroom without restrictions and continued testing of infrastructure and overall viability through climate events.
Consider the Caribbean. For these economies, energy resilience must include sufficiency, reliability, consistency and affordability of energy supplies in the short term, with long-term infrastructure investments incorporating environmental and sustainability concerns, and resilience to climate and other shocks. Among challenges faced by Caribbean energy importers are that dependence on fossil fuels perpetuates a lack of energy security, translating to risks for the economy, environment, and society. Net Caribbean energy exporters face different impacts and different challenges, not least being the pace of transition and a need to balance the use of natural resource endowments for economic development with the responsibility of reducing the impact of their carbon footprints.
While transition orthodoxy and the abundant availability of renewable energy sources in the Caribbean seem to point to a direct path to renewables as the optimal strategy, unique economic challenges and lack of fiscal wiggle room make such a direct transition impracticable. This suggests that a more optimal path for economies such as these may be a transition to natural gas through LNG (scaled appropriately), in addition to renewables.
In short, LNG is poised to play an important and ongoing role in creating a more sustainable future by expanding the reach of clean and abundant gas to regions located long distances from existing supply infrastructure. To maximise existing resources and mitigate the loss of reserves due to stranding, an expansion of the micro-LNG concept (LNG imports and exports, scaled down) will be critical in the coming years as the world increasingly moves towards a more decentralised and distributed approach to power generation. Micro-liquefaction will also accelerate the growth of LNG as a transportation fuel and open new markets for natural gas in regions that have traditionally relied on diesel as a primary fuel source.
Figure 1: Global annual nameplate (a) LNG export capacity and (b) LNG import capacity by project status—proposed (green), under-construction and approved (blue), and operating (yellow) from 1969 to 2050. All the LNG terminals are up to date of November 2020.
Source: Shuting Yang et al (2022) Environ. Res. Lett. 17 064048
Supply crunch prompts fall in global gas demand

Unlike in 2009 and 2020, supply-side factors have left gas demand unmet this year as high prices deter consumption
ROSS MCCRACKEN
Global gas consumption has fallen only twice in the last two decades – in 2009 in the aftermath of the 2008/09 global financial crisis (-2.1%), and, in 2020, as a result of the demand slump wrought by the COVID-19 pandemic (-1.6%).
This year, demand is expected to fall again, owing to the profound shock resulting from the war in Ukraine and the consequent disruption to Russia-EU gas trade. However, unlike the demand-side led declines in 2009 and 2020, in 2022, consumption is expected to fall because of a lack of affordable supply, leaving gas demand unmet.
In regions where gas is readily available, notably North America, demand has continued to increase. Despite higher prices, US gas demand is expected to rise across all end-use sectors this year.
Future growth downgraded
The International Energy Agency (IEA) forecasts that global gas demand will fall 0.5% this year and then grow only slowly through 2025. Having previously forecast 5% growth for the period 2021-24, equivalent to 210 bcm, the IEA now estimates 2% growth, equivalent to 75 bcm.
However, there is a big difference between LNG and pipeline trade. Global LNG trade is expected to increase by an average of just under 4% a year from 2021-2025 (a slower rate than in preceding years), while long-distance pipeline trade drops by an average 1.9% a year. The relatively slow growth of LNG is a function of a lack of new investment decisions preceding the war in Ukraine.
The two principal drivers behind the much-reduced outlook are Europe’s desire to phase out its use of Russian gas – hitherto its largest source of imports – and demand conservation and destruction globally as a result of high gas prices, particularly in the LNG spot market.
This raises the question of how gas demand will rebound, if it can, and what forces will shape its immediate and longer-term future in what will undoubtedly be a ‘new normal’.
Gas demand components
The IEA’s analysis of the drop in gas demand this year suggests less permanent demand destruction than perhaps might be expected. About 40% of its downward revision is the consequence of slower economic growth. 40% results from decisions to delay plans to switch from coal or oil to gas, alongside an increase in decisions to switch away from gas.
The agency says that only 20% of its downward revision is the result of efficiency measures and the substitution of gas for other fuels and energy sources. Of the downward revision, 55% is accounted for by mature gas markets with Europe accounting for the largest share. China and India account for a combined 15% and emerging markets the remaining 30%.
In terms of future demand growth, Asia-Pacific accounts for almost half of the increase to 2025 and the Middle East one third. North America and Africa see modest growth, while demand stagnates in South and Central America and Eurasia, and the decline is heavily concentrated in Europe.
In terms of end user demand, the IEA sees industrial
Natural gas demand in Europe, Jan-Oct 2022 vs 2019-2021 average, main economies (%)
50
40
30
20
10
0
-10
-20
Germany France
Total Power Industry Household Italy Spain EU27
demand as the principal driver of growth, accounting for 60% of the downgraded increase to 2025. Power generation’s contribution falls to less than 10% over the 2021-25 period, as a result of high gas prices, lower electricity demand growth and increased renewable generation. In Europe, gas-for-power demand falls 17% as the region seeks to limit its exposure to gas imports.
Planned distribution network expansion in China, India, and Iran results in higher retail consumption, but heating demand is expected to decline in all mature markets. Some demand growth is expected in the transport sector, principally in China, India, and the Middle East.
Europe: at the centre of the storm
EU gas consumption in the second quarter dropped 16%, or 13.9 bcm year on year, according to Eurostat data. Gas imports were up 3%, despite the slump in Russian gas supplies as more pipeline gas from non-Russian sources and LNG was imported, allowing Europe to refill its storage inventories ahead of winter.
The primary components of the drop in second quarter demand were reduced gas-fired generation, which dropped 7%, less activity on the part of energy-intensive industries, and warmer weather limiting heating demand. The drop in gas demand was particularly heavy in both percentage and volume terms in Germany (-22%) and the Netherlands (-25%).
The fall in gas-fired generation was stemmed by very high coal prices, stable carbon pricing and by less physical capacity to switch, owing to earlier closures of coal plants.
According to the Brussels-based think tank Bruegel, demand reduction over summer came principally from energy-intensive industries, but, by October, significant reductions in household demand were also evident, aided by warm weather. Bruegel estimates EU gas consumption at 10% below the average for 2019-2021 for the JanuaryOctober period, but with demand 25% lower in October.
Across the bloc, the second-quarter fall in gas-fired power generation has been reversed, leaving gas for power demand up 1% over January-October, while industrial and household demand were both down 13%, according to Bruegel.
North America hits demand high
The contrast with the US could not be more evident. The US Energy Information Administration (EIA) estimated in September that US gas consumption will hit a record 86.6 bcfpd (2.5 bcmpd) this year, with demand increasing across all end-use sectors, despite sharply higher prices.
The increase is led by the power sector. The rise in gas prices did not result in a significant switch back to coal as a lack of coal supply and high levels of coal plant retirements stymied increased power generation from the high emissions fuel.
US gas prices did not reach anything like European levels, but, averaging $6.41 per mmBtu in the first eight


