
17 minute read
Research and application of the prediction method for sweet spots of shale gas using geophysical data
from IGU Magazine October 2017
by IGU
By Sheng Chen, Wenzhi Zhao, Yonglin Ouyang, Qingcai Zeng, Qing Yang Huaxing Hou, Shaohua Gai, Shihai Bao and Xinyu Li.
The W1 area in the Sichuan Basin is the first area for shale gas exploration and development in China.This is a case study carried out in the area’s Lower Silurian Longmaxi Formation, which has great resource potential. Many scholars have carried out a great deal of research work, such as the division of sedimentary facies, selection evaluation, reservoir core experiments and so on, and the core area has been preliminarily determined in the W1 area. But geophysical prospecting of sweet spots is just at its beginning and thus has not provided enough information for the deployment of horizontal well drilling. In our study, firstly we used well log interpretation to determine key evaluation parameters of the shale reservoir at the well point, and to study the vertical distribution and variation of the shale reservoir; in this way we could determine the longitudinal distribution of sweet spots. Secondly, seismic rock physics analysis was used to find the elastic parameters that were sensitive to the key evaluation parameters, such as total organic carbon (TOC) and the gas content of the shale gas reservoir. At the same time the quantitative relationships between them were established. Finally, based on the results of seismic rock physical analysis, high quality pre-stack inversion was carried out with the combination of well and 3D seismic data, which was used to predict the plane distribution of the thickness, TOC content, brittleness, pore pressure and other key evaluation parameters of shale reservoir. Comprehensive analysis of the research results was used to determine the distribution of sweet spots.
Shale gas potential is similar in China and the US, but shale gas production is more challenging in China. Shale gas exploration and development has only recently begun in China and seismic-based prediction of sweet spots is still in its infancy.
Prediction of sweet spots is one of the most important procedures in shale gas exploration and development. A sweet spot of shale gas is defined as an area with moderate burial depth, high organic carbon content, high maturity, high gas content, high brittle mineral content, well-developed natural fractures and the easy formation of complex fracture network by fracturing. It is the preferred target for acquiring and maintaining high productivity and realising the effective production of shale gas. Gas content, which is one of the key elements of sweet spots, has great significance to the commercial development of shale gas reservoirs.
Kevin J. Dodds et al. (2007), based on core analysis results and well log data, applied a neural network method to establish a relationship between seismic attributes and gas saturation through a seismic attribute analysis and obtained some positive effects in computing the gas saturation of a shale reservoir with seismic attributes.
Daniel J.K. Ross et al. (2009), based on a detailed analysis of pore structure, TOC and pore fluid composition in the shale reservoir, suggested that the gas content was closely related to porosity and TOC, and basically established the quantitative relationship between gas content and porosity or TOC on the basis of well data.
Amanda M.M. Bustin (2012) performed a systematic study of conditions and major controlling factors for high productivity of shale gas utilising the numerical simulation method, and indirectly obtained the major controlling factors of the gas content in the shale reservoir. Her study result suggests that fracture pore, matrix pore, Young’s modulus and Poisson’s ratio are major geological factors that control shale gas productivity and the interval with high shale gas productivity exhibits evidently high Young’s modulus and low Poisson’s ratio. This study indirectly indicates that gas content is closely related to two seismic petrophysical parameters, i.e. Young’s modulus and Poisson’s ratio.
Y. Altowairqi (2014) carried out a systematic quantitative study of the influences of some parameters (e.g. TOC and gas content) on seismic elastic parameters under the formation pressure through a measurement with artificial rock samples. The study results suggest that P-wave velocity, S-wave velocity and density decrease significantly as TOC and gas content increase. Therefore, a quantitative relationship of gas content and TOC with P-wave velocity, S-wave velocity and density is established.
In recent years, many Chinese scholars have conducted feasibility studies into and put forward arguments for gas potential prediction for shale gas reservoirs using seismic data and obtained some positive effects in tests with actual data volumes.
Li Yuxi et al. (2011) discussed the required conditions for the occurrence of shale gas in reservoirs and analysed the major factors that influence the gas content; they preliminarily stated the role of gas content in the integrated evaluation of the shale gas reservoir, but did not study the prediction method of gas content.
Sun Xiaoqin (2013) applied the seismic attribute analysis method to conduct a correlation analysis of extracted seismic attributes and gas content and determined three attributes that are most sensitive to gas potential: average instantaneous frequency, arc length and average energy. In addition, she established a prediction model for gas content in the shale reservoir in the study area using the multiple stepwise regression method, allowing for prediction of gas content in the Silurian highquality shale for a designed well. Although this method is convenient and efficient, its physical significance remains unclear and may yield multiple solutions.
Liu Chao (2014) determined the lithological combination of high-quality shale interval in the Jurassic shale gas reservoir, the Jiannan region, and its seismic responses through a combination of drilling data and well log data. The waveform classification technique was used to predict the variations of lithology and lithofacies, the spectral attenuation technique was applied to predict the gas potential of highquality shale, and the gas prospects were defined based on the results of classified waveform prediction. Although this method is highly comprehensive, it provides a qualitative prediction of gas potential instead of attempting to specifically analyse the spectral responses of the shale gas reservoir.
Guo Xusheng (2015) suggested density as the most sensitive parameter for gas content through a cross-plot analysis of core-tested gas content and geophysical elastic parameters, built a mathematical model between gas content and density, computed the gas content data volume from the density volume obtained from pre-stack inversion and obtained some positive effects in quantitative prediction of gas content. This method, however, applies the density parameter only to predict the gas content and hence is highly risky. But geophysical prospecting of sweet spots is just at its beginning and thus has not provided enough information for the deployment of horizontal well drilling.
In our study we use the method of well log interpretation to derive key evaluation parameters of a shale reservoir at the well point and
Message from the Chairperson of Beijing Gas Group
It has been 31 golden years for China’s natural gas industry since the country joined the IGU family as a Charter Member in 1986. After three decades of rapid development, China has become the third largest natural gas consumer and the sixth largest producer. In 2016, the natural gas industry in China saw 204 bcm in consumption and 134 bcm in production. China has established national trunk lines including the first, second and the third West-toEast Gas Pipelines, with a total length extending 60,000 km. There are 12 LNG receiving terminals with an annual receiving capacity exceeding 43 million tonnes.
We are closely connected with international gas markets. China has become the third largest gas importer with an annual import volume exceeding 70 bcm, equal to a 35% reliance on imports. We imported over 35 bcm of pipeline gas through the China-Central Asia Gas Pipeline and China-Myanmar Gas Pipeline, and 26 million tonnes of LNG through coastal LNG receiving terminals from over 10 countries including Australia and Qatar.
There remains great scope for further growth in demand in China. One of the primary drivers is urgency for emissions reduction and air pollution control. China consumes nearly 4 billion tonnes of coal annually, in which 20% is through the burning of loose coal. Coal accounts for 62% of primary energy consumption, while natural gas accounts for only 6.5% of the energy mix, lagging far behind the 24% world average. Converting coal to
gas is the most effective and practical approach to control air pollution and reduce emissions. Another driver is urbanisation. Currently, the urbanisation rate in China is less than 60%. Accelerated urbanisation in the coming years will further promote natural gas consumption. In addition, natural gas infrastructure in China needs to be improved. The average per capita natural gas pipeline is only 0.5 metres long, half of the world average. Natural gas storage capacity is only 2.5% of annual consumption, far lower than the world average.
China has been endowed with rich natural gas resources, with 50 trillion cubic metres (tcm) of recoverable conventional gas, 22 tcm of recoverable shale gas, 12.5 tcm of coal bed methane and nearly 100 billion tonnes of gas hydrates.
The Chinese natural gas industry enjoys a favourable policy environment. The 13th Five Year Plan states that we will accelerate the development of the gas industry and increase the ratio of natural gas in the primary energy mix. By 2020, natural gas consumption will reach 300 bcm, accounting for 8.3-10% of primary energy consumption. We are retrofitting heating supply system in northern China to replace coal with clean energy, following the guideline of “adopting natural gas or electricity depending on the actual situation”. In the next five years, heating in large areas of northern China will be powered by natural gas.
China is a successful case in point for natural gas development with Beijing enjoying particularly rapid development in natural gas use. In the past twenty years, natural gas purchase volumes increased from 130 million cubic metres to 16 bcm, ranking second in the world after Moscow. Natural gas accounts for 31.5% of the energy mix in Beijing, exceeding the world average, and is expected to reach 35% by 2020. With the significant increase of natural gas, coal consumption volumes have been reduced to less than 9.5 million tonnes.
The progress of the natural gas industry in China benefited from huge support from the global gas industry. China looks forward to strengthening cooperation with countries around the world under the IGU framework and jointly promoting the development of the gas industry worldwide. We are willing to carry forward IGU’s proud tradition and contribute our efforts and resources to serve IGU members by making IGU more influential, impactful and sustainable through innovation, cooperation and sharing.
Li Yalan is Chairperson of Beijing Gas Group Company Limited.
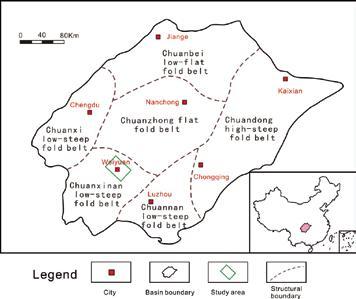
Regional tectonic setting of the study area
z Figure 1. to study the vertical distribution and variation of the shale reservoir. In this way we can determine the distribution of sweet spots in the longitudinal direction.
Geological setting Structures
The Sichuan Basin, covering an area of 1.18 million km ² is among the largest petroliferous basins in China. It is surrounded by the Daloushan, Dabashan, Micangshan and Longmenshan orogenic belts. It includes six tectonic units: the Chuandong high-steep fold belt, Chuanbei low-flat fold belt, Chuanxi lowsteep fold belt, Chuanzhong flat fold belt, Chuannan low-steep fold belt and Chuandong high-steep fold belt. The Wei204 block lies in the Chuannan low-steep fold belt as shown in Figure 1.
Stratigraphy and shale reservoirs
Two suites of high-quality shale exist in the Lower Cambrian Qiongzhusi Formation and the Lower Silurian Longmaxi Formation. The latter is discussed in this paper. The Lower Silurian Longmaxi black shale and overlying Shiniulan limestone constitute a good reservoir-seal assemblage. The entire Longmaxi Formation has abundant graptolite of about 500m thick throughout the block, which is a product of deepwater shelf deposition indicating a strong reducing environment. The Longmaxi Formation comprises two distinctive sections. The upper section, the Long 2 Member, is composed of some siliceous streaks and limestone with TOC content less than 2%. The lower section, the Long1 Member, encompasses carbonaceous shale and black shale rich in lamellae, with TOC content higher than 2%. The Long 1 Member is subdivided into two sub-members as per TOC content, Long 1-1 and Long 1-2.
Data and methods
In this paper, shale gas sweet spots were predicted based on logging and 3D seismic data. First, using the method of well log interpretation we derive the key evaluation parameters of the shale reservoir at the well point and to study the vertical distribution and variation of the shale reservoir. Second, seismic rock physics analysis was used to define the elastic parameters that were sensitive to the key evaluation parameters, such as TOC and gas content of the shale reservoir, and the quantitative relationships between them were established. Finally, based on the results of seismic rock physical analysis, pre-stack simultaneous inversion with a combination of logging and seismic data was used to predict the plane distribution of the thickness, TOC content, brittleness and other key evaluation parameters of the shale reservoir. The research results were comprehensively analysed to determine the distribution of sweet spots and to predict the plane distribution of sweet spots. The results show that sweet spots are characterised by low density, low P-velocity, low P-wave impedance, low velocity ratio and low Poisson’s ratio. Shale gas sweet spots in this block are vertically concentrated within 30m
x Figure 2.
xv Figure 3. of the bottom of the Longmaxi Formation and laterally distributed in the southeast and southwest of the 3D seismic area. These results obtained by the integration of logging and seismic technologies provide useful information for horizontal well deployment and well bore trajectory design. The workflow is shown in Figure 3.
Elastic parameters, including P-velocity, S-velocity and density, were derived from pre-stack simultaneous inversion on seismic gathers (Arcangelo et al., 2011; D.E. Miller, 2012). The parameters were then used to estimate shale properties.
We used reservoir thickness, TOC content and gas content to predict geologic sweet spots. According to the study of Caineng Zou et al. a Longmaxi shale sweet spot is defined to be a region thicker than 30m with TOC content above 3% and gas content above 2.5 m ³ /m ³ (Zou et al., 2016). This definition was used as a standard in shale prediction in the Sichuan Basin.
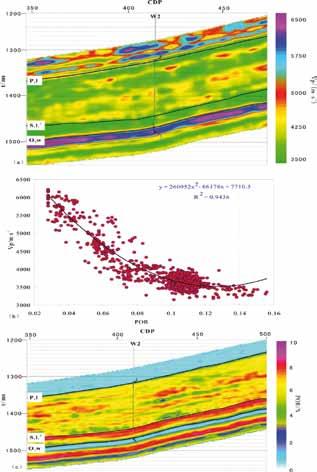
Shale porosity and thickness were predicted with inverted P-velocity by the relationships derived from petrophysical analyses. The relationship between porosity and P-velocity shown in Figure 4 is formulated as follows.
2a. P-velocity inversed from seismic data, 2b. Relationship between P-velocity and porosity of Longmaxi shale, 2c. Porosity converted from pre-stack inverted P-velocity.
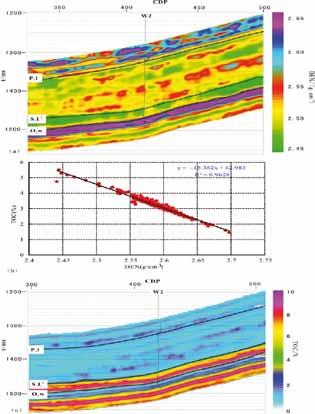
3a. Density inversed from seismic data, 3b. Relationship between density and TOC content of Longmaxi shale, 3c. TOC content converted from pre-stack inverted Density.
The correlation coefficient between P-velocity (Vp) and porosity ( ∅ ) is 94%.
Equation 1: Vp=260952 ∅ ^2-66178 ∅ +7710.5
The correlation coefficient between TOC and density (DEN) is 96%. TOC content was estimated as a function of density in accordance with the linear relationship derived from petrophysical analysis.
Equation 2: TOC=-15.362*DEN+42.983
TOC is the TOC content of the shale reservoir and DEN is density of the reservoir. TOC content was predicted by above equation with density obtained by pre-stack inversion.
An engineering sweet spot was defined to be a region with high brittleness. Rock brittleness is generally estimated with brittle mineral content or rock mechanical parameters. The latter was used in this study. As per the study of a mass of experiments and production data by Goodway et al. in 2010 (Goodway et al., 2010; M Khandelwal., 2016) rock brittleness increases with Young’s modulus and decreases with Poisson’s ratio. Young’s modulus and Poisson’s ratio were normalised and then averaged to calculate the brittleness index. The formula is shown as follows.
Equation 3: BR=[(YM-YMmax)/(YMminYMmax)+(PR-PRmin)/(PRmax-PRmin)]*0.5
BR is the brittleness index (a larger index indicates good brittleness); YM is Young’s modulus; PR is Poisson’s ratio. YM and PR were derived from prestack inversion.
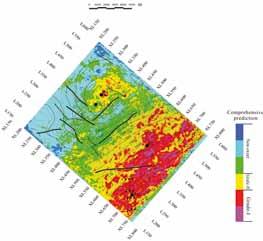
Comprehensive sweet spot evaluation is based on the prediction of geologic sweet spots and engineering sweet spots. A geologic sweet spot coinciding with an engineering sweet spot is ranked to be of Grade I. A geologic or engineering sweet spot alone is ranked to be of Grade II. Other regions are excluded from sweet spots.
Result and discussion
Figure 2a shows an inverted velocity profile, the interval of
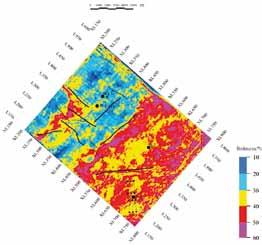
Brittleness index map (Average brittleness index map for S1l11submember, Longmaxi Formation, W1 block) predicted by 3D seismic data.
interest with low velocity is plotted in green. Figure 2b shows the function between the porosity and P-velocity. Figure 2c shows a section of seismic porosity converted from inverted velocity, the curve inserted is log interpreted porosity.
Figure 3a shows a density profile across Well W1; low density, which is related to high TOC content, occurs at the bottom of the Longmaxi Formation. Figure 3b shows the linear correlation between TOC content and density log. Figure 3c shows a section of TOC content converted from density data shown in Figure 3a. TOC content at the bottom of the Longmaxi Formation is above 3% and reaches 7% at most.
High-quality shale reservoirs exhibit high Young’s modulus and low Poisson’s ratio (Grieser and Bray, 2007). The brittleness index is more practical for the characterisation of rock brittleness (Rickman, 2008). In this study we used this method to evaluate shale brittleness. The sections of Young’s modulus, Poisson’s ratio and brittleness index calculated by Equation 3 are shown in Figure 4. The highquality shale interval at the bottom of Lon g1-1 exhibits high Young’s modulus, low Poisson’s ratio and consequent high brittleness. Figure 3 shows the average brittleness index map for Long 1-1. Brittleness index in this block ranges 25%-65% with an average of 45%.
An evaluation scheme is drafted in accordance with shale gas production in this
z Figure 4.
Sweet spot grading and evaluation scheme for Longmaxi shale
Class Class I zone Class II zone Class III zone Thickness (m) ≥30 ≥30 <30 TOC (%) ≥3 2-3 <2 Porosity (%) ≥5 3-5 <3 Brittleness index ≥55 45-55 <45
z Figure 4Table 1 block and neighbouring prospects, as shown in Table 1. Sweet spots have been evaluated to be of two grades, as shown in Figure 5. Grade I sweet spots which are in a very warm colour (purple and red) have good properties for gas production and Grade II sweet spots which are in a warm colour (brown and yellow) are taken as the successors which may be exploited in the future. It is suggested that development wells are not deployed in other regions.
Conclusions
◆
Sweet spots in Longmaxi shale are concentrated within 30m above the bottom in accordance with logging interpretation. Sweet spots are characterised by high acoustic time, high
x Figure 5. GR, high porosity, high Young’s modulus, high
Comprehensive prediction of sweet spots.
TOC content, high gas content, low density and low Poisson’s ratio. ◆
There is a negative correlation between TOC content and density. TOC content increases linearly as density decreases and was predicted with density data derived from pre-stack inversion. Shale porosity was calculated with P-velocity derived from pre-stack inversion. Gas content was calculated by multivariate stepwise regression. A geologic sweet spot was defined by TOC content, porosity and gas content. ◆ The brittleness index was calculated with Young’s modulus and Poisson’s ratio derived from pre-stack inversion. The Fillippone method was used to predict formation pressure and overpressure. The attribute of curvature was used to predict natural fractures. An engineering sweet spot was defined by brittleness index, formation pressure and fracture distribution. ◆ As per comprehensive examination of key parameters calculated based on logging interpretation and seismic inversion, two grades of sweet spots were evaluated. Grade I sweet spots with good properties are the best candidates for production and Grade II sweet spots with moderate properties are the successor for shale gas production in the future. Well drilling in other regions is not advised.
Acknowledgements
The authors gratefully acknowledge the PetroChina Research Institute of Petroleum Exploration & Development (RIPED), Langfang for their permission to publish this paper and for their provision of software and data sets.
Dr Sheng Chen is a Petroleum Engineer from the China University of Petroleum (Beijing) and RIPED. Dr Wenzhi Zhao, Dr Yonglin Ouyang and Dr Qingcai Zeng are Professors at RIPED. Qing Yang is a Geophysics Engineer at RIPED. Huaxing Hou is a postgraduate at RIPED. Dr Shaohua Gai is a Geography Engineer at China University of Petroleum (Beijing). Shihai Bao and Xinyu Li are Geography Engineers at RIPED. The original, fully referenced version of this paper, part of the proceedings from IGRC 2017, will be available to download from the IGU website (www.igu.org) after November 26, 2017.


