The Effect of Earthquake-induced Pounding on the Response of a Series of Neighboring Buildings
M. Diaa Eldin1,3 Department of Basic Engineering sciences, Benha Faculty of Engineering, Benha University, Egypt
Structural Engineering Department, Faculty of Engineering, Delta University for Science and Technology, Egypt
Structural Engineering Department, Faculty of Engineering, Tanta University, Egypt
Received: 12 Oct 2022;
in revised form:
Sep 2022;
Oct 2022;
Oct
Abstract The phenomenon of pounding that occurs during earthquakes for adjacent buildings may cause severe damage to the structure and may cause a complete collapse of the structure. This paper aims to make a comparison between the practical and theoretical results resulting from the work of Matlab Code, taking into account the calculation of the pounding force between adjacent towers, and study the effect of changing the coefficient of restitution on the acceleration time history and pounding force between adjacent buildings, study the peak impact force with respect to the stiffness of impact spring element. An impact simulation is carried out numerically using a nonlinear viscoelastic model. The results showed that the higher the coefficient of restitution, the lower the pounding forces between adjacent buildings and the maximum acceleration value. It also resulted from the study that the higher the impact stiffness parameter, the greater the pounding force between adjacent buildings.
Keywords Coefficient of restitution, Pounding force, Seismic analysis, Series of buildings.

I. INTRODUCTION

Due to the rise in population and the limited amount of available land space in crowded metropolitan areas, buildings are positioned close to one another. High height buildings have historically housed offices for businesses, but recent years have seen a growth in residential use [1] With the construction of modern structures, that are built close together, the pounding of structures is becoming a new essential commodity. The word "pounding" is used by previous researchers [2 6] to describe when two neighbouring constructions are close to one another and collide as a result of lateral loading. Previous researchers have also referred to "pounding of structures" as contact between neighbouring structures [7, 8]. Due to their out of phase vibration brought on by earthquake stimulation (i.e., mass or rigidity) clash. Similar to Jankowski [9],[10] characterised structural hammering as out of phase vibrations that can also happen during high wind conditions. According to previous field evidence, the
pounding phenomenon has caused light to substantial structural damage that has even led to widespread structural collapses [11]. Numerous academics have in the past examined these pounding events in great detail, especially in relation to previous earthquake occurrences [4, 5, 9, 11 15]. To comprehend the pounding behaviour, a number of numerical studies have been carried out using various numerical simulation modelling techniques. For instance, Jankowski (2005a) [16] used a nonlinear viscoelastic model to simulate the impact force between two nearby single degree of freedom systems. Since it was discovered that it has a substantial impact on how they collide, the study supported the significance of the natural frequencies of nearby buildings. Miari et al. [17] investigated the seismic pounding between nearby structures with various base conditions. [18]. The study of the mutual pounding of multistory buildings was another area of focus. For instance, Anagnostopoulos and Spiliopoulos explored the pounding between multi story
structures using multi degree of freedom (MDOF) systems with lumped mass at each story level (1992). The findings supported the hypothesis that substantial overstresses could emerge from pounding in the event of unequal building heights. Maison and Kasai (1992) [4] investigated the impact of two nearby structures that were each 8 stories and 15 stories tall. The investigation comprised formulating and resolving the MDOF systems' motion equations that represented the examined buildings. Karayannis and Favvata investigated the ductility requirements as well as the seismic pounding response of reinforced concrete structures with unequal heights (2005)[19]. significant rise in the ductility requirements for the building's taller columns [18]. Numerous researches used numerical and experimental methodologies to simulate the structural pounding behavior during lateral excitation [20, 21] and experimental approaches [22 25].
Studies using single degree of freedom (SDOF) systems have explored the response of buildings to pounding with the aid of numerical analysis [24, 26] and one directional research [27 30]. Other research has modified their structural pounding evaluation through the use of several degrees of freedom (MDOF) [31 34]. Among the experimental studies that were conducted on three adjacent towers with SDOF is El Khoriby [34]. Three tower models with varying frequencies were used in the investigation. The towers were tested in two different configurations. In the first arrangement, a rigid tower was positioned in the center of two flexible structures. The conclusions of the experimental study clearly show that pounding may have a major effect on the behaviour of the structures. Because they serve as stoppers for the flexible constructions, they also demonstrate that the rigid towers are more affected by pounding than the flexible ones.
In this paper, a comparison is made between the experimental and numerical studies for three adjacent buildings [34] and the effect of variance on the coefficient of restitution.
II. MATHEMATICAL MODEL
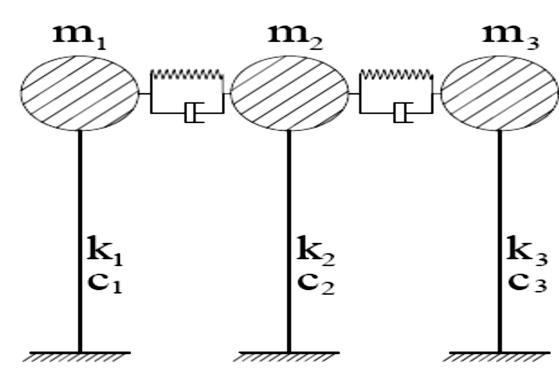
A series of adjacent buildings that have been modelled as elastic SDOF systems are taken into account in the current investigation. The generic dynamic equation of motion (see Fig. 1) that describes the collection of buildings is expressed as:
Fig. 1 Mathematical model for a series of three adjacent structures
[m]{x(t)}+[c]{x(t)}+[k]{x(t)}+{fimp(t)} = [m]{xg(t)} (1)
Where {xg(t)} is the acceleration vector of the input ground motion and {fimp(t)} is the impact force vector for the colliding adjacent buildings, and {x(t)}, {x(t)}, {x(t)} are the displacement, velocity, and acceleration vectors, respectively; [m],[c] and [k] are the mass, damping, and stiffness matrices, respectively, for buildings.
[m]=[m1 0 0 0 m2 0 0 0 m3],{x(t)}={x1(t) x2(t) x3(t)},
[c]=[C1 0 0 0 C2 0 0 0 C3],{x(t)}={x1(t) x2(t) x3(t)},
[k]=[k1 0 0 0 k2 0 0 0 k3] ,{x(t)}={x1(t) x2(t) x3(t)} and
{fimp(t)}={ fimp1(t) fimp2(t) fimp1(t) fimp2(t) }
The contact element is activated when there is an impact in the pounding model, which is based on contact force. The non linear damper is only triggered during the approach phase of a collision, and the contact element is thought to be a Hertzdamp model (Non Linear Viscoelastic Model) where a non linear spring applying the Hertz law of contact is applied. When two nearby constructions collide, the impact force is stated as follows:
Fimpi(t) =0 forδ(t)≤ (nocontact) (2 a)
Fimpi(t) =βδ 3 2(t)+c(t)δij(t)forδ(t)>0andδ >0 (contact ��������������ℎ������������) (2 b)
This article can be downloaded from here: www.ijaems.com
©2022 The Author(s). Published by Infogain Publication. This work is licensed under a
http://creativecommons.org/licenses/by/4.0/
Fimpi(t)=βδ 3 2(t)forδ(t)>0������δ≤0 (contact restitutionperiod) (2 c)
where δ(t) describes the deformation of the colliding structures, δij(t) denotes the relative velocity between them and may be expressed as following:
δ(t)=x1(t) x2(t) d ;
c(t)=2ξ√β√δ(t)
m1m2 m1 +m2
Table
Tower
Mass
(3)
where m1 and m2 are the masses of colliding structures, and β is the impact stiffness parameter. It depends on the geometry and material properties of the colliding structures, and it is considered to be 2.75x10⁹ ��/��3⁄2 see, Jankowski [35]. Moreover, d is the initial gap distance, and ξ is the impact damping ratio. It can be obtained as following:
ξ= 1 cr cr (α+0204) +3.351crπ ; α=105cr 0653 (4)
where cr is the coefficient of restitution, which accounts for the amount of dissipated energy during impact. It depends on both the geometry and the material properties of the impacting surfaces and on the value of the relative prior impact velocity of colliding surfaces, xg(t) is the acceleration of the ground motion [36].
III. VERIFICATION WITH PREVIOUS STUDIES
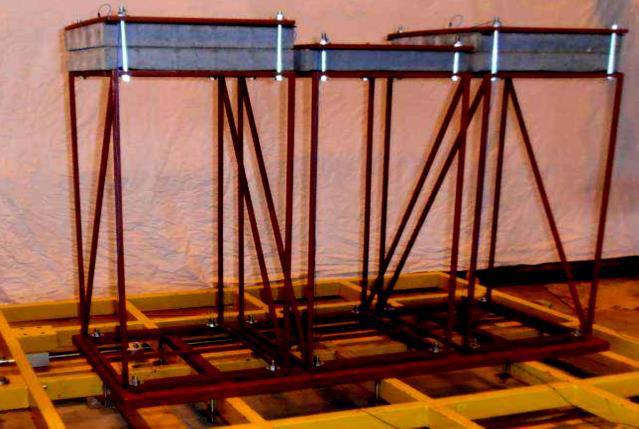
The efficiency of the model used in the current research was tested by comparing its results with the experimental results reported by [34]. Three adjacent SDOF buildings (see Fig. 2) with structural properties shown in Table 1 were experimentally tested under the 1989 Loma Prieta, NS (Corralitos station) with an amplification of 50% from ground motion data. The coefficient of restitution "cr" is considered to be 0.4; see [36].
Time period
Damping
Fig. 2 Experimental study carried out by El Khoriby et al. (2015)
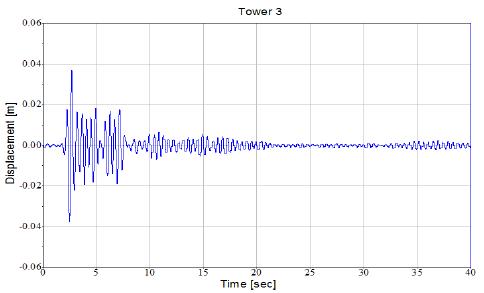
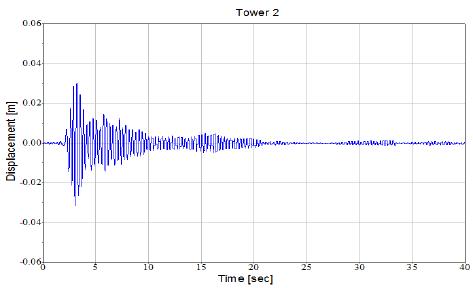
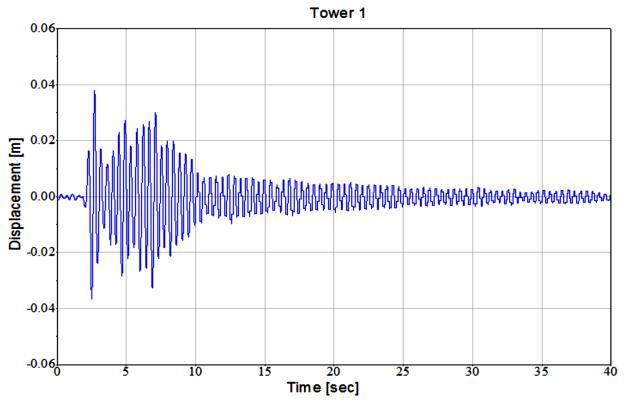
Fig. 3 shows a comparison between the displacement time history for the independent behaviour (gap size =6 cm) for experimental and numerical studies.
This article can be downloaded from here: www.ijaems.com
©2022 The Author(s). Published by Infogain Publication. This work is licensed under a Creative Commons Attribution 4.0 License. http://creativecommons.org/licenses/by/4.0/
Tower 1
Displacement [m]
Time [sec]
Displacement [m]
Tower 2
Displacement [m]
Time [sec]
Tower 3
Displacement [m]
Displacement [m]
Time [sec]
Displacement [m]
0.06
0.04
0.02
0
-0.02
-0.04
-0.06
0 5 10 15 20 25 30 35 40
Time [sec]
0.06
0.04
0.02
0
-0.02
Displacement time historyofTower 1 -0.06
-0.04
0 5 10 15 20 25 30 35 40
Time [sec]
Displacement time historyofTower 3
0.06
0.04
0.02
0
-0.02
-0.04
Displacement time historyofTower 2 -0.06
0 5 10 15 20 25 30 35 40
Time [sec]
a b
Fig. 3 displacement time history for independent behavior (a) The experimental study El Khoriby et al. (2015), (b) the numerical study
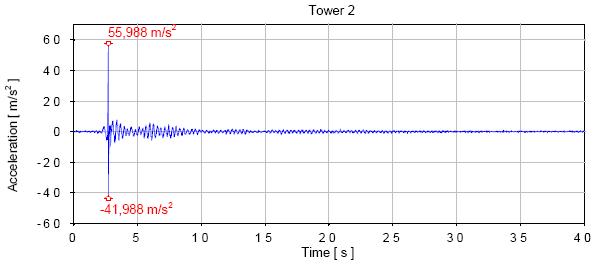
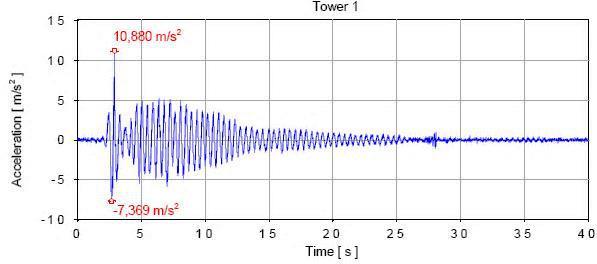
Fig. 4 shows the acceleration time history for three adjacent buildings in the case of a gap size of 4 cm.
This article can be downloaded from here: www.ijaems.com
©2022 The Author(s). Published by Infogain Publication. This work is licensed under a Creative Commons
4.0 License. http://creativecommons.org/licenses/by/4.0/
Tower 1
Acceleration [m/s^2]
Time [sec]
Tower 2
Acceleration [m/s^2]
Time [sec] Tower 3
Acceleration [m/s^2]
15
10
Acceleration [m/s^2]
5
-5
-10
-15
5 10 15 20 25 30 35 40
Time [sec]
Time [sec]
This comparison shows that the results from the mathematical model give a good result when compared to the experimental study. Table 2 shows the difference ratio between the experimental and the numerical study.
This article can be downloaded from here: www.ijaems.com
80
60
40
20
Acceleration time historyofTower 1 -40
Acceleration [m/s^2] Time [sec]

0
-20
5 10 15 20 25 30 35 40
Acceleration time historyofTower 3
Acceleration [m/s^2] a B
Acceleration time historyofTower 2 -40 -35 -30 -25 -20 -15 -10 -5
5 10 15
5 10 15 20 25 30 35 40
Time [sec]
Fig. 4 Acceleration time history for independent behaviour (a) The excremental study El Khoriby et al. (2015), (b) the numerical study
©2022 The Author(s). Published by Infogain Publication. This work is licensed under a Creative Commons Attribution 4.0 License. http://creativecommons.org/licenses/by/4.0/
Table 2. The difference ratio between the experimental and the numerical study
case Max. displacement for the Independent case ( gap size 6 cm) Difference (%)
Experimental Numerical
Max. acceleration for the Pounding case (gap size 4 cm) Difference (%)
Experimental numerical
Tower 1 0.038 0.042 10.53 10.88 10.02 7.9
Tower 2 0.032 0.033 3.1 55.98 55.8 0.32
Tower 3 0.037 0.041 10.8 43.77 33.86 22.6
IV. EFFECT OF COEFFICIENT OF RESTITUTION
A study was conducted to determine how the coefficient of restitution affected the structural response. In this parametric study, we will study the effect of changing the coefficient of restitution on the seismic response (Acceleration time history) and on the pounding force. Different values of the coefficient of restitution Cr range from 0.4 to 0.65. Fig. 5 shows the relation between the coefficient of restitution and the peak acceleration for tower 1, tower 2, and tower 3, respectively.
15
10
5
Tower 1 Max. Acceleration Min. Acceleration
Peak Acceleration [m/s^2] Coefficient ofRestitution
-40 -30 -20 -10 0 10 20 30 40 50 60 70 0.3 0.35 0.4 0.45 0.5 0.55 0.6 0.65 0.7
0
-5
-10
-15
Peak Acceleration [m/s^2] Coefficient ofRestitution
0.3 0.35 0.4 0.45 0.5 0.55 0.6 0.65 0.7
Tower 3 Max. Acceleration (a)
Tower 2 Max. Acceleration -40 -35 -30 -25 -20 -15 -10 -5 0 5 10 15
Peak Acceleration [m/s^2] Coefficient ofRestitution
This article can be downloaded from here: www.ijaems.com
0.3 0.35 0.4 0.45 0.5 0.55 0.6 0.65 0.7
(b) (c)
Fig. 5. Peak acceleration with relation to coefficient of restitution for (a) Tower 1, (b) Tower 2, and (c) Tower 3
The results show a uniform decrease in the peak acceleration when the coefficient of restitution increases; see Fig. 5.
©2022 The Author(s). Published by Infogain Publication. This work is licensed under a Creative Commons Attribution 4.0 License. http://creativecommons.org/licenses/by/4.0/
Peak Pounding Force [N]
1700
1500
1400
1300
1800 0.35 0.4 0.45 0.5 0.55 0.6 0.65 0.7
Coefficient ofRestitution
the figure that the general trend for all impact forces between adjacent towers increases with increasing impact spring stiffness.
Different values of the impact spring stiffness were taken from 125∗109 N/mm^(3⁄2) to 4∗109N/mm^(3⁄2) the peak impact force between tower 1 and tower 2 show nearly linear increase from 950.09 N to 2295.27 N, while between tower 2 and tower 3 show nearly linear increase from 1674.75 N to 4677.64 N.
2950 3000 3050 3100 3150 3200 3250 3300 3350 3400
Peak Pounding Force [N] Coefficient ofRestitution
0.4 0.45 0.5 0.55 0.6 0.65 0.7
(b)
Fig. 6 Peak impact force with relation to coefficient of restitution (a) between Tower 1 and Tower 2; (b) between Tower 2 and Tower 3
Fig. 6 shows the peak value of impact forces versus the coefficient of restitution. The results show that when the coefficient of restitution increases, the peak impact force decreases uniformly. The peak impact forces between tower 1 and tower 2 are 1715 N, 3445 N for CR = 0.4 and 1251 N, 2926 N for CR = 0.65, respectively.
V. EFFECT OF STIFFNESS OF IMPACT SPRING
The impact stiffness parameter is one of the most significant factors that affect the impact force during a collision. Fig. 7 shows the peak values of impact forces with respect to impact spring stiffness. It can be seen from
Impact Force [N]
2200
2000
1800
1600
1400
1200
1000
2400 1.25 1.5 1.75 2 2.25 2.5 2.75 3 3.25 3.5 3.75 4
*10^9
Stiffness parameter (N/mm^(3/2))
4600
4100
3600
3100
2600
Impact Force [N] Stiffness parameter (N/mm^(3/2))
2100
(a) (b)
5100 1.251.51.75 2 2.252.52.75 3 3.253.53.75 4
*10^9
Fig. 7. Peak impact force with respect to impact stiffness (a) between Tower 1 and Tower 2; (b) between Tower 2 and Tower 3.
VI. CONCLUSION
The nonlinear viscoelastic model (Hertzdamp) was used in this study's Matlab code to simulate pounding between a series of three adjacent structures with different natural frequencies. The numerical model was initially verified by contrasting its predictions with the experiment results on three adjacent buildings. The results revealed that the
This article can be downloaded from here: www.ijaems.com 7 ©2022 The Author(s). Published by Infogain Publication. This work is licensed under a Creative Commons Attribution 4.0 License. http://creativecommons.org/licenses/by/4.0/
mathematical model is in good agreement with the experimental study. The paper also investigates the effect of different values of the coefficient of restitution on their pounding response, as well as, the effect of different values of the impact spring stiffness on the peak impact force between series of adjacent buildings.
As a general trend, it is observed that, the higher the restitution coefficient, the lower the pounding force between adjacent structures. The coefficient of restitution was changed from 0.4 to 0.65, and it was concluded that the pounding force between the first and second towers decreased in the case of the restitution coefficient of 0.65 by 27% than its value in the case of the restitution coefficient of 0.4 where the pounding force between the second and third towers decreased in the case of the restitution coefficient of 0.65 by 12.5% than its value in the case of the restitution coefficient of 0.4, also. Moreover, the results revealed that, the general trend for all impact forces between adjacent towers increases with increasing impact spring stiffness.
REFERENCES
[1] M.M. Ali, K.S. Moon,(2007) Structural developments in tall buildings: current trends and future prospects, Architectural science review, (50) 205 223.
[2] S.A. Anagnostopoulos, K.V. Spiliopoulos,(1992) An investigation of earthquake induced pounding between adjacent buildings, Earthquake engineering & structural dynamics, (21) 289 302.
[3] B.F. Maison, K. Kasai,(1990) Analysis for a type of structural pounding, Journal of Structural Engineering, (116) 957 977.
[4] B.F. Maison, K. Kasai,(1992) Dynamics of pounding when two buildings collide, Earthquake engineering & structural dynamics, (21) 771 786.
[5] K. Kasai, B.F. Maison,(1997) Building pounding damage during the 1989 Loma Prieta earthquake, Engineering structures, (19) 195 207.
[6] S. Efraimiadou, G.D. Hatzigeorgiou, D.E. Beskos,(2013) Structural pounding between adjacent buildings subjected to strong ground motions. Part I: The effect of different structures arrangement, Earthquake Engineering & Structural Dynamics, (42) 1509 1528.
[7] C.G. Karayannis, M.J. Favvata,(2005) Inter story pounding between multistory reinforced concrete structures, Structural engineering and mechanics: An international journal, (20) 505 526.
[8] M.J. Favvata, C.G. Karayannis, V. Anagnostopoulou, Influence of infill panels with and without openings on the pounding effect of RC structures,in.
[9] R. Jankowski,(2009) Non linear FEM analysis of earthquake induced pounding between the main building and the stairway tower of the Olive View Hospital, EngineeringStructures, (31) 1851 1864.
This article can be downloaded from here: www.ijaems.com
[10] M.M. Abdullah, J.H. Hanif, A. Richardson, J. Sobanjo,(2001) Use of a shared tuned mass damper (STMD) to reduce vibration and pounding in adjacent structures, Earthquake engineering & structural dynamics, (30) 1185 1201.
[11] E. Rosenblueth, R. Meli,(1986) The 1985 mexico earthquake,Concrete international, (8) 23 34.
[12] S.A. Anagnostopoulos,(1988) Pounding of buildings in series during earthquakes, Earthquake engineering & structural dynamics, (16) 443 456.
[13] R. Jankowski,(2012) Non linear FEM analysis of pounding involved response of buildings under non uniform earthquake excitation, Engineering Structures, (37) 99 105.
[14] H.B. Kaushik, K. Dasgupta, D.R. Sahoo, G. Kharel,(2006) Performance of structures during the Sikkim earthquake of 14February2006, CurrentScience, 449 455.
[15] T. Brown, A. Elshaer,(2022) Pounding of structures at proximity: A state of the art review, Journal of Building Engineering, (48) 103991.
[16] R. Jankowski, Impact force spectrumfor damage assessment of earthquake induced structural pounding, in, Trans Tech Publ, pp.711 718.
[17] M. Miari, K.K. Choong, R. Jankowski,(2019) Seismic pounding between adjacent buildings: Identification of parameters, soil interaction issues and mitigation measures, Soil Dynamics andEarthquake Engineering,(121) 135 150.
[18] H. Elwardany, B. Mosa, M. Khedr, D. Eldin, A. Seleemah,(2022) Effect of earthquake induced pounding on the response of four adjacent buildings in series, STRUCTURAL ENGINEERING AND MECHANICS, (83) 153 166.
[19] C.G. Karayannis, M.J. Favvata,(2005) Earthquake induced interaction between adjacent reinforced concrete structures with non equal heights, Earthquake engineering & structural dynamics, (34) 1 20.
[20] J.P. Conoscente, R.O. Hamburger, J.J. Johnson, Dynamic analysis of impacting structural systems, in, AA Balkema Rotterdam, pp.3899 3903.
[21] S. Muthukumar, R. DesRoches,(2006) A Hertz contact model with non linear damping for pounding simulation, Earthquake engineering & structural dynamics, (35) 811 828.
[22] A. Rezavandi, A.S. Moghadam,(2007) Experimental and numerical study on pounding effects and mitigation techniques for adjacent structures, Advances in Structural Engineering, (10) 121 134.
[23] M. Papadrakakis, H.P. Mouzakis,(1995) Earthquake simulator testing of pounding between adjacent buildings, Earthquake engineering & structural dynamics, (24) 811 834.
[24] K.T. Chau, X.X. Wei,(2001) Pounding of structures modelled as non linear impacts of two oscillators, Earthquake engineering & structural dynamics, (30) 633 651.
[25] R. Jankowski, A. Seleemah, S. El Khoriby, H. Elwardany, Experimental study on pounding between structures during damaging earthquakes, in, TransTech Publ,pp. 249 252.
©2022 The Author(s). Published by Infogain Publication.
work is licensed under a Creative
http://creativecommons.org/licenses/by/4.0/
[26] C.P. Pantelides, X. Ma,(1998) Linear and nonlinear pounding of structural systems, Computers & Structures, (66) 79 92.
[27] P. Komodromos,(2008) Simulation of the earthquake induced pounding of seismically isolated buildings, Computers &Structures, (86) 618 626.
[28] K. Bi, H. Hao, N. Chouw,(2010) Required separation distance between decks and at abutments of a bridge crossing a canyon site to avoid seismic pounding, Earthquake Engineering & Structural Dynamics, (39) 303 323.
[29] A. Sarebanha, G. Mosqueda, M.K. Kim, J.H. Kim, Effects of moat wall impact on the seismic response of base isolated nuclear power plants,in.
[30] A. Sarebanha, G. Mosqueda, M.K. Kim, J.H. Kim,(2018) Seismic response of base isolated nuclear power plants considering impact to moat walls, Nuclear Engineering and Design, (328) 58 72.
[31] C.M. Chan,(2001) Optimal lateral stiffness design of tall buildings of mixed steel and concrete construction, The Structural Designof Tall Buildings, (10) 155 177.
[32] H. Elwardany, A. Seleemah, R. Jankowski,(2017) Seismic pounding behavior of multi story buildings in series considering the effect of infill panels, Engineering Structures, (144) 139 150.
[33] H. Elwardany, A. Seleemah, R. Jankowski, S. El Khoriby,(2019) Influence of soil structure interaction on seismic pounding between steel frame buildings considering the effect of infill panels, Bulletin of Earthquake Engineering, (17) 6165 6202.
[34] S. El Khoriby, A. Seleemah, H. Elwardany, R. Jankowski, Experimental and numerical study on pounding of structures in series, in: Advances in Structural Engineering, Springer, 2015,pp. 1073 1089.
[35] R. Jankowski,(2005) Non linear viscoelastic modelling of earthquake induced structural pounding, Earthquake engineering &structuraldynamics, (34) 595 611.
[36] S.M. Khatami, H. Naderpour, R.C. Barros, A. Jakubczyk Gałczyńska, R. Jankowski,(2019) Determination of peak impact force for buildings exposed to structural pounding during earthquakes, Geosciences, (10) 18.
This article can be downloaded from here: www.ijaems.com
work is licensed under
©2022 The Author(s). Published by Infogain Publication.
