International Journal of Advanced Engineering Research and Science (IJAERS) https://dx.doi.org/10.22161/ijaers/3.12.40
[Vol-3, Issue-12, Dec- 2016] ISSN: 2349-6495(P) | 2456-1908(O)
Evapotranspiration Prediction Using M5T Data Mining Method Yunus Ziya Kaya1*, Mustafa Mamak1, Fatih Unes2 1
Department of Civil Engineering, Osmaniye Korkut Ata University, Turkey Department of Civil Engineering, Iskenderun Technical University, Turkey
2
Abstract— Evapotranspiration (ET) estimation takes an important role in hydraulic designs and irrigation management. Even these imperative importance ET estimation methods are not clear and easily employable enough. This study focused on M5T data mining method to estimate ET due this method is in use for nonlinear physical cases. 1543 daily Solar Radiation (SR), Air Temperature (AT), Relative Humidity (RH) and Wind Speed (U) meteorological parameters are used to create a M5T model. 1153 daily data is used for training the model and 385 left data is used for testing model results. Data set is taken from St. Johns, Florida, USA weather station.The correlation coefficient (R) is calculated as 0.983 for the M5T. Model results are compared with Turc empirical formula and it is found that M5T data mining method has better performance than Turc empirical formula. Keywords— Evapotranspiration, M5T Data Mining, Solar Radiation, Air Temperature, Relative Humidity, Wind Speed. I. INTRODUCTION Knowledge of evapotranspiration losses is an important parameter for the hydrological design and agricultural yield. Designers of many hydraulic constructions, such as dam or irrigation channels, need to know how much water will be lost due to ET after construction is built up. An II.
irrigation engineer needs to consider ET as a determinative parameter for satisfactory agricultural yield, for the reason ET has an impact on crop water need. Many different methods have been suggested to calculate ET by Brutsaert [1], and Jensen [3]. Generally, using combination of energy balance and aerodynamic equations, gives most accurate solutions since this equations are based on physics rules and rational relationships [3]. In this study, Turc empirical equation is used to determine ET as this equation is based on physics rules and rational relationships. Some empirical equationsare employed for calculation of ET in some studies [5, 6, 8]. On the other hand some neurocomputing techniques such as adaptive neuro-fuzzy inference system, fuzzy genetic approach, artificial neural networks and M5T method are proposed for modelling reference evapotranspiration, actual evaporation, monthly/daily evapotranspiration [2, 6, 7]. In this paper ability of M5T model and Turc formula for prediction of ET is investigated, results are compared using mean absolute error (MAE), mean square error (MSE) and determination coefficient (R2). According to the research, it is found that M5T model has higher accuracy than Turc empirical formula for estimation daily ET.
METHODOLOGY
2.1 Data Set Used
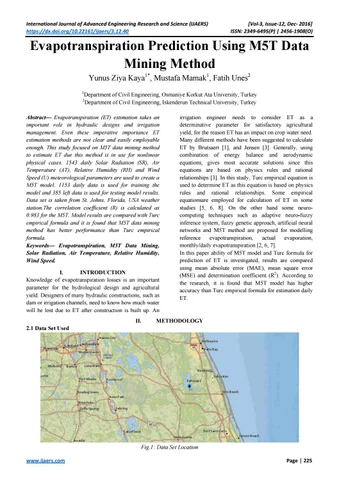
Fig.1: Data Set Location www.ijaers.com
Page | 225
International Journal of Advanced Engineering Research and Science (IJAERS) https://dx.doi.org/10.22161/ijaers/3.12.40 Daily climatic data of St. Johns station which is located Florida, USA with latitude 27°42'43" and longitude 80°42'41" is used. Data set is downloaded from U.S. Geological Survey website [8]. Data set is including SR, ET, U, T, RH parameters and it consists of six years data (2000-2004). First, respectively, 75 percent of daily records is used for training M5T model and remaining 25 percent for testing the model. Turc empirical formula is applied for the same daily test set with M5T model. Weather station location is given by Fig 1. 2.2 M5T Model This model is a type of binary decision trees which first introduced by [13] that gives the opportunity to the users work with quantitative data, differently than other decision trees. M5 model is in use for clustering and regression analyze. The model has linear regression functions at terminal (leaf) nodes. Building up the tree consists two phases [10]. First phase of the building up model is splitting data into subsets and creating decision tree which has a root node on top and connections between other decision nodes. The splitting gauge depends on handling the standard deviation of the class values and casting up the expected reduction in this error as a consequent of checking each attribute at that node [4]. The formula to calculate the standard deviation reduction is given by [11] as: =
| |
− ∑|
|
(1)
In equation (1), T is a set of instances that gets at the node, Ti is the subset of instances that have the ith
[Vol-3, Issue-12, Dec- 2016] ISSN: 2349-6495(P) | 2456-1908(O)
outcome of the potential set and sd is the standard deviation [9, 14]. Due to splitting stages, child nodes always have less standard deviation than their parent nodes and it means child nodes are simpler. This splitting process built a huge tree and it may cause poor generalization. That is why tree must be pruned to have finally linear regression functions at terminal leafs. For further information about M5T method readers are referred to [13]. 2.3 Turc Equation Daily RH, average daily AT and daily SR radiation parameters are needed to calculate daily ET. Turc empirical formula depends on RH parameter value as given by (2) and (3) RH > 50% ET = 0.0133
( SR + 50 )
(2) RH < 50% ET = 0.0133
( SR + 50 ) (1 +
)
(3) For further information about Turc empirical formula readers are referred to [11]. III. APPLICATION AND RESULTS M5T model and Turc empirical formula results are given separately and a comparison is carried out between both methods using MSE, MAE and R statistics. 3.1 M5T Model Results In this part of the study, created tree for estimation daily ET is given by Fig 2. Also daily distribution graph and scatter chart for M5T test estimation are drawn as Fig 3 and Fig 4.
Fig. 2: ET estimation M5 Tree model It is possible to see that SR parameter is the root node of the tree due to SR is the main parameter of ET prediction in case. Also the tree use AT parameter and it has 4 final
www.ijaers.com
regression equations for estimation daily ET as final nodes.
Page | 226
International Journal of Advanced Engineering Research and Science (IJAERS) https://dx.doi.org/10.22161/ijaers/3.12.40
[Vol-3, Issue-12, Dec- 2016] ISSN: 2349-6495(P) | 2456-1908(O)
Fig. 3: Distribution graph of M5T model test set Fig 3 shows daily distribution of observed ET values and M5T estimations. It is seen that distribution of M5T results are almost same with observed values. As seen in Fig 4, the determination coefficient of M5T test set is calculated as R2=0.9659.
Fig. 4: Scatter chart of M5T model test set 3.2 Turc Results Test set daily SR, AT, RH parameters are applied to the Turc formula, distribution graph and scatter chart are drawn as Fig. 5 and Fig. 6.
www.ijaers.com
Page | 227
International Journal of Advanced Engineering Research and Science (IJAERS) https://dx.doi.org/10.22161/ijaers/3.12.40
[Vol-3, Issue-12, Dec- 2016] ISSN: 2349-6495(P) | 2456-1908(O)
Fig.5: Distribution graph of Turc empirical formula test set Fig 6 shows that the determination coefficient of Turc empirical formula test set is calculated as R2=0.9201.
Fig. 6: Scatter chart of Turc formula test set 3.3 Results Comparison MSE, MAE and determination coefficient is calculated as (4), (5), (6). =
∗
$ =
∗
" #
∑"#
|
−
−
!
|
(4) (5)
=
∑) &*+(%&
,∑) -%& &*+
x
x /
).((&
y)
. .,∑) &*+((&
/
y)
(6)
Where, “fi” represents predicted values and “yi” represents actual values for equations(4), and (5). “xi” shows ith actual value, “yi” shows ith predicted value, x represents xmean and y represents ymean at equation (6). Statistical comparison is given by Table 1.
www.ijaers.com
Page | 228
International Journal of Advanced Engineering Research and Science (IJAERS) https://dx.doi.org/10.22161/ijaers/3.12.40
[Vol-3, Issue-12, Dec- 2016] ISSN: 2349-6495(P) | 2456-1908(O)
Table.1: Comparison statistics of test set Method
Parameters used
R
R2
MSE
MAE
M5T
SR, AT, RH, U
0.983
0.966
0.071
0.115
Turc
SR, AT, RH
0.959
0.920
0.177
0.330
IV. CONCLUSION In this study, a M5T model is built up to predict daily ET using test set daily SR, AT, RH, U parameters. Model results are checked with daily observed ET and correlation coefficient is calculated as 0.983 which means that there is high relation between observed values and M5T results. Same evaluation is done for Turc empirical formula test set results and it is seen that correlation coefficient value for this evaluation is 0.959. Even there is high relation between Turc results and observed values too, when readers take into account error calculations it is obvious that M5T model has higher accuracy than Turc empirical formula for estimation daily ET. As a result of statistical evaluation, M5T method can be used for modelling daily ET.Authors suggest that M5T method should be applied for different areas having various climatic conditions to understand the effectivity of the method.
[1]
[2]
[3]
[4]
[5]
[6]
[7]
REFERENCES Brutsaert, W. H. Evaporation into the Atmosphere, Dordrecht, The Netherlands: D. Reidel Publishing Company, 1982. E. Dogan, “Reference evapotranspiration estimation using adaptive neuro-fuzzy inference system,” İrrigation and Drainage., vol. 58, pp. 617-628, March, 2008. Jensen, M.E., Burman, R.D. & Allen, R. G. Evapotranspiration and Irrigation Water Requirements, New York, USA: ASCE Manuals and Reports on Engineering Practices no. 70., ASCE, 1990. Kisi O. 2015. Pan evaporation modeling using least square support vector machine, multivariate adaptive regression splines and M5 model tree. Journal of Hydrology 528: 312-320. O. Kisi, M. Cımen, “Evapotranspiration modelling using support vector machines,” Hydrological Sciences., vol. 54(5), pp. 918-928, October 2009. O. Kisi, “Fuzzy genetic approach for modelling reference evapotranspiration,” Journal of Irrigation and Drainage Engineering., vol. 136, pp. 175-183, March, 2010. O. Kisi, “Daily pan evaporation modelling using multi-layer perceptrons and radial basis neural networks,” Hydrological Process., vol. 23, pp. 213223, 2009.
www.ijaers.com
[8] Pal M, Deswal S. 2009. M5 model tree based modelling of reference evapotranspiration. Hydrological Processes 23: 1437-1443. [9] Rahimikhoob, A., Asadi, M., Mashal, M., 2013. A comparison between conventional and M5 model tree methods for converting pan evaporation to reference evapotranspiration for semi-arid region. Water Resour. Manage 27 (14), 4815–4826. [10] Solomatine, D.P., Xue, Y.P., 2004. M5 model trees and neural networks: Application to flood forecasting in the upper reach of the Huai River in China. J. Hydrol. Process. 16(16), 3189-3202. [11] Turc L. 1961. Evaluation des besoins en eau d’irrigation, ´evapotranspiration potentielle, formulation simplifi´e et mise `a jour. Annales Agronomiques 12: 13–49. [12] (2015) U.S. Geological Survey website. [Online]. Available: http://www.usgs.gov/ [13] Quinlan JR. 1992. Learning with continuous classes. Proceedings of Australian Joint Conference on Artificial Intelligence. World Scientific Press: Singapore; 343-348. [14] Wang, Y., Witten, I.H., 1997. Induction of model trees for predicting continuous lasses. In: Proceedings of the Poster Papers of the European Conference on Machine Learning. University of Economics, Faculty of Informatics and Statistics, Prague.
Page | 229