16 minute read
Predicting Death
from Insight about Detection, Prediction and Weather Impact of Coronavirus (Covid-19) using Neural Networ
by ijaiajournal
International Journal of Artificial Intelligence and Applications (IJAIA), Vol.11, No.4, July 2020
jupyter notebook was used as the environment. Keras pre trained models were used. All the references of pre trained models are stated on Keras documentation [25]. All the computation was done using a laptop that is Asus ZenBook 15 (16GB Ram/ 1Tb PCIe SSD, 8GB graphics) equipped with a GTX 1050(Max-Q) 2Gb external graphics. Windows 10 home OS was used during the research.
Advertisement
3.4 Methods
3.4.1 Weather impact analysis
We used DecisionTreeRegressor to analyze the weather factor impacts on Covid-19 escalation. Decision tree builds regression models in the form of a tree structure. It breaks down a dataset into smaller and smaller subsets while at the same time an associated decision tree is incrementally developed. The final result is a tree with decision nodes and leaf nodes. [26] Before processing the data, we observed that necessary data was in two separate datasets. From the Covid-19 Complete Dataset [15] we took country, state, death, recovered, confirmed cases. Then we added active cases column in that where,
Active cases = confirmed – (death + recovered)
Then from the Covid-19 Global Weather Dataset [16], we took country, state, date, temp, windspeed, sun hour, humidity columns. Then these two datasets were merged on basis of country, state and date. We dropped all the data that wasn’t important for this research. We took temperature, humidity, sun hour and wind speed as our feature data and death and confirmed cases as our labeled data. 80% data was used for training and the other 20% data was used as test data. The impact of weather factors both on death due to covid-19 and the escalation of covid-19 is discussed in the result and analysis section (Section 5).
3.4.2 Detection using X-Ray
For detection, we used convolutional neural network. As the input layer we used keras pretrained machine learning models like VGG16, VGG19, InceptionV3, Xception and Resnet50. [25] And in all the cases the inner layers of our model started with a flatten layer followed by some full connected dense layers. The dense layers successively contain 512, 256, 128, 64 numbers of neurons. These four layers uses rectified linear unit as the activation function. The outermost layer contains three neurons as we have 3 classes to classify. The outer layer uses SoftMax activation function. The structure is shown in figure 3 below. Two hundred images were used as training image and the model was tested on 20 images. The train and validation results are discussed in section 4.
Figure 3: Structure of X-Ray classification CNN.
71
International Journal of Artificial Intelligence and Applications (IJAIA), Vol.11, No.4, July 2020
Section 4 also compares and analyzes the outputs when we vary the pre-trained models in the input layer. All the images were trained for 20 epochs and batch size of 10. Images were augmented during training. All of them was trained with loss function named “categoricalcrossentropy” and the optimizer was “Adam” with a 0.0005 learning rate for all of them.
3.4.3 Death Prediction
For death prediction we used Logistic Regression machine learning model. A Logistic Regression model can handle prediction over multiclass level. [27] In the multiclass case, the training algorithm uses the one-vs-rest (OvR) scheme. The data used for prediction contained object type data, which was uncompilable for the model. We used Scikit-Learn Lebel Encoder to decode the features so that we can compile the model. Gender, age, location and country was our feature and death were the label. Given a person’s gender, age, location and country, this model can determine the persons chance of surviving during this pandemic with a model accuracy score of 94.40%. With more data, this model is expected to perform better in real life scenario.
4. RESULT & ANALYSIS
4.1 Weather Impact:
The two datasets we used to analyze weather impact contains many insights. We tried to find the death per one thousand ranking. The ranking is shown in figure below marked as figure 4. As we can see from the horizontal bar diagram, the death rate per thousand in Belgium is the highest according to the dataset that we used. But, is there any relation between the death rate and weather? Or is there any relation with escalation of Covid-19 with weather? We tried to find out the answer to these questions.
Figure 4: Mortality rate per thousand cases.
The datasets we merged together to analyze the weather factor impact, contains information of 188 countries and this data is was grouper together by date, country and state. There is weather
72
International Journal of Artificial Intelligence and Applications (IJAIA), Vol.11, No.4, July 2020
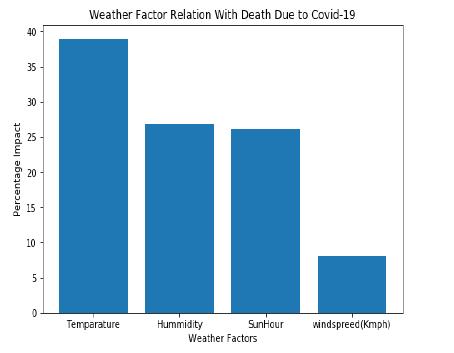
data of 131 days, using these data we analyzed the percentage impacts of weather factors on Covid-19. We trained two DecisionTreeRegressor models to find out the associated percentage impact of weather factors with death and spread of Covid-19. The first DecisionTreeRegressor determines the impact percentages of weather factors in the escalation of Covid-19 which is shown in figure 5. And the second DecisionTreeRegressor determines the percentage impact of weather factors on death due to Covid-19 which is shown in figure 6.
Figure 5: Weather factor impact on escalation

Figure 6: Weather factor relation with death
From figure 5 we can see that the impact of temperature in escalation of Covid-19 is 37.51%, impact of humidity is 26.32%, impact of sun hour is 22.05% and impact of wind speed is 14.10%. So, it can be stated that, temperature and humidity have a direct and strong relation with
73
International Journal of Artificial Intelligence and Applications (IJAIA), Vol.11, No.4, July 2020
escalation of Covid-19. A total of 63.83% of impact is very significant where it concerns exponential growth of a virus worldwide, taking so many lives.
The other Decision Tree Regressor model determines the impact of weather factors on death due to Covid-19 which is shown in figure 6. As we can see from the graph temperature has 38.99% impact, humidity has 26.80% impact, sun hour has 26.10% impact and wind speed has8.09% impact on deaths due to covid-19. From figure 5 we have already seen that temperature and humidity have 63.83% impact on Covid-19 escalation and figure 6 shows that temperature and humidity have 65.79% impact on death. 65.79% impact is very significant if it concerns death which is the case we tried to find.
Combining all the findings we got from these graphs, in both escalation and death, temperature holds the highest impact that is 37.51% in escalation and 38.99% in death. So, the relation of temperature with Covid-19 is clearly seen and understood. This can be clearly said that temperature have a definite and significant relation with deaths due to Covid-19 and spread of Covid-19.
4.2 Death Prediction
Death was predicted on basis of age, gender, country and state. Logistic Regressor first multiplies a randomized weight matrix with the features to create a linear model.
Linear Model: a = w0 + w1x1 + w1x2 + ⋯ + wnxn (equation-1)
Then cost functions adjusts these costs to get the best possible result. Finally, sigmoid like function is applied as we are predicting if a person will survive or not. This function keeps the values between 1 and 0.
Logistic Model: ��= 1 1+�� −�� (a is from equation-1)
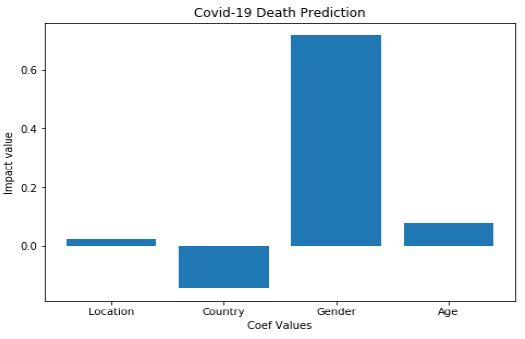
To determine the result, the co-efficient values holds a great impact. The coefficient values are shown in figure 7.

Figure 7: Coefficient values and impact.
74
International Journal of Artificial Intelligence and Applications (IJAIA), Vol.11, No.4, July 2020
From the figure 7 it is can be said that, death is mostly related to the persons gender and age. On the prediction, among the 4 features, gender has the highest effect on death. As study already shows men are more likely to die due to Covid-19. [28]
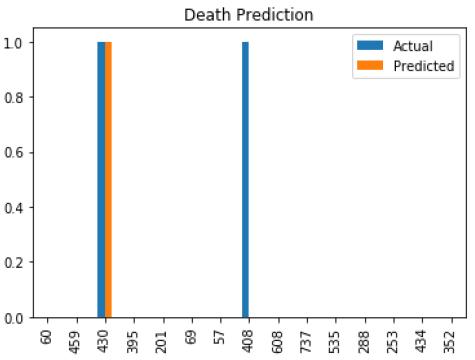
Figure 8 shows a graphical representation of prediction by the model. Tough it can be clearly seen that there is a false prediction in the graph, but, the performance of the model can easily be understood by the confusion matrix shown in figure 9.

Figure 8: Death prediction

Figure 9: Confusion Matrix
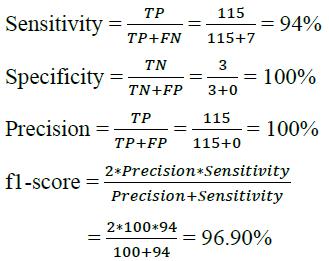
There was a total of 125 test data. The confusion metrics gives us the insight about how many correct and false prediction the model has made. From the heatmap in figure 9, we can analyze the prediction. There is 4 possible prediction that the model can make. TP (True Positive), TN (True Negative), FP (False Positive) and FN (False Negative). Among 125 data, our model has predicted 115 TP values and 3 TN which are correct predictions. The model only made 7 FN values which are wrong predictions. The effectivity of this machine learning based prediction system can be more clearly understood by sensitivity, specificity, precision, F1-score.
75
International Journal of Artificial Intelligence and Applications (IJAIA), Vol.11, No.4, July 2020

From the scores along with the accuracy of 94.04% proves that the model is predicting with a very adequate sensitivity, specificity and precision.
Although the data wasn’t sufficient enough, the model showed promising performance in prediction.
4.3 Covid-19 Detection from X-Ray
X-ray images showed rapid progression of pneumonia and some differences between the left and right lung. [29] So deep learning can learn from that differences in X-Ray images. By varying the first input layer of our system we tested the performance of various machine learning pre-trained models which are known for their image classification capability. But, all of them didn’t work well with our dataset. Figure 10 shows the training accuracy of each model after 20 epochs. And figure 11 shows the validation accuracy of models after 20 epochs.
Figure 10: Training accuracy over 20 epochs
76
International Journal of Artificial Intelligence and Applications (IJAIA), Vol.11, No.4, July 2020
Figure 11: Validation Accuracy over 20 epochs
From the accuracy graphs we can see the VGG16, VGG19 and Xception has an increasing accuracy rate. Increase in the accuracy rate proves that the model is learning. We can also see the similar characteristics in the loss functions. VGG16 and VGG19 has the lowest loss. Figure 12 shows training loss over 20 epochs and figure 13 shows validation loss over 20 epochs.
Figure 12: Training loss over 20 epochs
77
International Journal of Artificial Intelligence and Applications (IJAIA), Vol.11, No.4, July 2020
Figure 13: Validation Loss over 20 Epochs
The train, test accuracy and loss scores are given below in table 4.
Accuracy and loss after 20 epochs`
Name Accuracy Validation Accuracy Loss Validation Loss
VGG16 0.9362 0.925 0.1805 0.2417 VGG19 0.9234 0.925 0.2275 0.2148 Xception 0.8489 0.700 0.3896 0.8878 InceptionV3 0.8448 0.822 0.4288 0.8346 ResNet50 0.9404 0.317 0.1865 1.6878
Table 4: Accuracy and loss values using different pre-trained keras models.
From the table-4 we can see that VGG19 and VGG16 performing very well with unknown data means the model has learnt from the given data. But despite having a higher accuracy of about 94%, ResNet50 haven’t learnt anything from the given data and it can be seen from the validation accuracy of 31% which is very low. And the same scenario is seen in the loss function as well. VGG16 and VGG19 has the lowest loss and ResNet50 has the highest loss. The other model’s despite of having decent accuracy, will not perform well for either having a high loss or having a huge difference between training and validation accuracy.
5. FUTURE WORK & CONCLUSION
Considering the current situation due to coronavirus outbreak, we tried to analyze the situation, detect the disease and predicted the persons chances of survival. This is by no means an industry ready production but the models we built showed promising result as per detection and prediction scores. For detection, VGG16 and VGG19 performed significantly better than other models. We analyzed the weather factor and found that temperature has a direct and significant relation with death caused by covid-19 and in the escalation of it too. For prediction and analysis, we used selected regressor models as per the nature of data and type of task we wanted to conduct. Which also showed promisingly accurate result also. As the pandemic is quite new, data is not enough. With more data, the models are anticipated to work better.
These models can be integrated in hospital websites and can be used by doctors to detect the patients much faster.
78
International Journal of Artificial Intelligence and Applications (IJAIA), Vol.11, No.4, July 2020
6. DECLARATIONS
6.1 Study Limitations
More X-Ray images labeled by expert medical technicians and doctors will increase the reliability of the neural network model. More clear and high definition X-Ray images would have made difference in the accuracy of the covid-19 detection neural model. The dataset for death prediction wasn’t sufficient enough to make an absolute prediction though the model performed promisingly well.
6.2 Future Scope of Improvements
The model to detect covid-19 basically classifies the infected X-Rays and other X-Rays. This very similar model can be used for other classification or identification-based studies as well. Any X-Ray based detection can be done using the same architecture that we have used. We only need labeled data to train the models so that it can learn from the data. Deployment of deep learning models in real hospital scenario will increase the scope of research on this area.
6.3 Acknowledgements
We would like to express our very great appreciation to our supervisor Mr. A. K. M. Bahalul Haque for his consistent support throughout the planning and development of this research. Advices provided by him has been a great help to us.
7. COMPARISON BETWEEN THIS WORK AND RELATED WORKS
Paper Name Findings/Outcome Relevance with Our Work
1. Artificial Intelligence and Its
Impact on The Fourth
Industrial Revolution: A
Review
2. Machine learning for medical diagnosis: history, state of the art and perspective. 1. This paper shows how development trends in AI,
Machine Learning and Deep
Neural Network is going to change the future. 2. This paper shows the overview of machine learning based intelligent data process in medical sector.
3. Prevention of heart problems using artificial intelligence. 3. Shows how data analysis can predict heart attack. 1. We are using machine learning and deep neural network for detection and prediction.
2. Our work also processes data with machine learning to predict death and also to analyze weather impact related to covid-19 pandemic. 3. Prediction is one of the main features of our system.
4. An intelligent model for detection of post-operative infections.
5. COVID-19 Detection using Artificial
Intelligence. 4. This research uses machine learning and processes medical data to extract most significant feature for detecting postoperative infection. 5. This research classifies covid-19
X-Rays between two classes. 4. Our work uses feature importance to analyze the weather impact.
5. Our work classifies X-
Rays between three classes using pre-trained deep learning models.
79
International Journal of Artificial Intelligence and Applications (IJAIA), Vol.11, No.4, July 2020
6. Automated detection of
COVID-19 cases using deep neural networks with X-ray images. 7. The role of environmental factors on transmission rates of the COVID-19 outbreak:
An initial assessment in two spatial scales. 6. Classifies Coid-19 X-Rays with 87.02% accuracy for multi class.
7. This research shows rapid growth of coronavirus over a range of temperature. 6. Our model Classifies with 93.6% accuracy in multi class level.
7. We have shown what weather factors impacts the growth of coronavirus and also the impacts the death rate.
REFERENCES
[1] "Rolling updates on coronavirus disease (COVID-19)," World Health Organization, 1 June 2020. [Online]. Available: https://www.who.int/emergencies/diseases/novel-coronavirus-2019/events-asthey-happen. [Accessed 3 June 2020].
[2] "COVID-19 CORONAVIRUS PANDEMIC," WorldoMeter, 05 June 2020. [Online]. Available: https://www.worldometers.info/coronavirus/#countries. [Accessed 05 June 2020].
[3] "ICTV 9th Report (2011)," International Committee on Taxonomy of Viruses (ICTV), [Online].
Available: https://talk.ictvonline.org/ictv-reports/ictv_9th_report/positive-sense-rna-viruses2011/w/posrna_viruses/222/coronaviridae. [Accessed 26 May 2020].
[4] B. C. Fielding, "A brief history of the coronavirus family – including one pandemic we might have missed," THE CONVERSATION, 25 March 2020. [Online]. Available: https://theconversation.com/a-brief-history-of-the-coronavirus-family-including-one-pandemic-wemight-have-missed-134556. [Accessed 26 May 2020].
[5] C.-C. Lai, T.-P. Shih, W.-C. Ko, H.-J. Tang, and P.-R. Hsueh, “Severe acute respiratory syndrome coronavirus 2 (SARS-CoV-2) and coronavirus disease-2019 (COVID-19): The epidemic and the challenges,” International Journal of Antimicrobial Agents, vol. 55, no. 3, p. 105924, 2020.
[6] D. D. Werb, "Seven Important Things to Know About Coronaviruses," The New York Times, 20
March 2020. [Online]. Available: https://www.nytimes.com/2020/03/20/opinion/coronavirusfacts.html. [Accessed 27 May 2020].
[7] E. Weise, "Many coronavirus mutations are circling the globe, but we don't know if any are more dangerous," USA TODAY, 5 May 2020, [Online] Available: https://www.usatoday.com/story/news/health/2020/05/05/coronavirus-strains-mutating-some-moredangerous-than-others/3085752001/. [Accessed 27 May 2020].
[8] G. Velarde, “Artificial Intelligence and its Impact on the Fourth Industrial Revolution: A Review,”
International Journal of Artificial Intelligence & Applications, vol. 10, no. 6, pp. 41–48, 2019.
[9] I. Kononenko, "Machine learning for medical diagnosis: history, state of the art and perspective,"
Artificial Intelligence in Medicine, vol.23, no. 1, pp. 89-109, 2001.
[10] N. C. D. Adhikari, “Prevention of Heart Problem Using Artificial Intelligence,” International Journal of Artificial Intelligence & Applications, vol. 9, no. 2, pp. 21–35, 2018.
[11] M. E. Rashidy, Tahataha, N. Ayad, and Hodasroor, “An Intelligent Model For Detection Of Post-
Operative Infections,” International Journal of Artificial Intelligence & Applications, vol. 2, no. 4, pp. 35–48, 2011.
[12] S. S. A.-N. E. A. B. S. A.-N. B. A. M. A. Fatima M. Salman, "COVID-19 Detection using Artificial
Intelligence," International Journal of Academic Engineering Research (IJAER), vol. 4, no. 3, pp. 1825, March, 2020.
80
International Journal of Artificial Intelligence and Applications (IJAIA), Vol.11, No.4, July 2020
[13] T. Ozturk, M. Talo, E. A. Yildirim, U. B. Baloglu, O. Yildirim, and U. R. Acharya, “Automated detection of COVID-19 cases using deep neural networks with X-ray images,” Computers in Biology and Medicine, vol. 121, p. 103792, 2020.
[14] C. Poirier, W. Luo, M. Majumder, D. Liu, K. Mandl, T. Mooring, and M. Santillana, “The Role of
Environmental Factors on Transmission Rates of the COVID-19 Outbreak: An Initial Assessment in
Two Spatial Scales.,” SSRN Electronic Journal, 2020.
[15] D. kp, "COVID-19 Dataset," Kaggle, [Online]. Available: https://www.kaggle.com/imdevskp/coronavirus-report. [Accessed 27 May 2020].
[16] P. Winter, "COVID19_Global_Weather_Data," Kaggle, [Online]. Available: https://www.kaggle.com/winterpierre91/covid19-global-weather-data. [Accessed 27 May 2020].
[17] P. Mooney, "Chest X-Ray Images (Pneumonia)," Kaggle, [Online]. Available: https://www.kaggle.com/paultimothymooney/chest-xray-pneumonia. [Accessed 27 May 2020].
[18] J. P. C. a. P. M. a. L. Dao, "COVID-19 image data collection," Github, [Online]. Available: https://github.com/ieee8023/covid-chestxray-dataset. [Accessed 27 May 2020].
[19] SRK, "Novel Corona Virus 2019 Dataset," Kaggle, [Online]. Available: https://www.kaggle.com/sudalairajkumar/novel-corona-virus-2019-dataset. [Accessed 27 May 2020].
[20] “TensorFlow,” [Online] Available: https://www.tensorflow.org/ [Accessed: 30 May 2020]
[21] “ScikitLearn,” [Online] Available: https://scikit-learn.org/stable/ [Accessed: 30 May 2020]
[22] “Pandas,” [Online] Available: https://pandas.pydata.org/ [Accessed: 31 May 2020]
[23] “NumPy,” [Online] Available: https://numpy.org/ [Accessed: 31 May 2020]
[24] “Matplotlib,” [Online] Available: https://matplotlib.org/ [Accessed: 31 May 2020]
[25] “Keras,” [Online] Available: https://keras.io/applications/ [Accessed: 01 June 2020]
[26] “Decision Tree-Regression,” [Online] Available: https://www.saedsayad.com/decision_tree_reg.htm [Accessed: 02 June 2020]
[27] “Sklearn.linear_model.Logisticregression,”, ScikitLearn, [Online] Available: https://scikitlearn.org/stable/modules/generated/sklearn.linear_model.LogisticRegression.html [Accessed: 2 June 2020]
[28] “High Enzyme Levels Make Men More Vulnerable to COVID-19: REPORT”, ALJAZEERA, 11
May 2020, [Online] Available: https://www.aljazeera.com/news/2020/05/high-enzyme-levels-menvulnerable-covid-19-report-200511081359742.html [ACCESSED 29 May, 2020]
[29] Z. Xu, L. Shi, Y. Wang, J. Zhang, L. Huang, C. Zhang, S. Liu, P. Zhao, H. Liu, L. Zhu, Y. Tai, C.
Bai, T. Gao, J. Song, P. Xia, J. Dong, J. Zhao, and F.-S. Wang, “Pathological findings of COVID-19 associated with acute respiratory distress syndrome,” The Lancet Respiratory Medicine, vol. 8, no. 4, pp. 420–422, 2020.
81

