2 minute read
International Journal of Network Security & Its Applications (IJNSA) Vol.15, No.1, January 2023
and we want to figure out the most active device that is generating too much traffic, then in that instance, the Conversations window will be quite useful. The conversation window gives the option to choose between layer 2 Ethernet statistics, layer 3 IP statistics, or layer 4 TCP or UDP statistics. Figure 6 shows the conversation window.
As shown in the figure above conversation window show addresses, packet counters, byte, the start time of the conversation (“Rel Start”) or (“Abs Start”), the duration of the conversation in seconds, and the average bits (not bytes) per second in each direction.
Advertisement
3.4.Advanced Statistical Tools
The advanced statistical tools discussed are –various graphs and Expert Info
3.4.1.Graphs
Wireshark offers graphing capabilities which can present captured packets in an interesting format that makes the analysis process much more effective and easy to adapt [14] [15]. There are multiple types of graphs available.
3.4.1.1. I/O Graph
I/O graphs tell us the basic status of a network, and let us create filters. Matching network performancesanddifferentiatinga specificprotocol becomes easy [14] [15]. Thefigurebelowshows the graph.
In the figure above we applied the filter UDP and TCP to observe the traffic related to these protocols. Wecanseehighs andlows inthenetworktraffic, whichcanbeusedtorectifyproblems or can even be used for monitoring purposes. In the preceding graph, the data on the x-axis represents the time in seconds and the data on the y-axis represents the number of packets per tick [15]. The scalefor thex andy-axis canbealteredif needed, wherethex-axis will have a range between 10 and 0.001 seconds, and the y-axis values will range between packets/bytes/bits.

The graph above displays the packet captured for TCP & UDP protocols. From the graph, we can analyzethatthemaximumnumber of 700 UDP packets arecapturedbetweenthetimeinterval 1900s to2000s. Thehighest number ofTCP packets capturedis 9000 at a timeinterval between0s to100s.
3.4.1.2. Flow Graph
This feature in Wireshark provides troubleshooting capabilities in scenarios like facing a lot of droppedconnections, lost frames, retransmissiontraffic, andmore. Flowgraphs enableus tocreatea column-based graph, which summarizes the flow of traffic between two endpoints [15]

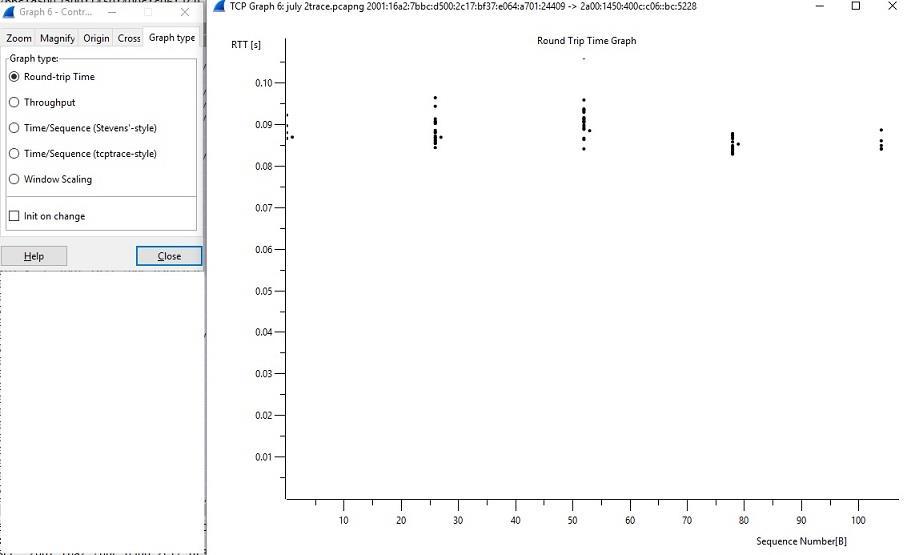
3.4.1.3. Round trip time (RTT) Graph
This graph is used by network admins to identify any congestion or latency that can make your network perform slowly [15]
In the above graph, at some points latency can be observed.
3.4.1.4. Throughput Graph

Throughput graph is similar to the I/O graph and is used for depicting the traffic flow

3.4.1.5. Time-sequence graph (tcptrace)

This graph shows the TCP stream over time. The traffic depicted in this graph is unidirectional. Time-sequence graph gives us an idea about the segments that are currently traveling, the acknowledgments for segments that we've received, and the buffer area that the client is capable to hold.
3.4.2. Expert Info
The information in the Expert Info’s dialog is populated by the dissectors that enable the translation of every protocol that is well known to Wireshark. The purpose of the Expert Info dialog is to keep the user aware of the specific states that users should know about [15]. Figure 12 shows the expert info.


