3 minute read
International Journal for Research in Applied Science & Engineering Technology (IJRASET)
ISSN: 2321-9653; IC Value: 45.98; SJ Impact Factor: 7.538
Volume 11 Issue IV Apr 2023- Available at www.ijraset.com
Advertisement
III.METHODOLOGY
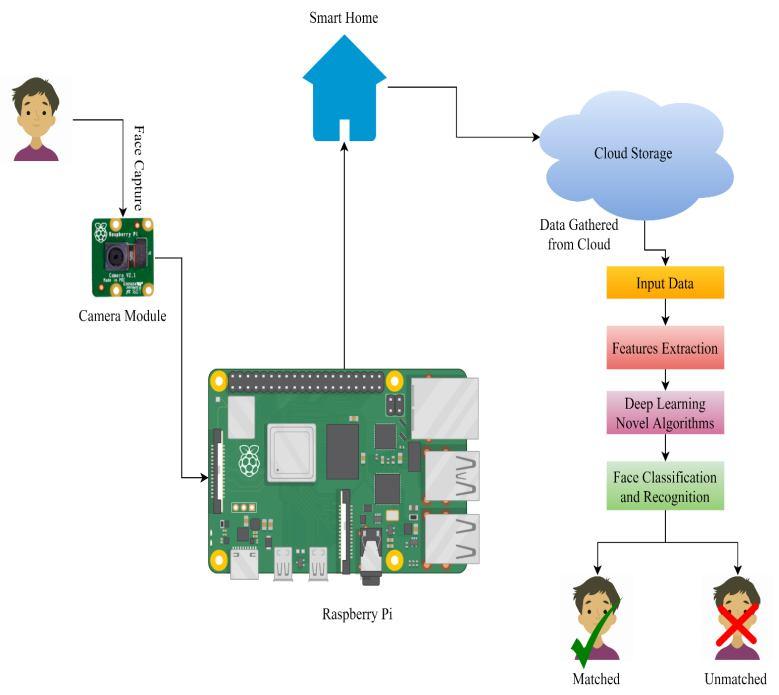
This study aims to create a system for intelligent homes that uses face identification and is based on the Internet of Things (IoT), utilizing a Raspberry Pi-based vision framework to accumulate information. Figure 3 illustrates the flowchart of the current study, which involves several steps. Firstly, an image is captured from the Raspberry Pi-based vision system, and then transmitted to the cloud storage for matching. Next, a profound learning-based novel engineering is utilized to extricate highlights from the confront and compare it with the database of known people authorized to reach the savvy homes. If the face detected by the algorithm matches the faces in the database of known individuals, the smart gate will unlock and allow access to the authorized person. However, If the recognized face does not match any authorized individuals in the system, the smart gate will remain locked, and access will not be granted.

A. Overview of the Dataset
The dataset utilized in this study was collected from a camera module based on Raspberry Pi. The dataset is confined to a slight gathering of people specifically related to the family individuals of a savvy home. The data set contains the subsequent attributes: TABLE
2
Of Dataset
ISSN: 2321-9653; IC Value: 45.98; SJ Impact Factor: 7.538

Volume 11 Issue IV Apr 2023- Available at www.ijraset.com
B. Architectural model
The research aims to create an architecture for face recognition that combines Convolutional Neural Network (CNN) with the SVMBoosted algorithm to improve classification performance. The local database's input image will undergo feature extraction in the convolutional layer, followed by the max pooling layer. This process involves using the extracted features from the Convolutional Layer to analyze the texture of each face and compare it with the reference or expected data (i.e., ground truth) for identification. The extracted values will be stored in a CSV file to enhance the system's robustness. After extricating the csv record, which contains the highlights in Table 2, the SVM-Boosted calculation will classify the right confront. Figure 4 outlines the building chart of the proposed CNN-SVM Boosted Confront Acknowledgment calculation. The proposed engineering has been approved numerically with the taking-after conditions.

In computer vision, kernel convolution is widely used in convolutional neural networks (CNNs) and other algorithms. Convolutional neural networks apply a small matrix, known as a kernel or filter, to an image and then evaluate the resulting transformation. The feature maps' values can be computed by feeding an input image (f) and a kernel (h) into the network, with M and N denoting the row and column indices of the resulting matrix. In this study, In order to enhance the accuracy, we have devised a classification model which integrates the Support Vector Classifier (SVM) and the XGBoosting Classifier (XGBC). The mathematical expression of the SVM-XGBC model is presented below:
We are going to classify FDI assaults within the dataset by calculating the support vectors as takes after:
In this equation, P is the probability function of SVM, while yi is the outcome of the XGBC classification model. The term represents the total residuals in trees, and α is the learning rate of XGBC. After the output y is obtained from XGBC, it is passed into the probability function of SVM for classification.
ISSN: 2321-9653; IC Value: 45.98; SJ Impact Factor: 7.538

Volume 11 Issue IV Apr 2023- Available at www.ijraset.com
1) Texture Classification: Texture classification is a challenging task in pattern recognition, where the goal is to differentiate between different textures. One of the primary challenges is identifying valuable features that can be extracted from the textured image, as many complex classifiers are available. Textures can be perceived either visually or tactually, whereas optical texture refers to the form and content of the image, while tactile texture can be felt by touching the surface.
2) Feature Engineering: Machine learning models can utilize various functions to analyze data within a specific domain. Before using machine learning algorithms, raw data must be converted into a format that the model can process and use, which usually requires manual work. The researchers in this study used a correlation matrix to evaluate the relationship between different variables. A correlation matrix is a matrix that measures the degree of the linear relationship between variables, similar to a covariance matrix. This study employs a correlation matrix to evaluate the relationship between different variables. A correlation matrix is a covariance matrix that summarizes the strength of the linear association between variables. The correlation coefficient, represented by 'r,' is a summary measure that indicates the strength and direction of a linear relationship between two quantitative variables. It ranges from -1 to +1, with -1 representing a perfect negative correlation, 0 representing no correlation, and +1 representing a perfect positive correlation.
3) Performance Evaluation: The system's performance was assessed in this research using F1 Score and accuracy measures. Additionally, the confusion matrix was used to determine the number of correctly and incorrectly classified instances. Table 3 provides a summary of the evaluation metrics used in this study TABLE
3 Description Of Matrics
Confusion Matrix
True-Positive (TP): if the output is 1 so it is present in the data file
True-Negative (TN): ): if the output is 0 so it is not present in the data file


