


Marketing Support for your InBody 85 100 145 160 175 190 205 90 100 1 120 140 150 160 170 100 160 220 280 400 460 520 0.420 0.430 0.440 0.450 0 0 5 4 0 0 0 4 130 145 160 175 190 205 130 145 175 190 205 120 130 150 160 170 130 140 150 160 170 140 150 160 170 44.3 18.7 120.1 164.4 183.1 94.4 183.1 18.7 23.7 16.29.59 16.09.57 182.1 182.5 183.1 91.3 94.4 0.371 10.2 12.5 0.372 01.08.20 01.24.20 08:08 0.0 0.0 0.4 0.4 9.5 2.9 2.9 1982 30.3%28.8% 64.9%65.7%88.6% 3 228.1288.2309.0229.6268.6308.9 23.4 18.3 14.1 198.4230.2266.1201.6235.3272.3 SEEWHATYOU’RE MADEOF
For more information or to order contact InBodyCanada Marketing Support: marketing@inbodycanada.ca Marketing Support InBody 270 ...................................................................................................................... InBody 380 ................................................................................................................... InBody 570 ................................................................................................................... InBody 580 ................................................................................................................... InBody 770 ................................................................................................................... InBody 970 ................................................................................................................... InBody BWA 2.0 ......................................................................................................... InBody BPBIO 750 ...................................................................................................


marketing@inbodycanada.ca 3 Support for your InBody ......................................................................................................................5 ...................................................................................................................19 ................................................................................................................... 27 ...................................................................................................................41 ...................................................................................................................49 ...................................................................................................................61 .........................................................................................................75 ...................................................................................................87


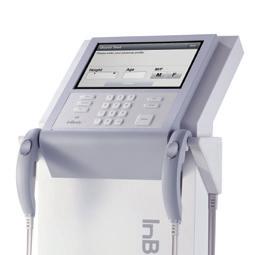
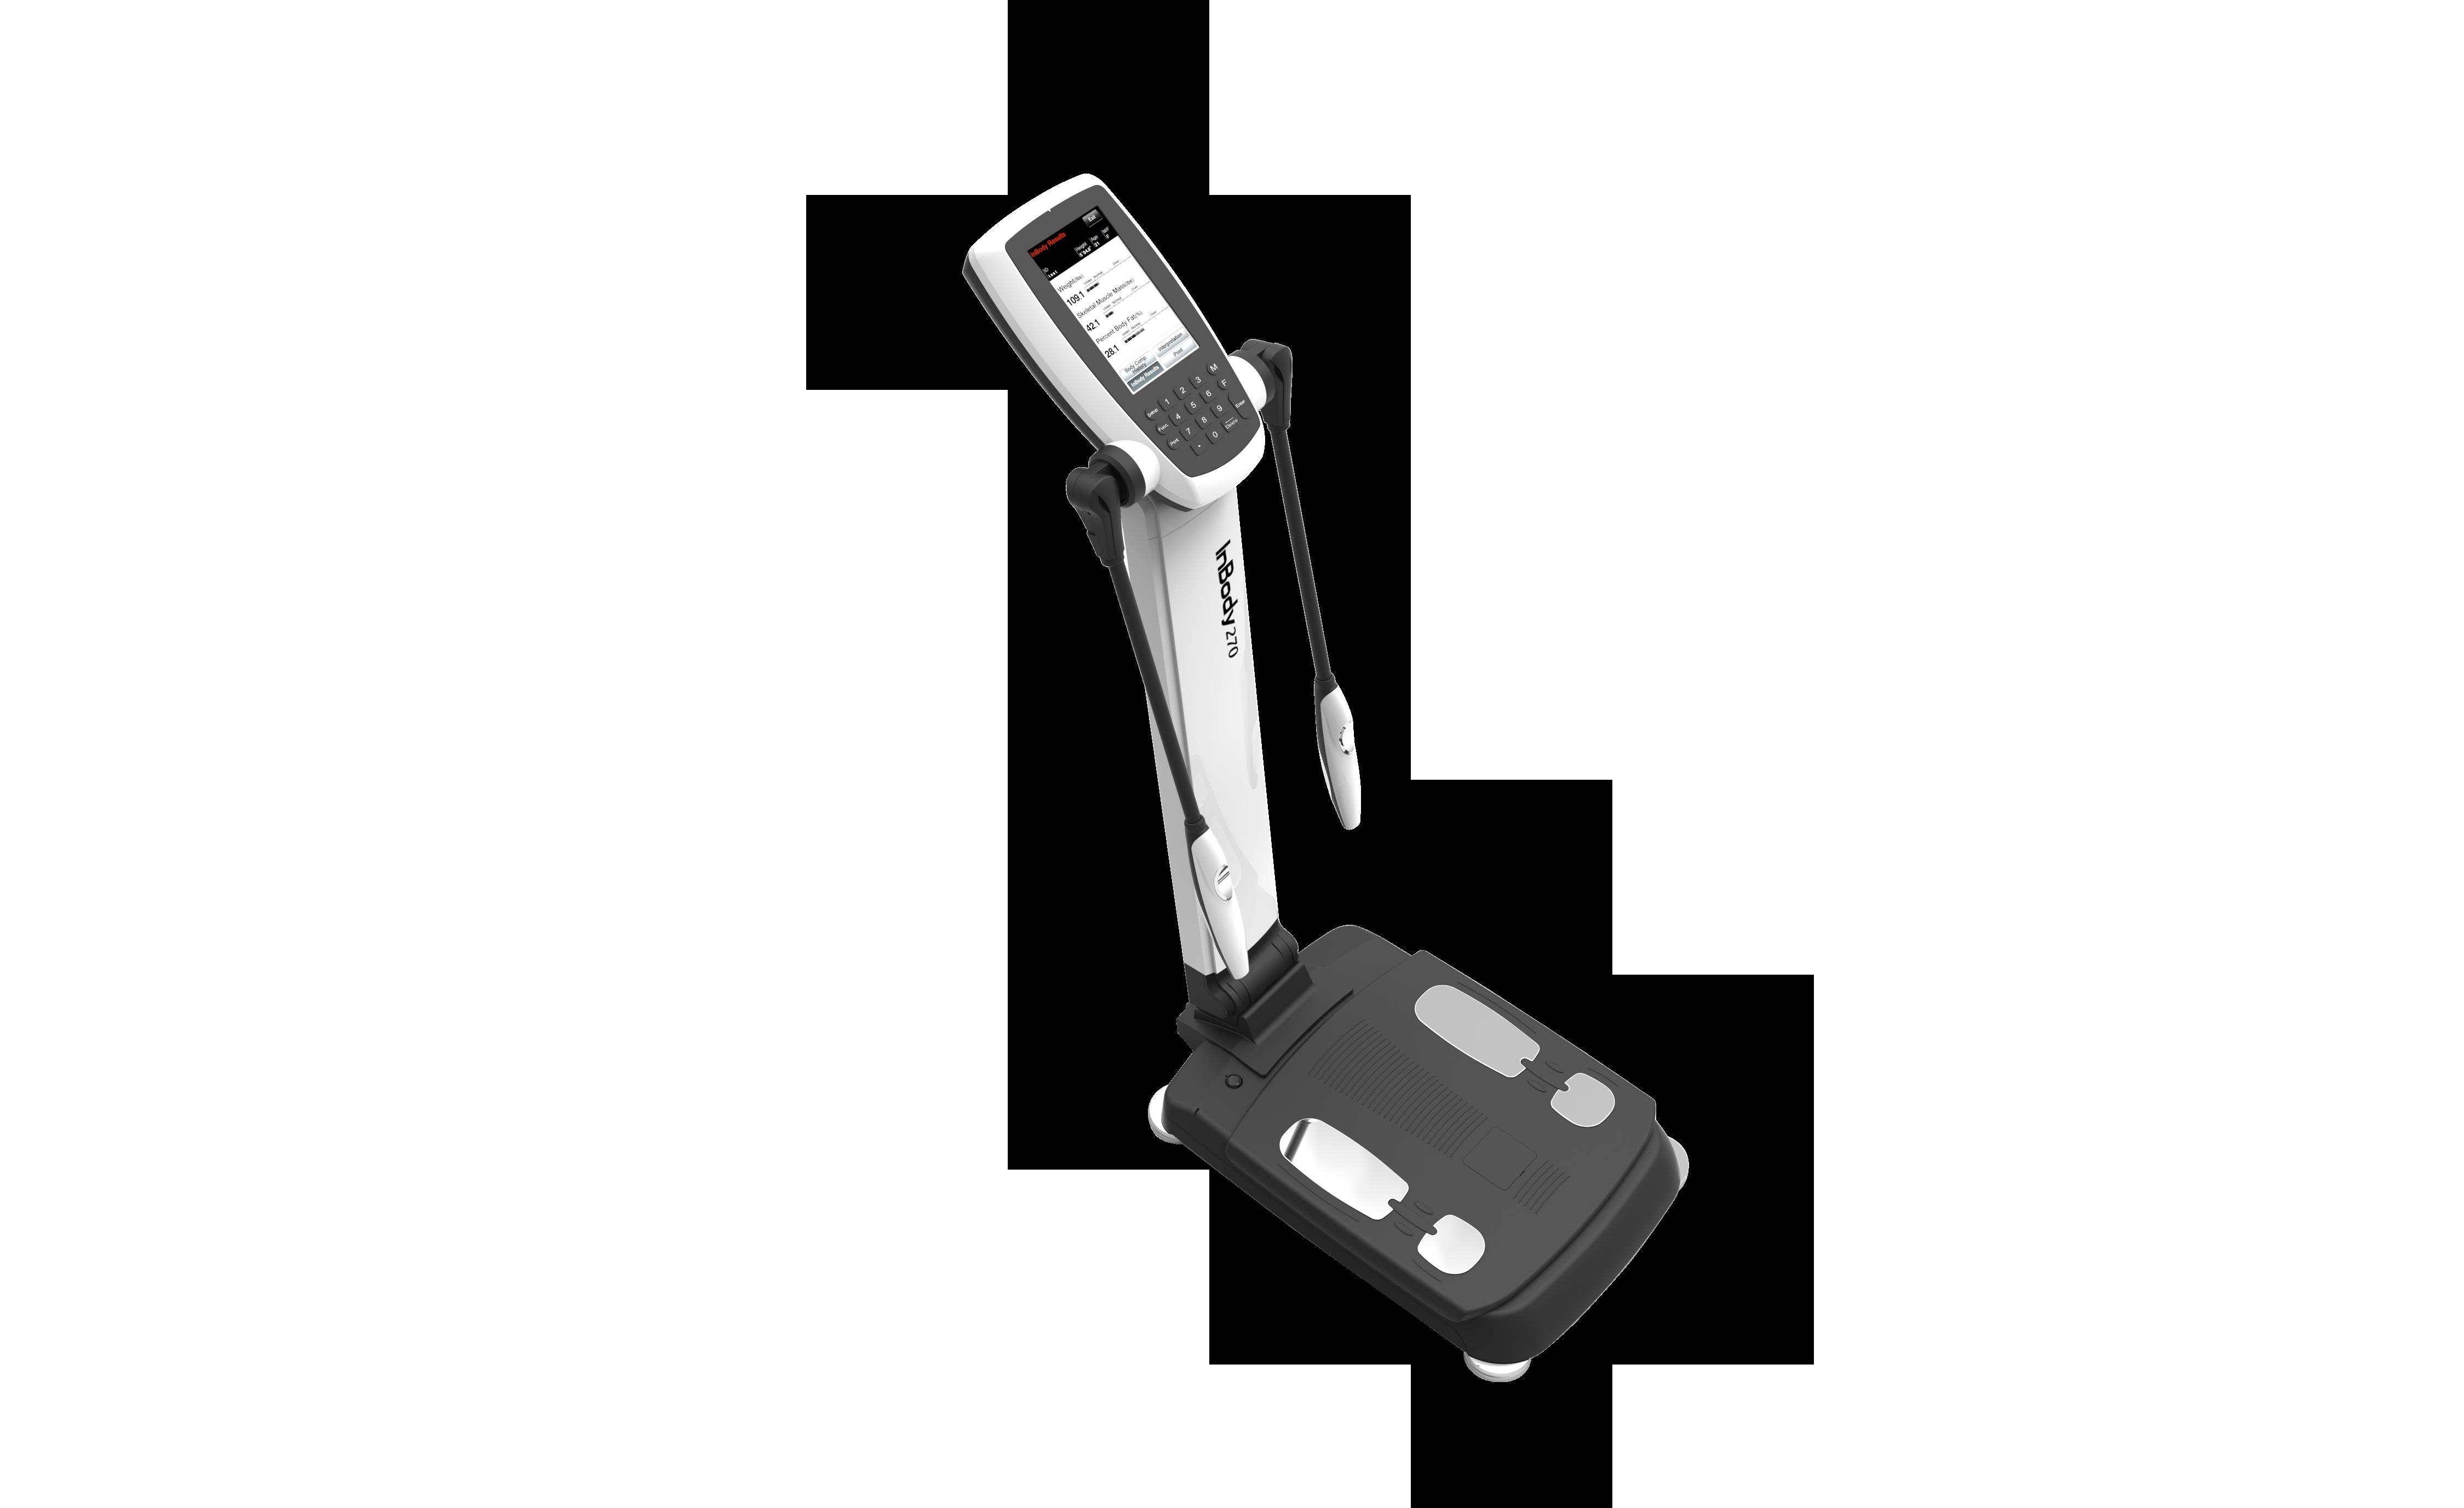
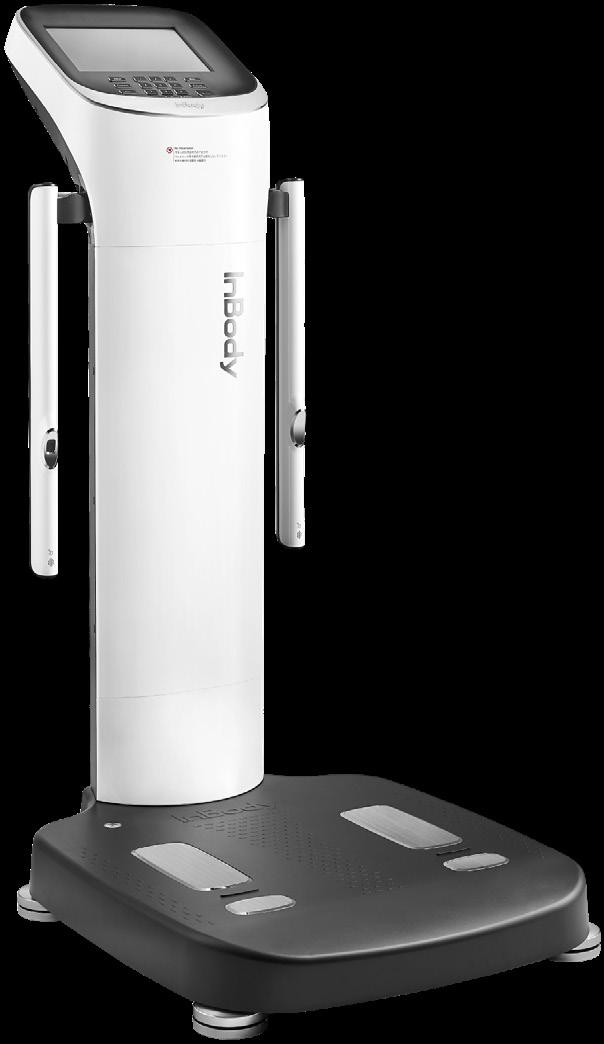
For more information or to order contact InBodyCanada Marketing Support: marketing@inbodycanada.ca InBody 270 Body Composition Analyzer
InBody 270 | Social Media Template


Free digital file template upon request.
Product images are available on request

marketing@inbodycanada.ca 5
Pricing: $65 per pack of 100 (+HST)
Pre-printed, order online at shop.inbodycanada.ca


For more information or to order contact InBodyCanada Marketing Support: marketing@inbodycanada.ca
BACK InBody 270 | Result Sheet
Sheet Quick Guide Brochure


marketing@inbodycanada.ca 7
FRONT
8.5”x11” tri-fold, 100lb coated gloss stock
Pricing:
100 - $99
250 - $129
500 - $169
1000 - $199 (+shipping/HST)
Your company logo and contact info can be added upon request.

For more information or to order contact InBodyCanada Marketing Support: marketing@inbodycanada.ca
InBody 270 | Tri-Fold
FRONT
Tri-Fold Brochure


marketing@inbodycanada.ca 9 BACK
• 33”x 80”
• Hardware included
• Single and double sided available
• Your Logo Included
$119
$217 (+shipping/HST)
Same Height Different composition


For more information or to order contact InBodyCanada Marketing Support: marketing@inbodycanada.ca LEARN ABOUT BODY COMPOSITION TODAY! 31% Body Fat 0.383 ECW/TBW 73.2 lbs SMM 0.371 ECW/TBW 12% Body Fat 98.6 lbs SMM LEARN ABOUT BODY COMPOSITION TODAY! InBody 270 | Pull
GRAY WHITE
Pricing: Single sided:
Double Sided:
Pull Up Banners


marketing@inbodycanada.ca 11 COMPOSITION kg (% D Heigh Age Body Compos t on History Obe ity Analys s Muscle-Fa Analysis S gm nta Lea Analy Body Fat Mas W igh PBF W ight SMM Body C mpos t Analysi To al amoun wa er in bod F building cle and reng hening bone F storing energy Sum he above Tota B Dry Lea Body F W igh 6ft.01.0in. John Doe 30 lb lb (% lb 188.3 189.2 189.5 99.9 7.8 98.9 99.5 8.1 8.0 T Rece Left Arm 11.18 lbs 135.4 % Left L g 26.06 lbs 113.6 % 14.8 7.6 SMM BM PBF cent Body Trunk 79.1 lbs 120.3 % TAKE THE INBODY TEST SEE WHAT Y MA kg (% D Heigh Ag T Da Time Body Compos ion Histo y Obesity Analys s Gende Muscle-Fat Analys s Segmenta Lean Analys s -Body Fat Mas Weigh BM PBF PBF B dy Weigh SMM SMM Skeletal Muscle M Body Compos ion Analys s al in bod or building mu cles and streng hening bone or storing excess energy S he abov T ta Body Wate Dry L Mas Body Fat Mass Weight Female mpedance Basa Metabolic Rate Results Interpretatio Results Interpretation QR Code Body C po ion A ys Sc he QR Code resul in erpre ion in de ail he body weigh is he sum o Body F Mass and Lean Bod Mass, whic composed Dry Lean Mass and T al Body Wa e M Fat A ys Compare leng Sk y longer ompared y he stronger he bod s Ob ty A ys using heigh weigh per age body ompared o bod weigh S g ta L A ys Evalua whe her he cle adequa y hroughou y Compare Body C mpos ion H sto y Track he history o he body compo ional hange T he Bod st periodi ally moni ody at- ea ody Mass Contro B sed on urren body ompo ion he recommended change in Lean Body Mass and Body Fa Mass or a good balan ed ra io he means o gain and he - mean lose Basa Metabolic Rat Basal Me aboli Ra e s he minimum number o alories needed sus ain a a resting s a BMR is direc ly correla ed wi Lean Bod Mas Body Fat-Lean Body Mass Contro y Lean Body Mass means gain a lean (-) means o lose t/lean 22.0 8.43 5. 3 2. 20 100 58.5 35.5 23 21 286.6 273.2 296.0 282.6 5ft.01.8in. Jane Doe 51 01.28.2020 07:13 lb (% bs bs bs lb lb 143.9 130.3 133.4 139.9 137.6 136.2 137.3 134.3 44.3 42.6 43.6 44.1 43.4 43.4 43.6 43.4 41.3 37.5 37.8 40.7 39.2 39.0 39.4 38.6 [InBody270] 60.0 21.6 48.7 130.3 Tota Recen 1168 kcal Lean Body Mass 81 6 lbs Left Ar 3.99 lbs 90.2 % Righ Ar 4.17 lbs 94.1 % Left Leg 10.16 lbs 72.8 % Righ Leg 10.36 lbs 74.3 % S 11.12.19 07:13 11.25.19 07:15 12.02.19 07:05 12.16.19 07:01 12.25.19 06:58 01.02.20 06:45 01.15 20 07:11 01.28 20 07:13 85 15 100 70 130 145 175 160 190 205 90 10 100 70 80 140 160 150 120 130 170 18.5 25.0 21.0 10.0 15.0 40.0 50.0 45.0 30.0 35.0 55.0 24.0 130.3 42.6 48.7 37.5 T unk 36.9 lbs 92.2 % WHAT ARE YOU MADE OF? TAKE THE INBODY TEST
GENERIC FITNESS See What You’re Made of
• 33”x 80”
• Hardware included
• Single and double sided available
• Your Logo Included
Pricing:
Single sided: $119
Double Sided: $217
(+shipping/HST)
What is Body Composition


Body Composition is ...
A method of describing what your body is made of, including fat, protein, minerals, and body water.
Body composition gives you the ability to track changes to your percent body fat, muscle mass, metabolism, and more.
WHY BODY COMPOSITION?

By understanding your body composition, you can understand where your body is right now and what you need to focus on to improve your health.

IT’S MORE THAN A BODY FAT TEST Discover New Health Insights Take an InBody Test Today!
InBody 270 | Pull
Pull Up Banners
How to
Test

Remove
Shoes & Socks
Wipe down your hands and feet with an InBody Tissue.

Step on the InBody
Align your feet with the foot electrodes. Wait for weight to be measured.


Enter Your Information
Accurate height is required for accurate results.
Optional: Input an ID to track your progress.

Follow Instructions

Hold both hand electrodes to begin testing.

Maintain Proper Posture
Keep arms straight and away from the torso. Stand straight and wait until test is completed.


marketing@inbodycanada.ca 13
Sizes:
• 12”x18”
• 18”x27”
• 24”x36”
Printed on 20pt PVC Your Logo Included
Pricing:
12”x18”: $19
18”x27”: $29
24”x36”: $39
(+shipping/HST)
InBody 270 Product Poster

270
For more information or to order contact InBodyCanada Marketing Support: marketing@inbodycanada.ca
InBody
How to Test


marketing@inbodycanada.ca 15
270 |
Posters
Sizes:
• 12”x18”
• 18”x27”
• 24”x36”
Printed on 20pt PVC
Your Logo Included
Pricing:
12”x18”: $19
18”x27”: $29
24”x36”: $39
(+shipping/HST)
Safety Poster

For more information or to order contact InBodyCanada Marketing Support: marketing@inbodycanada.ca InBody
270
Results Interpretation
Results Interpretation | 15-Second Body Composition Analysis

marketing@inbodycanada.ca 17 270 | Posters
Copyright 2020 Biospace, Inc. 270_v1.6 The individual’s ID can be inputted with the keypad. The ID can be up to 14 alpha-numeric characters. PERSONAL INFORMATION 1 Body Fat-Lean Body Mass Control displays the recommended changes in body fat and lean mass to obtain the healthy average Percent Body Fat for your gender (15% for males, 23% for females). The “+” means to gain and the “-” means to lose. BODY FAT-LEAN BODY MASS CONTROL 7 Lean Body Mass refers to the sum weight of the nonfat components of the body (bones, muscles, organs, etc.). Lean Body Mass can be used by physicians to determine nutritional status, assign medication doses, and plays a significant role in other various assessments. LEAN BODY MASS 8 Basal Metabolic Rate (BMR) is the minimum number of calories needed for life-sustaining bodily function at a resting state. BASAL METABOLIC RATE 9 Impedance is the resistance value measured when electrical currents are applied throughout the body. Based on the measured data, key body composition outputs can be analyzed. Impedance values can also be assessed for many research applications. IMPEDANCE 10 270 Default outputs: Personal Information, Body Composition Analysis, Muscle-Fat Analysis, Obesity Analysis, Segmental Lean Analysis, Body Composition History, Body Fat-Lean Body Mass Control, Lean Body Mass, Basal Metabolic Rate, Impedance BODY COMPOSITION ANALYSIS This section breaks down the individual’s body composition into distinct components. Weight is the sum of Body Fat Mass and Lean Body Mass (Seen in section 8). Lean Body Mass is the sum of Dry Lean Mass and Total Body Water. Total Body Water is the sum of Intracellular Water and Extracellular Water. 2 MUSCLE-FAT ANALYSIS Compare Skeletal Muscle Mass (SMM) to Body Fat Mass. The healthy ranges for both are indicated by the “-” at the top of the chart. Generally, the longer the Skeletal Muscle Mass bar is when compared to the Body Fat Mass bar, the healthier the individual’s balance between muscle and fat, an indicator of decreased health risk. Skeletal Muscle Mass is the amount of skeletal muscle, which is attached to the bones and produces movement. Body Fat Mass is the sum of all the fat in the body including the subcutaneous fat, visceral fat, and fat surrounding/ within muscles. Subcutaneous fat is found beneath the skin, while visceral fat is found surrounding internal organs in the abdomen.
OBESITY ANALYSIS BMI is a calculation of weight (kg) divided by height (m²) and commonly used as a general health marker. The healthy range for BMI recommended by the World Health Organization is 18.5 - 25.0 kg/m². Percent Body Fat (PBF) is the percentage of body fat compared to body weight. A healthy range for PBF is 10-20% for males and 18-28% for females. 4 SEGMENTAL LEAN ANALYSIS The top bar shows the amount of Lean Body Mass in each segment for that individual comparised to the healthy average for others with the same height and gender, while the bottom bar represents the sufficiency of the segment’s Lean Body Mass for supporting the individual’s current weight. 5 BODY COMPOSITION HISTORY Track the history of body composition changes. Take the InBody Test periodically to monitor your progress. Continuously measuring under the same ID allows the InBody to save each test for future comparison. The Body Composition History allows an individual to track the changes in body composition over the last eight test results (if selecting ‘Recent’) or a cumulative graph that shows total progress from the first to most recent test (if selecting ‘Total’). 6 For more information: www.inbody.com (kg/m (%) ID Height Age Test Date / Time Body Composition History Obesity Analysis Gender Muscle-Fat Analysis Segmental Lean Analysis InBody Body Fat Mass Weight BMI Body Mass Index PBF Percent Body Fat PBF Percent Body Fat Weight SMM Skeletal Muscle Mass SMM Skeletal Muscle Mass Body Composition Analysis Total amount of water in body For building muscles and strengthening bones For storing excess energy Sum of the above Total Body Water Dry Lean Mass Body Fat Mass Weight Female RA LA TR RL LL Impedance Basal Metabolic Rate Results Interpretation Results Interpretation QR Code Body Composition Analysis Scan the QR Code to see results interpretation in more detail. The body weight is the sum of Body Fat Mass and Lean Body Mass, which is composed of Dry Lean Mass and Total Body Water. Muscle-Fat Analysis Compare the bar lengths of Skeletal Muscle Mass and Body Fat Mass. The longer the Skeletal Muscle Mass bar is compared to the Body Fat Mass bar, the stronger the body is. Obesity Analysis BMI is an index used to determine obesity by using height and weight. PBF is the percentage of body fat compared to body weight. Segmental Lean Analysis Evaluates whether the amount of muscle is adequately distributed throughout the body. Compares muscle mass to the ideal. Body Composition History Track the history of the body compositional change. Take the InBody Test periodically to monitor your progress. Body Fat-Lean Body Mass Control Based on current body composition, the recommended change in Lean Body Mass and Body Fat Mass for a good balanced ratio. The '+' means to gain and the '-' means to lose. Basal Metabolic Rate Basal Metabolic Rate is the minimum number of calories needed to sustain life at a resting state. BMR is directly correlated with Lean Body Mass. Body Fat-Lean Body Mass Control Body Fat Mass Lean Body Mass (+) means to gain fat/lean (-) means to lose fat/lean 22.0 8.4+ 345.0 322.0 20 100 358.5 335.5 23.4 21.2 286.6 273.2 296.0 282.6 (Ω) 5ft.01.8in. Jane Doe 51 05.04.2020 09:46 (lbs) (lbs) (lbs) (%) (lbs) (lbs) (lbs) (lbs) (lbs) (lbs) 143.9 130.3 133.4 139.9 137.6 136.2 137.3 134.3 44.3 42.6 43.6 44.1 43.4 43.4 43.6 43.4 41.3 37.5 37.8 40.7 39.2 39.0 39.4 38.6 [InBody270] 60.0 21.6 48.7 130.3 Total Recent 1168 kcal Lean Body Mass 81.6 lbs Left Arm 3.99 lbs 90.2 % Right Arm 4.17 lbs 94.1 % Left Leg 10.16 lbs 72.8 % Right Leg 10.36 lbs 74.3 % Lean Mass Segment % 10.10.19 09:15 10.30.19 09:40 11.02.19 09:35 12.15.19 11:01 01.12.20 08:33 02.10.20 15:50 03.15.20 08:35 05.04.20 09:46 85 115 100 70 55 130 145 175 160 190 205 90 110 100 70 80 140 160 150 120 130 170 80 160 100 40 60 340 460 400 220 280 520 18.5 25.0 21.0 10.0 15.0 40.0 50.0 45.0 30.0 35.0 55.0 18.0 28.0 23.0 8.0 13.0 43.0 53.0 48.0 33.0 38.0 58.0 24.0 130.3 42.6 48.7 37.5 Trunk 36.9 lbs 92.2 % 1 7 8 9 10 2 3 4 5 6
3

For more information or to order contact InBodyCanada Marketing Support: marketing@inbodycanada.ca InBody 380 Body Composition Analyzer
InBody 380 | Social Media Template
YOUR ADDRESS PHONE NUMBER WEBSITE


marketing@inbodycanada.ca 19 Free
Product images are available on request
digital file template upon request.
More questions about InBody? Visit us at www.inbodycanada.ca
It

InBody 380 tests are accurate, fast, and non-invasive — simply step on the device, grab the handles, and in 30 seconds, you will receive detailed body composition results that you can review with your InBody specialist.


For more information or to order contact InBodyCanada Marketing Support: marketing@inbodycanada.ca InBody 380 | Tri-Fold
weight
health,
progress,
for
gives you a more in-depth understanding of your
and
helps you to track diet and exercise
and uses the power of data to set you up
Open the flap to view the sample Result Sheet
(555) 555-5555
www.abc.com Address 123 ABC Street City, State, 00000
tri-fold, 100lb coated gloss stock Pricing: 100 - $99 250 - $129 500 - $169 1000 - $199 (+shipping/HST) Your company logo and contact info can be added upon request. FRONT
Phone
Website
8.5”x11”
Tri-Fold Brochure
In just 30 seconds, you will receive a detailed Result Sheet with your body composition measurements. Use these results to:
Find Your Baseline
Scales show your weight as a basic number. See how much of your weight is Skeletal Muscle Mass and Body Fat Mass to find your baseline body composition so you you know what you need to lose, gain, or maintain.
Assess Your Percent Body Fat
BMI is a poor indicator of your health because it doesn’t differentiate between fat and muscle. Percent Body Fat (PBF) is a better health indicator, as it compares your fat levels to your weight. You can improve your health by focusing on fat loss, not just weight loss.
Measure Segmental Lean Mass
The InBody Test shows you how many pounds of lean mass you have in each body segment and how well-developed it is. Spot any insufficiencies or imbalances and tailor your exercises to achieve adequate lean mass in each part of your body.
Calculate Your Caloric Needs
Basal Metabolic Rate is the minimum calories you need to support basic function at rest. Use BMR to calculate your caloric needs and create a nutritional plan to achieve your goals.
Set Goals & Track Progress
Set goals and take the InBody Test every two weeks to track your progress. See your results from the past eight tests to spot changes in body composition and adjust your routine to prevent a plateau.


[InBody380]

marketing@inbodycanada.ca 21
BACK BR-USA-R6-A-230522 RA LA TR TR RL LL [000/000/000] 5 50 500 Impedance Results Interpretation QR Code Scan the QR Code to see resu s nterpretat on n more deta Research Parameters Fat F ree Mass Arm C rcum ference F F MI FMI SMI S M M W T 82.0 lb ( 80 9 98 8 11 9 in 33.0 % 15.1 kg/m2 18.9 kg/m2 15.6 kg/m2 Basal Metabolic Rate 1255 1178 kcal 14 51 12 6.4 6.4 25.6 3.5 3.3 233.5% 128.9% 128.1% 179.1% 173.8% Body Fat - Fat Free Mass Control Body Fat Mass Fat Free Mass lb lb (+) means to gain fat/lean (-) means to lose fat/lean -20.9 +7.5 SMI 5.6 kg/m 5.4 5.5 5.4 5.9 5.6 06.23.23 15:23 07.21.23 15:00 10.19.23 14:52 02.20.23 15:12 03.15.23 14:51 InBody Score Total score that reflects the evaluation of body composition. 67 Body Composition History PBF Percent Body Fat 143.9 44.3 41.8 0.399 140.8 44.0 40.7 0.398 137.5 43.4 39.2 0.396 136.2 43.4 39.0 0.396 137.3 43.6 39.4 0.397 134.2 43.4 38.6 0.396 133.3 43.6 37.7 0.399 130.3 43.4 36.7 0.398 Total Recent 02.21.23 15:11 03.27.23 14:58 04.20.23 15:02 06.23.23 15:23 07.21.23 15:00 10.19.23 14:52 02.20.23 15:12 03.15.23 14:51 ECW/TBW E C W /T B W - Phase Angle Phase Angle 0.360 0.390 0.380 0.340 0.320 0.400 0.410 0.420 0.398 4.0 Segmental L ean A nalysis (% (% (% (% (% 4.21 95.2 38.8 97.0 11.46 82.11 80.8 11.27 80 120 100 60 40 160 140 180 220 240 200 80 120 100 60 40 160 140 180 220 240 200 90 110 100 80 70 130 120 140 160 170 150 90 110 100 80 70 130 120 140 160 170 150 90 110 100 80 70 130 120 140 160 170 150 4.39 99.3 Based on ideal weight Based on current weight O b esity A nalysis 18.5 25.0 22.0 15.0 10.0 30.0 35.0 45.0 40.0 50.0 55.0 24.0 18.0 28.0 23.0 13.0 8.0 33.0 38.0 48.0 43.0 53.0 58.0 36.7 (kg/m BMI Body Mass Index PBF Percent Body Fat M uscle - F at A nalysis Weight Body Fat Mass SMM Skeletal Muscle Mass 85 115 100 70 55 130 145 175 160 190 205 90 110 100 70 80 140 160 150 120 130 170 80 160 100 40 60 340 460 400 220 280 520 130.3 43.4 47.8 Body C omposition A nalysis 36.6 24.3 21.6 47.8 60.8 82.5 130.3 5ft 01.8in Jane Doe 35 03.15.2023 14:51 Female
• 33”x 80”
• Hardware included
• Single and double sided available
• Your Logo Included Pricing: Single sided: $119 Double Sided: $217 (+shipping/HST)


For more information or to order contact InBodyCanada Marketing Support: marketing@inbodycanada.ca InBody 380 | Pull GRAY WHITE LEARN ABOUT BODY COMPOSITION TODAY! 31% Body Fat 0.383 ECW/TBW 73.2 lbs SMM 0.371 ECW/TBW 12% Body Fat 98.6 lbs SMM LEARN ABOUT BODY COMPOSITION TODAY!
Pull Up Banners


marketing@inbodycanada.ca 23
GENERIC FITNESS 40 0.320 0.340 0.360 0.380 0.390 0.400 0.410 0.420 0.430 0.440 0.450 0 0 0 80 90 100 10 120 130 140 150 160 170 Jane Doe 5ft.05.0in. 31 Female 39.9 24.3 23.8 47.4 64.2 88.0 135.4 135.4 47.6 47.4 22.5 35.0 0.376 4.17 88.6 4.03 92.7 39.6 89.6 13.36 90.5 13.49 18.3 9.3 3.3 24.0 7.1 1231 156.0% 158.9% 132.4% 11 503.3 452.0 396.7 521.9 470.2 414.8 30.0 26.3 20.0 397.3 346.4 305.0 386.8 338.7 300.2 135.4 47.0 34.7 0.376 1.12.19 07:13 134.1 47.1 36.2 0.378 1.25.19 07:15 134.2 46.7 32.5 0.376 12.02.19 07:05 135.4 47.8 36.0 0.374 12.16.19 07:01 136.7 48.2 34.3 0.376 12.25.19 06:58 135.3 46.5 34.2 0.376 01.02.20 06:45 135.0 47.9 33.9 0.378 01.15.20 07: 1 135.3 47.6 35.0 0.376 01.28.20 07:13 01.28.2020 07 13 WHAT ARE YOU MADE OF? TAKE THE INBODY TEST IT’S MORE THAN A BODY FAT TEST Discover New Health Insights Take an InBody Test Today! Body Composition Analysis? What Is ... Body composition analysis is ... A method of describing what your body is made of: fat, protein, minerals, and body water. Body composition analysis gives you the ability to track changes to your percent body fat, muscle mass, metabolism, and more. WHY BODY COMPOSITION ANALYSIS? By understanding your body composition, you can understand your current health and what you need to focus on to improve your wellbeing.
InBody 380 Product Poster


For more information or to order contact InBodyCanada Marketing Support: marketing@inbodycanada.ca InBody 380 C O P YRI GH T 2023 INBODY USA. For more information, visit 6.4 6.4 25.6 3.5 3.3 233.5% 128.9% 128.1% 179.1% 173.8% Body Fat - Fat Free Mass Control Body Fat Mass Fat Free Mass lb lb (+) means to gain fat/lean (-) means to lose fat/lean -20.9 +7.5 SMI 5.6 kg/m 5.4 5.5 5.4 5.9 5.6 06.23.23 15:23 07.21.23 15:00 10.19.23 14:52 02.20.23 15:12 03.15.23 14:51 InBody Score Total score that reflects the evaluation of body composition. 67 Body Compos PBF Percent Body Fat Total Recent ECW/TBW E C W /T B W - Phase Angle Segmental L e (% (% (% (% (% O b esity A nalysis 18.5 25.0 22.0 15.0 10.0 30.0 35.0 45.0 40.0 50.0 55.0 24.0 18.0 28.0 23.0 13.0 8.0 33.0 38.0 48.0 43.0 53.0 58.0 36.7 (kg/m2 BMI Body Mass Index PBF Percent Body Fat M uscle - F at A nalysis Weight Body Fat Mass SMM Skeletal Muscle Mass 85 115 100 70 55 130 145 175 160 190 205 90 110 100 70 80 140 160 150 120 130 170 80 160 100 40 60 340 460 400 220 280 520 130.3 43.4 47.8 Body C omposition A nalysis 36.6 24.3 21.6 47.8 60.8 82.5 130.3 5ft 01.8in Jane Doe 35 03.15.2023 14:51 Female [InBody380] The InBody 380 accurately analyzes your body’s composition, giving you an in-depth breakdown of the balance of muscle, fat, and water in each limb and the trunk. In 30 seconds, find out if your exercise and nutrition plan is working and whether your muscles are evenly developed. Test regularly to optimize your training and hit your health goals faster. Q uick & Comprehensive Insights
Sizes: • 12”x18” • 18”x27” • 24”x36” Printed on 20pt PVC Your Logo Included Pricing: 12”x18”: $19 18”x27”: $29 24”x36”: $39 (+shipping/HST)
Result Sheet Interpretation

marketing@inbodycanada.ca 25 380
Results Interpretation | 30-Second Body Composition Analysis Each individual’s ID is entered using the keypad and can include up to 14 alpha-numeric characters. PERSONAL INFORMATION 1 The InBody Score is a unique index created by InBody to make it easier for people to understand their body composition status. With a baseline set at 80 points, the score will be higher or lower based on an individual’s body fat and muscular development. INBODY SCORE 8 Skeletal Muscle Index (SMI) is a ratio of the skeletal muscle mass an individual has for functional movement, according to their height. SMI is calculated by adding together the Fat-Free Mass from the arms and legs (appendicular lean mass in kg) and dividing it by height² (m²). SMI 9 Visceral Fat is located in the abdominal region, between the organs. This output is a numerical representation of how much visceral fat an individual has. It is recommended that individuals stay below a Visceral Fat Level of 10 (equates to 100 cm² of Visceral Fat Area) to decrease risk for chronic disease. VISCERAL FAT LEVEL 12 From the Fat-Free Mass Index (FFMI), which shows an individual’s lean mass relative to their height, to the Skeletal Muscle Index (SMI), Fat Mass Index (FMI) and SMM/Weight (SMM/WT) ratio, the InBody 380’s research parameters enable professionals at hospitals and universities to gather comprehensive body composition metrics. RESEARCH PARAMETERS 14 This output displays the distribution of fat in each part of the body The amount of fat in each segment is shown in parentheses, while the bars indicate how the individual’s segmental fat mass compares to the healthy average. SEGMENTAL FAT ANALYSIS 11 Basal Metabolic Rate (BMR) is the minimum number of calories needed daily for life-sustaining bodily function in a resting state. BASAL METABOLIC RATE 13 Body Fat — Fat-Free Mass Control displays the changes recommended in Body Fat and Fat-Free Mass to obtain the healthy average Percent Body Fat for your sex (15% for males, 23% for females). The “+” means to gain, and the “-” means to lose. BODY FAT — FAT-FREE MASS CONTROL 10 Impedance is the resistance value measured when electrical currents are applied throughout the body. This graph shows impedance values at the different frequencies tested for each segment measured. The result values for the Trunk (TR) are shown on the right-hand side on a different scale since the values are much smaller than the rest of the segments. IMPEDANCE 15 BODY COMPOSITION ANALYSIS This section breaks down an individual’s body composition into distinct components. Weight is the sum of Body Fat Mass and Fat-Free Mass. Fat-Free Mass is the sum of Dry Lean Mass and Total Body Water. Total Body Water is the sum of Intracellular Water and Extracellular Water. Intracellular Water is the total amount of water inside the body’s cells, and Extracellular Water is the total amount of water outside the body’s cells. 2 MUSCLE-FAT ANALYSIS Compare Skeletal Muscle Mass (SMM) to Body Fat Mass The healthy range for both is indicated by the “-” at the top of the chart. Generally, the longer the SMM bar is compared to the Body Fat Mass bar, the healthier the individual’s balance is between muscle and fat, an indicator of decreased health risk. SMM is the amount of lean muscle attached to the bones and is involved in voluntary motion. Body Fat Mass is the sum of all the fat in the body, including Subcutaneous Fat, Visceral Fat, and the fat surrounding/within muscles. Subcutaneous Fat lies beneath the skin, while Visceral Fat surrounds internal organs in the abdomen. 3 OBESITY ANALYSIS Body Mass Index (BMI) is a calculation of weight (kg) divided by height squared (m²) and is commonly used as a general health marker. The healthy range for BMI recommended by the World Health Organization is 18.5-25.0 kg/m². Percent Body Fat (PBF) is the percentage of body fat compared to body weight. A healthy range for PBF is 10-20% for males and 18-28% for females 4 SEGMENTAL LEAN ANALYSIS This section displays Fat-Free Mass levels in the limbs and trunk, in human graph or bar graph format. In the bar graph, the top bar shows the amount of Fat-Free Mass in each of that individual’s segments compared to the healthy average for others with the same height and sex. In contrast, the bottom bar represents the sufficiency of each segment’s Fat-Free Mass for supporting the individual’s current weight. 5 ECW / TBW — PHASE ANGLE ECW/TBW the ratio of Extracellular Water to Total Body Water, is an important indicator of whether your body water is balanced. This output monitors the relationship of ECW/TBW to Phase Angle a metric which has been shown to indicate cell membrane strength. Check it to see whether increases in extracellular water are having a negative or positive effect on cellular health. 6 BODY COMPOSITION HISTORY Track how your body composition changes by taking the InBody Test periodically to monitor your progress. Continuously measuring under the same ID allows the InBody to save each test for future comparison. The Body Composition History enables an individual to track changes in body composition over the last eight test results (if selecting “Recent”). It shows a cumulative graph for the total progress from the first to most recent test (if selecting “Total”). You can customize which outputs are displayed to see how specific outputs, such as Body Fat Mass, alter over time. Pick up to four outputs to track on a single test, out of 15 options. 7 Copyright 2023 InBody USA | 380_v1.0 For more information: www.inbody.com BR-USA-R6-A-230522 RA LA TR TR RL LL (Ω) [000/000/000] 5 50 500 Impedance Results nterpretation QR Code Scan he QR Code to see resu ts n erpre at on n more de a Research Parameters Fat F ree Mass Arm Circum erence FF MI FMI SMI SM M /W T 82.0 lb ( 80 9 98 8 ) 11 9 in 33.0 % 15.1 kg m 18.9 kg m 15.6 kg m Basal Metabolic Rate 1255 1178 kcal 14 51 12 6.4 6.4 25.6 3.5 3.3 233.5% 128.9% 128.1% 179.1% 173.8% Body Fat - Fat Free Mass Control Body Fat Mass Fat Free Mass lb lb (+) means to gain fat/lean (-) means to lose fat/lean -20.9 +7.5 SMI 5.6 kg/m 5.4 5.5 5.4 5.9 5.6 06.23.23 15:23 07.21.23 15:00 10.19.23 14:52 02.20.23 15:12 03.15.23 14:51 InBody Score * Total score that reflects the evaluation of body composition. 67 Body Composition History (lb) (lb) (%) (%) PBF Percent Body Fat 143.9 44.3 41.8 0.399 140.8 44.0 40.7 0.398 137.5 43.4 39.2 0.396 136.2 43.4 39.0 0.396 137.3 43.6 39.4 0.397 134.2 43.4 38.6 0.396 133.3 43.6 37.7 0.399 130.3 43.4 36.7 0.398 Total Recent 02.21.23 15:11 03.27.23 14:58 04.20.23 15:02 06.23.23 15:23 07.21.23 15:00 10.19.23 14:52 02.20.23 15:12 03.15.23 14:51 ECW/TBW E C W /T B W - Phase Angle Phase Angle 0.360 0.390 0.380 0.340 0.320 0.400 0.410 0.420 0.398 4.0 Segmental L ean A nalysis (%) (lb) (%) (lb) (%) (lb) (%) (lb) (%) (lb) 4.21 95.2 38.8 97.0 11.46 82.11 80.8 11.27 80 120 100 60 40 160 140 180 220 240 200 80 120 100 60 40 160 140 180 220 240 200 90 110 100 80 70 130 120 140 160 170 150 90 110 100 80 70 130 120 140 160 170 150 90 110 100 80 70 130 120 140 160 170 150 4.39 99.3 Based on ideal weight Based on current weight O besity A nalysis 18.5 25.0 22.0 15.0 10.0 30.0 35.0 45.0 40.0 50.0 55.0 24.0 18.0 28.0 23.0 13.0 8.0 33.0 38.0 48.0 43.0 53.0 58.0 36.7 (kg/m ) (%) BMI Body Mass Index PBF Percent Body Fat M uscle - F at A nalysis Weight Body Fat Mass SMM Skeletal Muscle Mass (lb) (lb) (lb) 85 115 100 70 55 130 145 175 160 190 205 90 110 100 70 80 140 160 150 120 130 170 80 160 100 40 60 340 460 400 220 280 520 130.3 43.4 47.8 Body C omposition A nalysis (lb) (lb) (lb) (lb) 36.6 24.3 21.6 47.8 60.8 (59.5~72.8) 82.5 (80.9~98.8) 130.3 (99.2~134.0) 5ft 01.8in Jane Doe 35 03.15.2023 14:51 Female [InBody380] 2 3 4 5 6 7 11 12 13 14 15 1 10 9 8
| Posters

For more information or to order contact InBodyCanada Marketing Support: marketing@inbodycanada.ca InBody 570 Body Composition Analyzer
InBody 570 | Social Media Template


marketing@inbodycanada.ca 27
Free digital file template upon request. Product images are available on request More questions about InBody? Visit us at www.inbodycanada.ca BOOK YOUR BODY COMPOSITION TEST TODAY! www.website.com email INSERT LOGO
Pricing: $65 per pack of 100 (+HST)
Pre-printed, order online at shop.inbodycanada.ca


For more information or to order contact InBodyCanada Marketing Support: marketing@inbodycanada.ca InBody 570 | Result Sheet
BACK
Sheet Quick Guide Brochure


marketing@inbodycanada.ca 29
FRONT
8.5”x11” tri-fold, 100lb coated gloss stock Pricing: 100 - $99 250 - $129 500 - $169 1000 - $199 (+shipping/HST) Your company logo and contact info can be added upon request.
What is Body Composition?
Body composition is a method of breaking down your body into its core components: fat, muscle, and water. It gives you a more in-depth understanding of your weight and health, helps you track diet and exercise progress, and make any changes needed to meet your health goals.
Why is it important?
Body composition is a more accurate measure of your weight and health than BMI because it divides your weight into fat, muscle, and water. It tells you exactly what you're losing, gaining, or maintaining. With body composition analysis, you can measure your fat and muscle mass, track your progress, and make any changes needed to meet your goals.
InBody is an advanced body composition analyzer trusted by top hospitals, universities, and professional sports teams. The InBody Test is accurate, fast, and non-invasive— simply step on the device, grab the handles, and in 50 seconds, you will receive a detailed printout of your body composition results that you can review with your InBody specialist.


For more information or to order contact InBodyCanada Marketing Support: marketing@inbodycanada.ca InBody 570 | Tri-Fold
Reach your health goals with InBody! Open flap to view the sample Result Sheet
Learn
health Set Achievable Health Goals
how the InBody plan & meet your
Phone (555) 555-5555 Website www.abc.com Address 123 ABC Street City, State, 00000
FRONT
Tri-Fold Brochure
Achievable Goals
InBody Test helps you health goals!

marketing@inbodycanada.ca 31
BACK
• 33”x 80”
• Hardware included
• Single and double sided available
• Your Logo Included
Pricing:
Single sided: $119
Double Sided: $217
(+shipping/HST)
Same Height Different composition
For more information or to order contact InBodyCanada Marketing Support: marketing@inbodycanada.ca InBody 570 | Pull GRAY WHITE LEARN ABOUT BODY COMPOSITION TODAY! 31% Body Fat 0.383 ECW/TBW 73.2 lbs SMM 0.371 ECW/TBW 12% Body Fat 98.6 lbs SMM LEARN ABOUT BODY COMPOSITION TODAY!
Pull Up Banners

marketing@inbodycanada.ca 33
ABOUT COMPOSITION 55 70 85 100 70 80 90 100 40 60 80 100 160 0.320 0.340 0.360 0.380 0.390 70 80 90 100 John Doe 6ft.01.7in. 23 75.6 44.5 44.3 18.7 120.1 183.1 18.7 23.7 10.2 0.371 181.8 182.5 89.1 0.373 88.5 0.372 184.2 91.9 0.371 183.2 0.370 12.7 14.3 14.0 1:12 1:17 10:16 TAKE THE INBODY TEST SEE WHAT Y MA GENERIC FITNESS Jane Doe 5ft.05.0in. 31 Female 39.9 24.3 23.8 47.4 64.2 88.0 135.4 135.4 47.6 47.4 22.5 35.0 0.376 4.17 88.6 85.6 4.03 92.7 39.6 89.6 13.36 90.5 13.49 18.3 9.3 3.3 3.3 24.0 7.3 7.1 1231 156.0% 158.9% 202.2% 132.8% 132.4% 11 503.3 452.0 396.7 521.9 470.2 414.8 30.0 26.3 20.0 397.3 346.4 305.0 386.8 338.7 300.2 135.4 47.0 34.7 0.376 1.12.19 07:13 134.1 47.1 36.2 0.378 11.25.19 07:15 134.2 46.7 32.5 0.376 12.02.19 07:05 135.4 47.8 36.0 0.374 12.16.19 07:01 136.7 48.2 34.3 0.376 12.25.19 06:58 135.3 46.5 34.2 0.376 01.02.20 06:45 135.0 47.9 33.9 0.378 01.15.20 07:1 135.3 47.6 35.0 0.376 01.28.20 07:13 01.28.2020 07 13 WHAT ARE YOU MADE OF? TAKE THE INBODY TEST See What You’re Made of
• 33”x 80”
• Hardware included
• Single and double sided available
• Your Logo Included
Pricing:
Single sided: $119
Double Sided: $217
(+shipping/HST)
What is Body Composition


Body Composition is ...

A method of describing what your body is made of, including fat, protein, minerals, and body water.
Body composition gives you the ability to track changes to your percent body fat, muscle mass, metabolism, and more.

By understanding your body composition, you can understand where your body is right now and what you need to focus on to improve your health.

For more information or to order contact InBodyCanada Marketing Support: marketing@inbodycanada.ca IT’S MORE THAN A BODY FAT TEST Discover New Health Insights Take an InBody Test Today!
WHY BODY COMPOSITION?
InBody 570 | Pull
Pull Up Banners
How to Test

Remove Shoes & Socks

Wipe down your hands and feet with an InBody Tissue.
Step on the InBody
Align your feet with the foot electrodes. Wait for weight to be measured.


Enter Your Information
Accurate height is required for accurate results.
Optional: Input an ID to track your progress.

Follow Instructions
Hold both hand electrodes to begin testing.


Maintain Proper Posture
Keep arms straight and away from the torso. Stand straight and wait until test is completed.


marketing@inbodycanada.ca 35
Sizes:
• 12”x18”
• 18”x27”
• 24”x36”
Printed on 20pt PVC Your Logo Included
Pricing:
12”x18”: $19
18”x27”: $29
24”x36”: $39
(+shipping/HST)
How to Test


For more information or to order contact InBodyCanada Marketing Support: marketing@inbodycanada.ca InBody 570


Safety Poster
marketing@inbodycanada.ca 37 570 | Posters
Sizes:
12”x18”
18”x27” • 24”x36” Printed on 20pt PVC Your Logo Included
InBody 570 Product Poster


For more information or to order contact InBodyCanada Marketing Support: marketing@inbodycanada.ca InBody 570
Pricing:
24”x36”:
(+shipping/HST) Copyright The The PERSONAL 1 BODY This distinct Body Body and water amount 2 MUSCLE-FAT Compare The chart. compared balance risk. is attached is the visceral is found internal 3 OBESITY BMI and for 25.0 compared males 4 SEGMENTAL The segment for bar for 5 ECW ECW/TBW, is an High or individuals your may lifestyle, 6 BODY Track Test under comparison. track (if progress 7 For
•
•
12”x18”: $19 18”x27”: $29
$39
healthy range BMI recommended by the World Health Organization is 18.525.0 kg/m². Percent Body Fat (PBF) is the percentage of body fat compared to body weight. A healthy range for PBF is 10-20% for males and 18-28% for females.
SEGMENTAL LEAN ANALYSIS
The top bar shows the amount of Lean Body Mass in each segment for that individual compared to the healthy average others with the same height and gender, while the bottom represents the sufficiency of the segment’s Lean Body Mass supporting the individual’s current weight.
Result Sheet Interpretation

marketing@inbodycanada.ca 39 570 | Posters Results Interpretation | 45-Second Body Composition Analysis Copyright 2020 Biospace, Inc. 570_v1.6 The individual’s ID can be inputted with the keypad. The ID can be up to 14 alpha-numeric characters. PERSONAL INFORMATION Body Fat-Lean Body Mass Control displays the recommended changes in body fat and lean mass to obtain the healthy average Percent Body Fat for your gender (15% for males, 23% for females). The “+” means to gain and the “-” means to lose. BODY FAT-LEAN BODY MASS CONTROL 8 This displays the distribution of fat in each part of the body. The amount of fat in each segment is shown in parentheses, while the bars display how the individual’s segmental fat mass compares to the healthy average. SEGMENTAL FAT ANALYSIS 9 Basal Metabolic Rate (BMR) is the minimum number of calories needed for life-sustaining bodily function at a resting state. BASAL METABOLIC RATE 10 Visceral Fat Level is located in the abdominal region between the organs. The Visceral Fat Level is a numerical representation of how much visceral fat an individual has. It is recommended to stay below a Visceral Fat Level of 10 (equates to 100 cm² of Visceral Fat Area) to decrease risk for chronic disease. VISCERAL FAT LEVEL 11 Impedance is the resistance value measured when electrical currents are applied throughout the body. Based on the measured data, key body composition outputs can be analyzed. Impedance values can also be assessed for many research applications. IMPEDANCE 12 570 Default outputs: Personal Information, Body Composition Analysis, Muscle-Fat Analysis, Obesity Analysis, Segmental Lean Analysis, ECW/TBW Analysis, Body Composition History, Body Fat-Lean Body Mass Control, Segmental Fat Analysis, Basal Metabolic Rate, Visceral Fat Level, Results Interpretation, Impedance BODY COMPOSITION ANALYSIS This section breaks down the individual’s body composition into distinct components. Weight is the sum of Body Fat Mass and Lean Body Mass. Lean Body Mass is the sum of Dry Lean Mass and Total Body Water. Total Body Water is the sum of Intracellular Water and Extracellular Water. Intracellular Water is the total amount of water inside the body’s cells and Extracellular Water is the total amount of water outside the body’s cells. MUSCLE-FAT ANALYSIS Compare Skeletal Muscle Mass (SMM) to Body Fat Mass. The healthy range for both are indicated by the “-” at the top of the chart. Generally, the longer the Skeletal Muscle Mass bar is when compared to the Body Fat Mass bar, the healthier the individual’s balance is between muscle and fat, an indicator of decreased health risk. Skeletal Muscle Mass is the amount of skeletal muscle, which attached to the bones and produces movement. Body Fat Mass the sum of all the fat in the body including the subcutaneous fat, visceral fat, and fat surrounding/within muscles. Subcutaneous fat found beneath the skin, while visceral fat is found surrounding internal organs in the abdomen. OBESITY ANALYSIS BMI is a calculation of weight (kg) divided by height squared (m²) and commonly used as a general health marker. The
ECW / TBW ANALYSIS ECW/TBW, the ratio of Extracellular Water to Total Body Water, an important indicator of whether your body water is balanced. High ECW/TBW can be indicative of inflammation, swelling, edema while a lower ECW/TBW is typically observed in individuals with higher amounts of SMM. Understanding where your normal ECW/TBW is can help you identify deviations that may be indicative of changes in fluid balance due to hydration, lifestyle, or health status. BODY COMPOSITION HISTORY Track the history of body composition changes. Take the InBody Test periodically to monitor your progress. Continuously measuring under the same ID allows the InBody to save each test for future comparison. The Body Composition History allows an individual to track changes in body composition over the last eight test results selecting ’Recent’) or a cumulative graph that shows the total progress from the first to most recent test (if selecting ‘Total’). For more information: www.inbody.com 55 70 85 100 115 130 145 160 175 190 205 70 80 90 100 110 120 130 140 150 160 170 40 60 80 100 160 220 280 340 400 460 520 0.320 0.340 0.360 0.380 0.390 0.400 0.410 0.420 0.430 0.440 0.450 10.0 15.0 18.5 21.0 25.0 30.0 35.0 40.0 45.0 50.0 55.0 8.0 13.0 18.0 23.0 28.0 33.0 38.0 43.0 48.0 53.0 58.0 40 60 80 100 120 140 160 180 200 220 240 40 60 80 100 120 140 160 180 200 220 240 70 80 90 100 110 120 130 140 150 160 170 70 80 90 100 110 120 130 140 150 160 170 70 80 90 100 110 120 130 140 150 160 170 Jane Doe 5ft.05.0in. 31 Female 39.9 24.3 23.8 47.4 64.2 88.0 135.4 135.4 47.6 47.4 22.5 35.0 0.376 4.17 88.6 85.6 4.03 92.7 39.6 89.6 13.36 90.5 13.49 18.3 9.3 3.3 3.3 24.0 7.3 7.1 1231 156.0% 158.9% 202.2% 132.8% 132.4% 11 503.3 452.0 396.7 521.9 470.2 414.8 30.0 26.3 20.0 397.3 346.4 305.0 386.8 338.7 300.2 135.4 47.0 34.7 0.376 03.12.19 07:13 134.1 47.1 36.2 0.378 03.25.19 07:15 134.2 46.7 32.5 0.376 04.02.19 07:05 135.4 47.8 36.0 0.374 04.16.19 07:01 136.7 48.2 34.3 0.376 04.25.19 06:58 135.3 46.5 34.2 0.376 05.02.20 06:45 135.0 47.9 33.9 0.378 05.15.20 07:11 135.3 47.6 35.0 0.376 05.28.20 07:13 05.28.2020 07:13 1 8 9 10 11 12 2 3 4 5 6 7

For more information or to order contact InBodyCanada Marketing Support: marketing@inbodycanada.ca InBody 580 Body Composition Analyzer
InBody 580 | Social Media Template
YOUR ADDRESS PHONE NUMBER WEBSITE


Free digital file template upon request.
Product images are available on request

marketing@inbodycanada.ca 41
More questions about InBody? Visit us at www.inbodycanada.ca
- $99
- $129
- $199 (+shipping/HST)
Body composition is a method of breaking down your body into its core components: fat, muscle, and water. It gives you a more in-depth understanding of your weight and health, helps you to track diet and exercise progress, and uses the power of data to set you up for success.
InBody 580 tests are accurate, fast, and non-invasive — simply step on the device, grab the handles, and in 30 seconds, you will receive detailed body composition results that you can review with your InBody specialist.


For more information or to order contact InBodyCanada Marketing Support: marketing@inbodycanada.ca InBody 580 | Tri-Fold
Open the flap to view the sample Result Sheet Phone (555) 555-5555 Website www.abc.com Address 123 ABC Street City, State, 00000
stock Pricing: 100
1000
Your company
request. FRONT
8.5”x11” tri-fold, 100lb coated gloss
250
500 - $169
logo and contact info can be added upon
Tri-Fold Brochure
In just 30 seconds, you will receive a detailed Result Sheet with your body composition measurements.
Use these results to:
Find Your Baseline
Scales show your weight as a basic number. See how much of your weight is Skeletal Muscle Mass and Body Fat Mass to find your baseline body composition so you know what you need to lose, gain, or maintain.
Assess Your Percent Body Fat
BMI is a poor indicator of your health because it doesn’t differentiate between fat and muscle. Percent Body Fat (PBF) is a better health indicator, as it compares your fat levels to your weight. You can improve your health by focusing on fat loss, not just weight loss.
Measure Segmental Lean Mass
The InBody Test shows you how many pounds of lean mass you have in each body segment and how well-developed it is. Spot any insufficiencies or imbalances and tailor your exercises to achieve adequate lean mass in each part of your body.
Evaluate Visceral Fat
The Visceral Fat Area graph shows how many cm² of Visceral Fat you have in your abdomen around your organs. Decrease your risk for chronic diseases by getting this output below 100 cm².
Set Goals & Track Progress
Set goals and take the InBody Test every two weeks to track your progress. See your results from the past eight tests to spot changes in body composition and adjust your routine to prevent a plateau.


marketing@inbodycanada.ca 43
BACK 5ft 1.8 in Jane Doe 51 11.01.2023 14:51 Female BR-USA-R6-A-230522 Body Composition Analysis (lb) (lb) (lb) (lb) 36.6 24.3 21.6 47.8 60.8 (59.5~72.8) 82.5 (80.9~98.8) 130.3 (99.2~134.0) [InBody580] Muscle-Fat Analysis Weight Body Fat Mass S M M Skeletal Muscle M ss (lb) (lb) (lb) 85 115 100 70 55 130 145 175 160 190 205 90 110 100 70 80 140 160 150 120 130 170 80 160 100 40 60 340 460 400 220 280 520 130.3 43.4 47.8 Ob esity Analysis 18.5 25.0 22.0 15.0 10.0 30.0 35.0 45.9 40.0 50.0 55.0 24.0 18.0 28.0 23.0 13.0 8.0 33.0 38.0 48.0 43.0 53.0 58.0 36.7 (kg/m2) (%) BMI Body Mass Index PBF Pe cen Body Fa Visceral Fat Area 200 150 100 50 20 40 60 80 128.0 A g e VFA(cm ) Segmental Lean Analysis (%) (lb) (%) (lb) (%) (lb) (%) (lb) (%) (lb) 4.21 38.8 11.46 80.8 11.27 90 110 100 80 70 130 120 97.0 90 110 100 80 70 130 120 95.2 90 110 100 80 70 130 120 82.1 80 120 100 60 40 160 140 80 120 100 60 40 160 140 4.39 99.3 0.380 0.381 0.399 0.402 0.403 4.1 5.7˚ 4.0 3.8˚ 4.3 Based on deal weigh Based on current weight Phase Ang e RA LA TR TR RL LL (Ω) [000/000/000] 5 50 250 500 Impedance ECW / T B W- Phase Angle Phase Ang e 0.360 0.390 0.380 0.340 0.320 0.400 0.410 0.420 0.398 4.0 Bo dy Comp osition Histor y (lb) (lb) (lb) (%) BFM Body Fat Mass 143.9 44.3 51.8 41.3 140.8 44.0 51.0 40.7 137.5 43.4 50.0 39.2 136.2 43.4 49.4 39.0 137.3 43.6 50.5 39.4 134.2 43.4 49.2 38.6 133.3 43.6 48.9 37.7 130.3 43.4 47.8 36.7 Total Recent 04.30.23 13:55 05.10.23 15:55 06.10.23 14:51 07.23.23 15:23 08.01.23 15:00 09.15.23 14:52 10.05.23 15:12 11.01.23 14:51 Segmental ECW Analysis Right Arm Left Arm Trunk Right Leg Left Leg 1 30 1 26 12 1 3 62 3 57 ( ( ( ( ( ) ) ) ) ) 1.01 1.01 10.4 3.62 3.62 1.54 1.54 12.6 4.41 4.41 lb lb lb lb lb Segmental ICW Analysis Right Arm Left Arm Trunk Right Leg Left Leg 2 12 2 03 18 3 5 38 5 27 ( ( ( ( ( ) ) ) ) ) 1.65 1.65 17.0 5.91 5.91 2.45 2.45 20.7 7.23 7.23 lb lb lb lb lb Bioelectrical Impedance Vector Analysis Curren data High proportion of cell -4 -4 -3 -3 -2-1 -1 0 0 1 2 95% 75% 50% 3 4 1 2 3 4 Z(Xc/H Z(R/H High proportion f ate High propo tio of wate High propo tio o cells Re value from nBody Prev ou data
• 33”x 80”
• Hardware included
• Single and double sided available
• Your Logo Included Pricing: Single sided: $119 Double Sided: $217 (+shipping/HST)
For more information or to order contact InBodyCanada Marketing Support: marketing@inbodycanada.ca InBody 580 | Pull GRAY WHITE LEARN ABOUT BODY COMPOSITION TODAY! 31% Body Fat 0.383 ECW/TBW 73.2 lbs SMM 0.371 ECW/TBW 12% Body Fat 98.6 lbs SMM LEARN ABOUT BODY COMPOSITION TODAY!
Pull Up Banners

marketing@inbodycanada.ca 45
GENERIC FITNESS 40 0.320 0.340 0.360 0.380 0.390 0.400 0.410 0.420 0.430 0.440 0.450 0 0 0 80 90 100 10 120 130 140 150 160 170 Jane Doe 5ft.05.0in. 31 Female 39.9 24.3 23.8 47.4 64.2 88.0 135.4 135.4 47.6 47.4 22.5 35.0 0.376 4.17 88.6 4.03 92.7 39.6 89.6 13.36 90.5 13.49 18.3 9.3 3.3 24.0 7.1 1231 156.0% 158.9% 132.4% 11 503.3 452.0 396.7 521.9 470.2 414.8 30.0 26.3 20.0 397.3 346.4 305.0 386.8 338.7 300.2 135.4 47.0 34.7 0.376 1.12.19 07:13 134.1 47.1 36.2 0.378 1.25.19 07:15 134.2 46.7 32.5 0.376 12.02.19 07:05 135.4 47.8 36.0 0.374 12.16.19 07:01 136.7 48.2 34.3 0.376 12.25.19 06:58 135.3 46.5 34.2 0.376 01.02.20 06:45 135.0 47.9 33.9 0.378 01.15.20 07: 1 135.3 47.6 35.0 0.376 01.28.20 07:13 01.28.2020 07 13 WHAT ARE YOU MADE OF? TAKE THE INBODY TEST IT’S MORE THAN A BODY FAT TEST Discover New Health Insights Take an InBody Test Today! Body Composition Analysis? What Is ... Body composition analysis is ... A method of describing what your body is made of: fat, protein, minerals, and body water. Body composition analysis gives you the ability to track changes to your percent body fat, muscle mass, metabolism, and more. WHY BODY COMPOSITION ANALYSIS? By understanding your body composition, you can understand your current health and what you need to focus on to improve your wellbeing.


For more information or to order contact InBodyCanada Marketing Support: marketing@inbodycanada.ca InBody 580 C O P YRI GH T 2023 INBODY USA. v1.0 For more information, visit: www.inbody.com 5ft 1.8 in Jane Doe 51 11.01.2023 14:51 Female Body Composition Analysis (lb) (lb) (lb) (lb) 36.6 24.3 21.6 47.8 60.8 (59.5~72.8) 82.5 (80.9~98.8) 130.3 (99.2~134.0) [InBody580] Muscle-Fat Analysis Weight Body Fat Mass SMM Skeletal Muscle Mass (lb) (lb) (lb) 85 115 100 70 55 130 145 175 160 190 205 90 110 100 70 80 140 160 150 120 130 170 80 160 100 40 60 340 460 400 220 280 520 130.3 43.4 47.8 Obesity Analysis 18.5 25.0 22.0 15.0 10.0 30.0 35.0 45.9 40.0 50.0 55.0 24.0 18.0 28.0 23.0 13.0 8.0 33.0 38.0 48.0 43.0 53.0 58.0 36.7 (kg/m ) (%) BMI Body Mass Index PBF Percent Body Fat Visceral Fat Area 200 150 100 50 128.0 VFA(cm2 Segmental Lean Analysis (%) (lb) (% (lb) (% (lb) (% (lb) (% (lb) 4.21 38.8 11.46 80.8 11.27 90 110 100 80 70 130 120 97.0 90 110 100 80 70 130 120 95.2 90 110 100 80 70 130 120 82.1 80 120 100 60 40 160 140 80 120 100 60 40 160 140 4.39 99.3 0.380 0.381 0.399 0.402 0.403 Based on ideal weight Based on current weight Phase Angle ECW/TBW- Phase Angle 0.360 0.390 0.380 0.340 0.320 0.400 0.410 0.420 0.398 Body Composition History (lb) (lb) (lb) (%) BFM Body Fat Mass 143.9 44.3 51.8 41.3 140.8 44.0 51.0 40.7 137.5 43.4 50.0 39.2 136.2 43.4 49.4 39.0 137.3 43.6 50.5 39.4 134.2 43.4 49.2 38.6 133.3 43.6 48.9 37.7 Total Recent 04.30.23 13:55 05.10.23 15:55 06.10.23 14:51 07.23.23 15:23 08.01.23 15:00 09.15.23 14:52 10.05.23 15:12 Segmental ECW Analysis Right Arm Left Arm Trunk Right Leg Left Leg 1.30 1.26 12.1 3.62 3.57 ( ( ( ( ( ) ) ) ) ) 1.01 1.01 10.4 3.62 3.62 1.54 1.54 12.6 4.41 4.41 lb lb lb lb lb Segmental ICW Analysis Right Arm Left Arm Trunk Right Leg Left Leg 2.12 2.03 18.3 5.38 5.27 ( ( ( ( ( ) ) ) ) ) 1.65 1.65 17.0 5.91 5.91 2.45 2.45 20.7 7.23 7.23 lb lb lb lb lb The InBody 580 combines gold-standard accuracy with advanced outputs, measuring your muscle and fat distribution as well as checking your cellular wellbeing, abdominal fat, hydration level, and more. Getting these in-depth insights takes just 30 seconds. Use them to build better nutrition and exercise plans, so you can attain peak condition. Health Analysis, Perfected
Sizes: • 12”x18” • 18”x27” • 24”x36” Printed on 20pt PVC Your Logo Included Pricing: 12”x18”: $19 18”x27”: $29 24”x36”: $39 (+shipping/HST) Each can PERSONAL 1 BODY This distinct Fat-Free Total Water amount is the 2 MUSCLE-FAT Compare The chart. Fat muscle amount in voluntary the surrounding/within skin, 3 OBESITY Body height marker. Health percentage PBF 4 SEGMENTAL This The for the the the Segmental this changes 5 ECW ECW/TBW important output metric Check a negative 6 BODY Track periodically the The last for “Total”). specific outputs 7
InBody 580 Product Poster
Result Sheet Interpretation
marketing@inbodycanada.ca 47 580
Results Interpretation | 30-Second Body Composition Analysis Copyright 2024 InBody USA 580_v1.0 Each individual’s ID is entered using the keypad and include up to 14 alpha-numeric characters. PERSONAL INFORMATION This section shows how much Extracellular Water (in pounds) is contained in an individual’s limbs and trunk. This can help with the identification of localized swelling, which may indicate health-related issues. Compare it with the Segmental ECW/TBW Ratio in the Segmental Lean Analysis section to see where changes are occurring. SEGMENTAL ECW ANALYSIS 8 This section shows how much Intracellular Water (in pounds) is contained in an individual’s limbs and trunk. This can assist you in evaluating body water distribution. Examine these values alongside Segmental Lean Analysis to understand if Fat-Free Mass changes are due to water retention or muscle gain. SEGMENTAL ICW ANALYSIS 9 Visceral Fat is found in the abdominal region between your organs. The Visceral Fat Area graph depicts how many cm2 of Visceral Fat you have at the cross-section of the abdominal region. Staying below 100 cm² in the Visceral Fat Area can help decrease the risk for chronic diseases. VISCERAL FAT AREA 10 Useful for research, a Bioelectrical Impedance Vector Analysis (BIVA) graph compares the raw resistance and reactance values measured in an individual’s body, then depicts the distribution of hydration and body cell mass on an X-Y graph that also displays the percentiles related to the healthy average. Utilize it to help you gauge an individual’s hydration level and cellular health BIVA GRAPH 11 Impedance is the resistance value measured when electrical currents are applied throughout the body. This graph shows impedance values at the different frequencies tested for each segment measured. The result values for the Trunk (TR) are shown on the right-hand side on a different scale since the values are much smaller than the rest of the segments. IMPEDANCE 12 BODY COMPOSITION ANALYSIS This section breaks down an individual’s body composition into distinct components. Weight is the sum of Body Fat Mass and Fat-Free Mass. Fat-Free Mass is the sum of Dry Lean Mass and Total Body Water. Total Body Water is the sum of Intracellular Water and Extracellular Water. Intracellular Water is the total amount of water inside the body’s cells, and Extracellular Water the total amount of water outside the body’s cells. MUSCLE-FAT ANALYSIS Compare Skeletal Muscle Mass (SMM) to Body Fat Mass The healthy range for both is indicated by the “-” at the top of the chart. Generally, the longer the SMM bar is compared to the Body Mass bar, the healthier the individual’s balance is between muscle and fat, an indicator of decreased health risk. SMM is the amount of lean muscle attached to the bones and is involved voluntary motion. Body Fat Mass is the sum of all the fat in body, including Subcutaneous Fat, Visceral Fat, and the fat surrounding/within muscles. Subcutaneous Fat lies beneath the skin, while Visceral Fat surrounds internal organs in the abdomen. OBESITY ANALYSIS Body Mass Index (BMI) is a calculation of weight (kg) divided by height squared (m²) and is commonly used as a general health marker. The healthy range for BMI recommended by the World Health Organization is 18.5-25.0 kg/m². Percent Body Fat (PBF) is the percentage of body fat compared to body weight. A healthy range for PBF is 10-20% for males and 18-28% for females SEGMENTAL LEAN ANALYSIS This section displays Fat-Free Mass levels in the limbs and trunk. The top bar shows the amount of Fat-Free Mass in each segment that individual compared to the healthy average for others with same height and sex. In contrast, the bottom bar represents sufficiency of each segment’s Fat-Free Mass for supporting individual’s current weight. These values are shown alongside Segmental ECW/TBW Ratio and Segmental Phase Angle. Compare this data with Segmental ICW Analysis to see if Fat-Free Mass changes are due to muscle gain or water retention. ECW / TBW ANALYSIS ECW/TBW, the ratio of Extracellular Water to Total Body Water, is an important indicator of whether your body water is balanced. This output monitors the relationship of ECW/TBW to Phase Angle, a metric which has been shown to indicate cell membrane strength. Check it to see whether increases in extracellular water are having negative or positive effect on cellular health. BODY COMPOSITION HISTORY Track how your body composition changes by taking the InBody Test periodically to monitor your progress. Continuously measuring under same ID allows the InBody to save each test for future comparison. The Body Composition History enables you to track changes over the last eight test results (if selecting “Recent”). It shows a cumulative graph the total progress from the first to most recent test (if selecting “Total”). You can customize which outputs are displayed to see how specific outputs, such as Body Fat Mass, alter over time. Pick up to four outputs to track on a single test, out of 15 options. For more information: www.inbody.com 5ft 1.8 in Jane Doe 51 03.01.2024 14:51 Female BR-USA-R6-A-230522 Body Composition Analysis (lb) (lb) (lb) (lb) 36.6 24.3 21.6 47.8 60.8 (59.5~72.8) 82.5 (80.9~98.8) 130.3 (99.2~134.0) [InBody580] Muscle-Fat Analysis Weight Body Fat Mass SMM Skeletal Muscle Mass (lb) (lb) (lb) 85 115 100 70 55 130 145 175 160 190 205 90 110 100 70 80 140 160 150 120 130 170 80 160 100 40 60 340 460 400 220 280 520 130.3 43.4 47.8 Obesity Analysis 18.5 25.0 22.0 15.0 10.0 30.0 35.0 45.9 40.0 50.0 55.0 24.0 18.0 28.0 23.0 13.0 8.0 33.0 38.0 48.0 43.0 53.0 58.0 36.7 (kg/m ) (%) BMI Body Mass Index PBF Percent Body Fat Visceral Fat Area 200 150 100 50 20 40 60 80 128.0 Age VFA(cm ) Segmental Lean Analysis (%) (lb) (% (lb) (% (lb) (% (lb) (% (lb) 4.21 38.8 11.46 80.8 11.27 90 110 100 80 70 130 120 97.0 90 110 100 80 70 130 120 95.2 90 110 100 80 70 130 120 82.1 80 120 100 60 40 160 140 80 120 100 60 40 160 140 4.39 99.3 0.380 0.381 0.399 0.402 0.403 4.1 5.7˚ 4.0 3.8 4.3˚ Based on ideal weight Based on current weight Phase Angle RA LA TR TR RL LL (Ω) [000/000/000] 5 50 250 500 Impedance ECW/TBW- Phase Angle Phase Angle 0.360 0.390 0.380 0.340 0.320 0.400 0.410 0.420 0.398 4.0 Body Composition History (lb) (lb) (lb) (%) BFM Body Fat Mass 143.9 44.3 51.8 41.3 140.8 44.0 51.0 40.7 137.5 43.4 50.0 39.2 136.2 43.4 49.4 39.0 137.3 43.6 50.5 39.4 134.2 43.4 49.2 38.6 133.3 43.6 48.9 37.7 130.3 43.4 47.8 36.7 Total Recent 11.24.23 13:55 12.08.23 15:55 12.22.23 14:51 01.05.24 15:23 01.19.24 15:00 02.02.24 14:52 02.16.24 15:12 03.01.24 14:51 Segmental ECW Analysis Right Arm Left Arm Trunk Right Leg Left Leg 1.30 1.26 12.1 3.62 3.57 ( ( ( ( ( ) ) ) ) ) 1.01 1.01 10.4 3.62 3.62 1.54 1.54 12.6 4.41 4.41 lb lb lb lb lb Segmental ICW Analysis Right Arm Left Arm Trunk Right Leg Left Leg 2.12 2.03 18.3 5.38 5.27 ( ( ( ( ( ) ) ) ) ) 1.65 1.65 17.0 5.91 5.91 2.45 2.45 20.7 7.23 7.23 lb lb lb lb lb Bioelectrical Impedance Vector Analysis Current data High proportion of cells -4 -4 -3 -3 -2 -1 -1 0 0 1 2 95% 75% 50% 3 4 1 2 3 4 Z(Xc/Ht) Z(R/Ht) High proportion of water High proportion of water High proportion of cells Ref. values from InBody Previous data 8 9 10 11 12 2 3 4 5 6 7
| Posters
1

For more information or to order contact InBodyCanada Marketing Support: marketing@inbodycanada.ca InBody 770 Body Composition Analyzer
InBody 770 | Social Media Template


Free digital file template upon request.
Product images are available on request

marketing@inbodycanada.ca 49
8.5”x11” tri-fold, 100lb coated gloss stock Pricing: 100 - $99 250 - $129
500 - $169 1000 - $199 (+shipping/HST) Your company logo and contact info can be added upon request.
What is Body Composition?
Body composition is a method of breaking down your body into its core components: fat, muscle, and water. It gives you a more in-depth understanding of your weight and health, helps you track diet and exercise progress, and make any changes needed to meet your health goals.
Why is it important?
Body composition is a more accurate measure of your weight and health than BMI because it divides your weight into fat, muscle, and water. It tells you exactly what you're losing, gaining, or maintaining. With body composition analysis, you can measure your fat and muscle mass, track your progress, and make any changes needed to meet your goals.
Open flap to view the sample Result Sheet
InBody is an advanced body composition analyzer trusted by top hospitals, universities, and professional sports teams. The InBody Test is accurate, fast, and non-invasive— simply step on

Achievable

For more information or to order contact InBodyCanada Marketing Support: marketing@inbodycanada.ca
Set
Health Goals
Address
Phone (555) 555-5555 Website www.abc.com
123 ABC Street City, State, 00000
FRONT InBody 770 | Tri-Fold
Tri-Fold Brochure
Achievable Goals

marketing@inbodycanada.ca 51
BACK
• 33”x 80”
• Hardware included
• Single and double sided available
• Your Logo Included
Pricing:
Single sided: $119
Double Sided: $217
(+shipping/HST)
Same Height Different composition
For more information or to order contact InBodyCanada Marketing Support: marketing@inbodycanada.ca 5 GRAY WHITE LEARN ABOUT BODY COMPOSITION TODAY! 31% Body Fat 0.383 ECW/TBW 73.2 lbs SMM 0.371 ECW/TBW 12% Body Fat 98.6 lbs SMM LEARN ABOUT BODY COMPOSITION TODAY!
InBody 770 | Pull
Pull Up Banners

marketing@inbodycanada.ca 53 COMPOSITION
k % D Heigh Ag Body Compos t on History ECW/TBW Ana ysis Obes ty Ana ys s Body Compos t on Ana ys s Muscle-Fat Ana ysis S g nt L A y i T B d Extrac llu Wat Dry L an Ma s Body Fa Ma s Body Fa Ma s trac llu Wat Weigh BM PBF PBF Righ A Lef A T k Righ L g Lef L g ECW/TBW Weigh ECW/TBW SMM SMM 0.360 0.390 0.340 0.320 0.380 6f 01 0 n John Doe 30 b b % b b b b % b % b % b % b % b Tota Rec n 82.2 47.2 47.6 14.8 129.4 190.1 190.7 189.7 101.2 100.2 95.2 7.8 8.3 10.2 10.02.19 11.10.19 11.21.19 11.24.19 85 70 55 90 70 80 80 40 60 15 100 10 100 160 100 90 10 90 10 100 80 70 100 80 70 90 10 100 80 70 85 15 100 70 55 7.6 14.8 4 0.364 0.364 0.366 0.36 TAKE THE INBODY TEST SEE WHAT Y MA GENERIC FITNESS kg (% D Heigh Age Test Da e Time Body Composi ion History ECW/TBW Analys s Ob ty Ana ys Gende Body Composi ion Analysis Muscle-Fat Analysis Segmenta Lean Analys s ota Body Water Value Lean Body Mass W igh Extracellular Wate Dry L Mas Body Fat Mass Body Fat Mass Intracellular Wate W igh BM Bod M Ind PBF PBF d Righ Arm Left Arm T unk Righ Leg Left Leg ECW/TBW W igh ECW/TBW SMM SMM ECW TBW [InBody770] V Fat Are 200 150 100 50 20 40 60 80 Ag VFA 105.6 5ft.05 0in J Do 31 01.28.2020 07 13 lb lb lb (% lb lb lb lb lb % % % Tota Rece Femal 39.9 24.3 23.8 47.4 64.2 88.0 135.3 135.5 42.8 40.3 0.376 07:13 134.9 43.2 39.5 0.378 07:15 135.4 44.0 38.6 0.376 07:05 136.1 44.7 37.9 0.374 07:01 137.6 45.6 37.4 0.376 06:58 135.2 45.3 36.7 0.376 06:45 134.6 45.7 35.9 0.378 07: 1 135.3 47.6 35.0 0.376 07:13 Body Fat - Lean Body Mass Con o ody a ass Lean Body Mass means o ga n a lea - mea s o s le n 18.3 9.3+ Segmen a Fa Ana ys s R h A Le A m R gh L g Le L g 3.3 3.3 24.0 7.3 7.1 lbs) ) ) ) ) RA LA TR RL LL 5 50 250 React X Z RA LA TR RL 1 5 50 500 1000 ø 5.4 p d Wh B d Ph A g 50 Ba Me bo R kcal Leg Lean Mass lbs TBW LBM 73.0 % Resu s n e pretation QR Code S h QR Cod resu s erp a on n mo e d a 21.1 37.0 32.3 20.9 36.9 32.2 1.9 3.2 3.4 20.8 37.5 26.4 20.2 35.3 27.8 4.7 4.5 7.0 6.2 6.0 513.6 503.3 452.0 396.7 384.3 530.2 521.9 402.2 31.0 30.0 17.8 407.2 397.3 346.4 299.4 396.2 386.8 294.0 0.374 0.374 0.377 0.374 0.377 22.5 35.0 47.4 135.3 47.6 4.17 88.6 4.03 85.6 39.6 92.7 13.36 89.6 13.49 90.5 26.9 156.0% 158.9% 132.4% 1231 0.376 WHAT ARE YOU MADE OF? TAKE THE INBODY TEST See What You’re Made of
InBody 770 | Pull Up Banners
What is Body Composition | How to Test


• 33”x 80”
• Hardware included
• Single and double sided available
• Your Logo Included

Body composition gives you the ability to track changes to your percent


For more information or to order contact InBodyCanada Marketing Support: marketing@inbodycanada.ca
Remove Shoes & Socks Wipe down your hands and IT’S MORE THAN A BODY FAT TEST Discover New Health Insights Take an InBody Test Today!
...
fat, protein,
body water.
Body Composition is
A method of describing what your body is made of, including
minerals, and
fat,
WHY BODY COMPOSITION?
can understand where your body is right now
need to focus on to improve
health.
body
muscle mass, metabolism, and more.
By understanding your body composition, you
and what you
your
Pricing: Single sided: $119 Double Sided: $217 (+shipping/HST)
InBody 770 | Posters
InBody 770 Product Poster

Your company logo and contact info can be added upon request.
marketing@inbodycanada.ca 55
24” x 36”
Sizes:
• 12”x18”
• 18”x27”
• 24”x36”
Printed on 20pt PVC Your Logo Included
Pricing:
12”x18”: $19
18”x27”: $29
24”x36”: $39
(+shipping/HST)
How to Test


For more information or to order contact InBodyCanada Marketing Support: marketing@inbodycanada.ca
InBody 770

Safety Poster

marketing@inbodycanada.ca 57 770 | Posters
Sizes: • 12”x18”
• 18”x27”
• 24”x36”
Printed on 20pt PVC Your Logo Included
Pricing:
12”x18”: $19
18”x27”: $29
24”x36”: $39
(+shipping/HST)
Results Interpretation: Body Water Analysis

For more information or to order contact InBodyCanada Marketing Support: marketing@inbodycanada.ca
InBody 770

Results Interpretation: Body Composition Analysis

marketing@inbodycanada.ca 59 770 | Posters


For more information or to order contact InBodyCanada Marketing Support: marketing@inbodycanada.ca
970 Body Composition Analyzer
InBody
InBody 970 | Social Media Template


Free digital file template upon request.
Product images are available on request

marketing@inbodycanada.ca 61
- $99
- $129
- $169 1000 - $199 (+shipping/HST) Your company logo and contact info can be

What is Body Composition?
Body composition is a method of breaking down your body into its core components: fat, muscle, and water. It gives you a more in-depth understanding of your weight and health, helps you track diet and exercise progress, and make any changes needed to meet your health goals.
Why is it important?
Body composition is a more accurate measure of your weight and health than BMI because it divides your weight into fat, muscle, and water. It tells you exactly what you're losing, gaining, or maintaining. With body composition analysis, you can measure your fat and muscle mass, track your progress, and make any changes needed to meet your goals.
InBody is an advanced body composition analyzer trusted by top hospitals, universities, and professional sports teams. The InBody Test is accurate, fast, and non-invasive— simply step on the device, grab the handles, and in 70 seconds, you will receive a detailed printout of your body composition results that you can review with your InBody specialist.


For more information or to order contact InBodyCanada Marketing Support: marketing@inbodycanada.ca
your health goals with InBody!
Reach
Open flap to view the sample Result Sheet
Learn how the InBody plan & meet your health Set Achievable Health Goals Phone (555) 555-5555 Website
Address 123
100
250
FRONT InBody 970 | Tri-Fold
www.abc.com
ABC Street City, State, 00000 8.5”x11” tri-fold, 100lb coated gloss stock Pricing:
500
Tri-Fold Brochure
Achievable Goals
InBody Test helps you health goals!
Why take an InBody Test?
In just 70 seconds, you will receive a detailed Result Sheet with your body composition measurements. Use these results to:
Find Your Baseline
Scales show your weight as a basic number.
See how much of your weight is Skeletal Muscle Mass and Body Fat Mass to find your baseline so you know what you need to lose, gain, or maintain.
Assess Your Percent Body Fat
BMI is a poor indicator of your health because it doesn't di erentiate between fat and muscle.
Percent Body Fat (PBF) is a better health indicator as it compares your fat levels to your weight. You can improve your health by focusing on fat loss, not just weight loss.
Measure Segmental Lean Mass
The InBody Test shows you how many pounds of lean mass you have in each body segment and how well developed it is. Spot any insu iciencies or imbalances and tailor your exercises to achieve adequate lean mass in each part of your body.
Calculate Your Caloric Needs
Basal Metabolic Rate is the minimum calories you need to support basic function at rest. Use BMR to calculate your caloric needs and create a nutritional plan to achieve your goals.
Set Goals & Track Progress
Set your goals and take the InBody Test every 2 weeks to track your progress. See your results from the past 8 tests to spot changes in body composition and adjust your routine to prevent a plateau.
For more info, check out:


marketing@inbodycanada.ca 63
BACK
(kg/m ) (%) IR-USA-C7-C-210521 Based on ideal eigh Based on curren eigh 0.360 0.390 0.340 0.320 0.380 0.420 0.440 0.410 0.400 0.430 0.450 18.5 25.0 22.0 10.0 15.0 40.0 50.0 45.0 30.0 35.0 55.0 10.0 20.0 15.0 0.0 5.0 35.0 45.0 40.0 25.0 30.0 50.0 5 ft 06 3 in John Doe 31 04.01.2022 09:13 (lb) (lb) (lb) (%) (lb) (lb) (lb) (lb) (lb) (lb) (%) (lb) (%) (lb) (%) (lb) (%) (lb) (%) (lb) Total Recent Male 59.7 34.8 34.4 35.1 94.6 129.0 164.1 161.3 75.0 18.2 0.372 161.4 74.7 18.5 0.371 160.3 75.2 17.5 0.370 161.4 74.7 18.3 0.372 160.9 74.5 18.6 0.370 162.0 74.5 19.0 0.370 165.8 75.2 20.3 0.370 164.1 73.6 21.4 0.368 09.15.21 07:42 10.01.21 06:50 11.10.21 06:52 12.04.21 06:45 01.02.22 06:30 02.12.22 06:16 03.02.22 06:12 04.01.22 09:13 0.376 0.378 0.367 0.363 0.368 70 55 190 205 70 80 160 170 40 60 460 520 130 145 175 160 140 150 120 130 340 400 220 280 85 115 90 110 100 70 55 160 175 145 130 90 110 100 80 70 140 150 130 120 100 80 70 140 150 130 120 90 110 100 80 70 140 150 130 120 85 115 100 70 55 160 175 145 130 26.2 21.4 35.1 164.1 73.6 7.12 103.6 7.01 102.0 56.2 102.5 19.80 103.4 19.45 101.6 154.3% 161.3% 209.2% 148.2% 145.3% 0.368 Segmental Fat Analysis Research Parameters Right Arm Left Arm Trunk Right Leg Left Leg Intracellular Water Extracellular Water Basal Metabolic Rate Body Cell Mass Leg Lean Mass SMI Visceral Fat Area A g e VFA cm ) Impedance RA LA TR TR RL LL 59 7 34 8 1635 85 5 39 2 8 5 ( ( ( ( ) ) ) ) 48.1 29.3 1600 68.6 58.6 35.9 1873 84.0 lb lb kcal lb lb kg/m2 200 150 100 50 20 40 60 80 109 9 Whole Body Phase Angle 50 6.7˚ ø( ) Segmental Phase Angle RA LA TR RL LL 2.3 5.9 5.6 5 50 250 2.1 5.5 5.0 3.5 8.7 9.5 3.0 7.4 5.5 2.7 7.0 5.5 ø( ) 1 5 50 250 500 1000 2000 3000 (Ω [000/000/000] ( 2 0 lb) ( 2 0 lb) ( 18 3 lb) ( 5 3 lb) ( 5 1 lb) Body Fat - Fat Free Mass Control Body Fat Mass Fat Free Mass -12 3 lb 0 0 lb (+)means to gain fat/lean (-)means to lose fat/lean (77.4~94.6) (105.2~128.5) (116.8~158.3) 85 90 80 115 110 160 100 100 100
• 33”x 80”
• Hardware included
• Single and double sided available
• Your Logo Included
Pricing:
Single sided: $119
Double Sided: $217
(+shipping/HST)
Same Height Different composition
For more information or to order contact InBodyCanada Marketing Support: marketing@inbodycanada.ca 5 GRAY WHITE LEARN ABOUT BODY COMPOSITION TODAY! 31% Body Fat 0.383 ECW/TBW 73.2 lbs SMM 0.371 ECW/TBW 12% Body Fat 98.6 lbs SMM
ABOUT BODY COMPOSITION TODAY!
LEARN
InBody 970 | Pull
Pull Up Banners


marketing@inbodycanada.ca 65
kg ) (%) Ba d o eal wei h Ba ed o curre wei h 18.5 25.0 22.0 10.0 15.0 40.0 50.0 45.0 30.0 35.0 55.0 10.0 20.0 15.0 0.0 5.0 35.0 45.0 40.0 25.0 30.0 50.0 5 f 06 3 n John Doe 31 04.01.2022 09:13 lb lb lb (% lb lb lb lb lb lb %) lb %) %) lb %) lb ) lb Tota Recen Male 59.7 34.8 34.4 35.1 94.6 129.0 164.1 161.3 75.0 18.2 0.372 161.4 74.7 18.5 0.371 160.3 75.2 17.5 0.370 161.4 74.7 18.3 0.372 160.9 74.5 18.6 0.370 162.0 74.5 19.0 0.370 165.8 75.2 20.3 0.370 164.1 73.6 21.4 0.368 09.15.21 07:42 10.01.21 06:50 11.10.21 06:52 12.04.21 06:45 01.02.22 06:30 02.12.22 06:16 03.02.22 06:12 04.01.22 09:13 0.376 0.378 0.367 0.363 0.368 85 15 100 70 55 160 175 145 130 90 10 100 80 70 140 150 130 120 26.2 21.4 35.1 164.1 73.6 7.12 103.6 7.01 102.0 56.2 102.5 19.80 103.4 19.45 101.6 154.3% 161.3% 209.2% 148.2% 145.3% 0.368 Segmental Fat Ana ys s Research Parameters Right Arm Left Arm Trunk Right Leg Left Leg Intracellular Water Extracellular Water Basal Metabolic Rate Body Cell Mass Leg Lean Mass SMI V scera Fat Area Age VFA Impedance RA LA TR TR RL LL 59 7 34 8 1635 85 5 39 2 8 5 ( ( ( ( 48.1 29.3 1600 68.6 58.6 35.9 1873 84.0 lb lb kcal lb lb kg/m 200 150 100 50 20 40 60 80 109 9 Whole Body Phase Angle 50 6.7˚ ø( Segmental Phase Angle RA LA TR RL LL 2.3 5.9 5.6 5 50 250 2.1 5.5 5.0 3.5 8.7 9.5 3.0 7.4 5.5 2.7 7.0 5.5 ø( 1 5 50 250 500 1000 2000 3000 (Ω [000/000/000] ( 2 0 b ( 2 0 b 18 3 lb ( 5 3 b ( 5 1 b Body Fat - Fat Free Mass Control Body Fat Mass Fat Free Mass -12 3 b 0 0 b (+)means to gain fat/lean (-)means to lose fat/lean (77.4~94.6) (105.2~128.5) ( 16.8~158.3) WHAT ARE YOU MADE OF? TAKE THE INBODY TEST See What You’re Made of
• 33”x 80”
• Hardware included
• Single and double sided available
• Your Logo Included
Pricing:
Single sided: $119
Double Sided: $217
(+shipping/HST)
What is Body Composition
Body Composition is ...
A method of describing what your body is made of, including fat, protein, minerals, and body water.
Body composition gives you the ability to track changes to your percent body fat, muscle mass, metabolism, and more.
WHY BODY COMPOSITION?
By understanding your body composition, you can understand where your body is right now and what you need to focus on to improve your health.

For more information or to order contact InBodyCanada Marketing Support: marketing@inbodycanada.ca IT’S MORE THAN A BODY FAT TEST Discover New Health Insights Take an InBody Test Today!
InBody 970 | Pull
Pull Up Banners
How to Test

Remove Shoes & Socks
Wipe down your hands and feet with an InBody Tissue. The InBody Tissue will help with your body’s conductivity.

Step on the InBody
Align your feet with the foot electrodes. Wait for weight to be measured.


Optional but recommended to input a unique User ID to track your progress. Accurate height is required for the best results.

If your fingerprint is registered with the InBody device, you can scan your finger to automatically access your personal information via the digital display.

Follow the step-by-step instructions to properly grab the handles and place your thumbs on the oval electrodes.
Maintain Proper Posture

Remain still while keeping arms straight and away from the torso until the test is completed.
Track Your Progress


Test every 2-4 weeks to effectively monitor and track your progress.


marketing@inbodycanada.ca 67
-
Sizes:
• 12”x18”
• 18”x27”
• 24”x36”
Printed on 20pt PVC
Your Logo Included
Pricing:
12”x18”: $19
18”x27”: $29
24”x36”: $39
(+shipping/HST)
InBody 970 Product Poster: Body Composition


For more information or to order contact InBodyCanada Marketing Support: marketing@inbodycanada.ca InBody
970


marketing@inbodycanada.ca 69 970 | Posters Composition
InBody 970 Product Poster: Body Water
Results Interpretation: Body Water Analysis
For more information or to order contact InBodyCanada Marketing Support: marketing@inbodycanada.ca InBody 970 Copyright 2022 InBody USA 970_BW_v1.0 The individual’s ID can be inputted with the keypad. The ID can be up to 14 alpha-numeric characters. PERSONAL INFORMATION 1 This section separates the Segmental Body Water Analysis Extracellular Body Water changes in ECW/TBW are SEGMENTAL ICW 7 Skeletal Muscle Mass is the bones to produce movement. the fat in the body including fat, and fat surrounding/within found beneath the skin, while internal organs in the abdomen. MUSCLE-FAT ANALYSIS 9 BMI is a calculation of weight and commonly used as a for BMI recommended by 25.0 kg/m². Percent Body compared to body weight. males and 18-28% for females. OBESITY ANALYSIS 10 This section breaks down distinct components. Fat and Total Body Water. Total Water and Extracellular Water. amount of water inside the the total amount of water is the sum of all the fat in visceral fat, and fat surrounding/within BODY COMPOSITION 8 Intracellular water (ICW) body’s cells. Extracellular found in the body’s interstitial plasma that is found outside Rate (BMR) is defined as the body uses at rest. RESEARCH PARAMETERS 11 Phase Angle (PhA) is known cellular integrity. The InBody Phase Angle and Segmental The higher the PhA, the healthier WHOLE BODY PHASE 12 Impedance is the measured of electrical currents that the body. Based on the measured composition outputs can is also used for many research IMPEDANCE 13 970 Default outputs: Personal Information, Body Water Composition, ECW/TBW Analysis, Segmental Body Water Analysis, Segmental ECW/TBW Analysis, Body Water Composition History, Segmental ICW Analysis, Segmental ECW Analysis, Body Composition Analysis, Muscle-Fat Analysis, Obesity Analysis, Research Parameters, Whole Body Phase Angle, Impedance BODY WATER COMPOSITION Total Body Water is expressed in terms of weight in pounds, and is broken into Intracellular Water (ICW) and Extracellular Water (ECW) ICW is the water that is contained inside the body’s cells, and ECW is the water present outside of the cells. The healthy range is indicated by the “-” at the top of this section and is related to a healthy muscle-fat balance. A healthy balance of ICW and ECW is important for overall health and function.
ECW / TBW ANALYSIS ECW/TBW, the ratio of Extracellular Water to Total Body Water is an important indicator of whether your body water is balanced. High ECW/TBW can be indicative of inflammation, swelling, or edema while a lower ECW/TBW is typically observed in individuals with higher amounts of SMM. Understanding where your normal ECW/TBW is can help you identify deviations that may be indicative of changes in fluid balance due to hydration, lifestyle, or health status. A healthy range for extracellular water and total body water—made up of intracellular and extracellular water—is between 0.36-0.39. 3 SEGMENTAL BODY WATER ANALYSIS The Segmental Body Water Analysis shows how much Total Body Water (in pounds) is contained in each of the body’s five segments. 4 SEGMENTAL ECW / TBW ANALYSIS The Segmental ECW/TBW Analysis displays the ECW/TBW in each of the body’s five segments. Segmental analysis allows for identification of localized swelling, which may indicate circulatory or other health-related issues. 5 BODY WATER COMPOSITION HISTORY Track the history of body water composition changes. Take the InBody Test periodically to monitor your progress. Continuously measuring using the same ID allows the InBody to save each test for future comparison. The Body Water Composition History allows an individual to track changes in body water over the last eight test results (if selecting ‘Recent’) or a cumulative graph that shows the total progress from the first to most recent test (if selecting ‘Total’). 6 For more information: www.inbody.com Male 5ft 06.3in John Doe 31 04.01.2022 09:13 (lb) (lb) (lb) (lb) (lb) (lb) (lb) (lb) Right Arm Left Arm Trunk Right Leg Left Leg 0.376 0.378 0.367 0.363 0.368 Total Recent Whole Body Phase Angle [000/000/000] 6.7 Obesity Analysis BMI PBF Weight Skeletal Muscle Mass Body Fat Mass 164.1 73.6 35.1 ( ( ( ) ) ) 116.8 58.4 16.5 158.3 71.7 33.1 lb lb lb Muscle-Fat Analysis Body Composition Analysis lntracellular Water Extracellular Water Dry Lean Mass Fat Free Mass Body Fat Mass 59.7 34.8 34.4 129.0 35.1 ) ) ) ) ) 48.1 29.3 27.8 105.2 16.5 58.6 35.9 34.0 128.5 33.1 lb lb lb lb lb Segmental ECW Analysis Right Arm Left Arm Trunk Right Leg Left Leg 2.07 2.07 15.9 5.56 5.56 ( ( ( ( ( ) ) ) ) ) 1.65 1.65 14.1 4.87 4.87 2.23 2.23 17.2 5.97 5.97 lb lb lb lb lb Segmental ICW Analysis Right Arm Left Arm Trunk Right Leg Left Leg 3.46 3.40 27.8 9.77 9.52 ) ) ) ) ) 2.71 2.71 22.7 7.96 7.96 3.68 3.68 27.8 9.72 9.72 lb lb lb lb lb IR-USA-C7-C-210521 lb) (lb lb) lb) 60.8 59.7 61.1 60.8 61.1 60.8 60.6 60.6 35.9 34.8 35.7 35.7 35.9 35.9 35.5 35.5 96.8 94.6 96.6 97.0 96.8 96.1 96.1 96.8 94.6 59.7 34.8 0.368 5.53 5.47 43.7 15.32 15.08 09.15.21 07:42 10.01.21 06:50 11.10.21 06:52 12.04.21 06:45 01.02.22 06:30 02.12.22 06:16 03.02.22 06:12 04.01.22 09:13 26.2 21.4 ) ) 18.5 14.0 25.0 50.0 kg/m % Intracelluar Water Extracelluar Water Basal Metabolic Rate 59.7 34.8 1635 ( ( ( ) ) ) 48.1 29.3 1600 58.6 35.9 1873 lb lb lb Research Parameters 161.3 0.372 161.4 0.371 160.3 0.370 161.4 0.372 160.9 0.370 162.0 0.370 165.8 0.370 164.1 0.368 1 7 11 10 9 8 12 13 2 3 4 5 6 Results Interpretation | 70-Second Body Water Analysis
2
• 12”x18” • 18”x27” • 24”x36”
Pricing: 12”x18”:
18”x27”:
24”x36”:
(+shipping/HST)
Sizes:
Printed on 20pt PVC Your Logo Included
$19
$29
$39
3
marketing@inbodycanada.ca 71 970 | Posters values expressed in the Analysis into Intracellular and and can be used to identify where occurring. & ECW ANALYSIS the amount of muscle attached to the movement. Body Fat Mass is the sum of all including the subcutaneous fat, visceral surrounding/within muscles. Subcutaneous fat is while visceral fat is found surrounding abdomen. ANALYSIS weight (kg) divided by height squared (m²) general health marker. The healthy range the World Health Organization is 18.5 Fat (PBF) is the percentage of body fat A healthy range for PBF is 10-20% for females. ANALYSIS the individual’s body composition into Free Mass is the sum of Dry Lean Mass Total Body Water is the sum of Intracellular Water. Intracellular Water is the total the body’s cells and Extracellular Water is outside the body’s cells. Body Fat Mass the body including the subcutaneous fat, surrounding/within muscles. COMPOSITION ANALYSIS is the amount of water found within the water (ECW) is the amount of water interstitial fluid, transcellular fluid, and blood outside the body’s cells. Basal Metabolic the amount of energy (in calories) that a PARAMETERS known to be an indicator of InBody provides Whole Body Segmental Phase Angle at 50 kHz. healthier the body’s cells are. PHASE ANGLE measured opposition to the flow are applied throughout measured data, key body be analyzed. Impedance research purposes. Results Interpretation: Body Composition Analysis Results Interpretation | Body Composition Analysis Result Sheet Copyright 2022 970_BC_v1.7 by InBody. All rights reserved. The individual’s ID is entered using the keypad and can be up to 14 alpha-numeric characters. PERSONAL INFORMATION 1 Visceral Fat is in the abdominal region between the organs. The Visceral Fat Area graph depicts how many cm of Visceral Fat is measured at the cross-section of the abdominal region. Staying below 100cm of the Visceral Fat area can help decrease the risk for chronic diseases. VISCERAL FAT AREA 8 Body Fat-Fat Free Mass Control displays the recommended changes in body fat and fat free mass to obtain the healthy average Percent Body Fat for your gender (15% for males, 23% for females). The “+” means to gain, and the “-” means to lose. BODY FAT-FAT FREE MASS CONTROL 9 This displays the distribution of fat in each part of the body The amount of fat in each segment is shown in parentheses, while the bars indicate how the individual’s segmental fat mass compares to the healthy average. SEGMENTAL FAT ANALYSIS 10 Basal Metabolic Rate (BMR) is the minimum number of calories needed for life-sustaining bodily function at a resting state. BASAL METABOLIC RATE 11 Phase Angle (PhA) is an indicator of cellular integrity. The InBody unit provides Whole Phase Angle at 50kHz and Segmental Body Phase Angle at 5, 50 and 250 kHz. The higher the PhA, the healthier the body’s cells. PHASE ANGLE 13 Impedance is the resistance value measured when electrical currents are applied throughout the body. Based on the measured data, key body composition outputs can be analyzed. Impedance values can also be assessed for many research applications. The graph shows impedance values at the different frequencies tested for each segment measured. The result values for the Trunk (TR) are shown on the right hand side on a different scale since the values are much smaller than the rest of the segments. The [000/000/000] indicates all measurements are normal. Otherwise, the corresponding segment(s) and error code will be shown. IMPEDANCE 14 Skeletal Muscle Index (SMI) is a ratio of the skeletal muscle mass an individual has for functional movement according to height. SMI is calculated by adding the fat free mass from the arms and legs (appendicular lean mass in kg) and dividing it by height (m ). SMI 12 BODY COMPOSITION ANALYSIS This section breaks down the individual’s body composition into distinct components. Weight is the sum of Body Fat Mass and Fat Free Mass Fat Free Mass is the sum of Dry Lean Mass and Total Body Water Total Body Water is the sum of Intracellular Water and Extracellular Water Intracellular Water is the total amount of water inside the body’s cells, and Extracellular Water is the total amount of water outside the body’s cells.
MUSCLE-FAT ANALYSIS Compare Skeletal Muscle Mass (SMM) to Body Fat Mass The healthy range for both is indicated by the “-” at the top of the chart. Generally, the longer the Skeletal Muscle Mass bar is compared to the Body Fat Mass bar, the healthier the individual’s balance is between muscle and fat, an indicator of decreased health risk. Skeletal Muscle Mass is the amount of lean muscle attached to the bones and is involved in voluntary motion. Body Fat Mass is the sum of all the fat in the body, including Subcutaneous Fat Visceral Fat and fat surrounding/ within muscles. Subcutaneous Fat is beneath the skin, while Visceral Fat surrounds internal organs in the abdomen.
2
OBESITY ANALYSIS Body Mass Index (BMI) is a calculation of weight (kg) divided by height squared (m ) and is commonly used as a general health marker. The healthy range for BMI recommended by the World Health Organization is 18.5 - 25.0 kg/m Percent Body Fat (PBF) is the percentage of body fat compared to body weight. A healthy range for PBF is 10-20% for males and 18-28% for females. 4 SEGMENTAL LEAN ANALYSIS The top bar shows the amount of Lean Mass in each segment for that individual compared to the healthy average for others with the same height and gender. In contrast, the bottom bar represents the sufficiency of the segment’s Lean Mass for supporting the individual’s current weight. 5 ECW / TBW ANALYSIS ECW/TBW the ratio of Extracellular Water to Total Body Water is an important indicator of whether your body water is balanced. High ECW/TBW can indicate inflammation swelling or edema while a lower ECW/TBW is typically observed in individuals with higher amounts of SMM. Understanding your normal ECW/ TBW can help you identify deviations that may indicate changes in the fluid balance due to hydration, lifestyle, or health status. This can be seen segmentally in the Segmental Lean Analysis Section. 6 BODY COMPOSITION HISTORY Track the history of body composition changes. Take the InBody Test periodically to monitor your progress. Continuously measuring under the same ID allows the InBody to save each test for future comparison. The Body Composition History enables an individual to track changes in body composition over the last eight test results (if selecting ’Recent’). It shows a cumulative graph for the total progress from the first to most recent test (if selecting ‘Total’). 7 For more information: www.inbody.com kg/m ) (%) IR-USA-C7-C-210521 Based on ideal weight Based on current weight 0.360 0.390 0.340 0.320 0.380 0.420 0.440 0.410 0.400 0.430 0.450 5 ft 06.3 in John Doe 31 04.01.2022 09:13 (lb) (lb) (lb) (%) (lb) (lb) (lb) (lb) (lb) (lb) %) (lb) %) (lb) %) (lb) %) (lb) %) (lb) Total Recent Male 59.7 34.8 34.4 35.1 94.6 129.0 164.1 161.3 75.0 18.2 0.372 161.4 74.7 18.5 0.371 160.3 75.2 17.5 0.370 161.4 74.7 18.3 0.372 160.9 74.5 18.6 0.370 162.0 74.5 19.0 0.370 165.8 75.2 20.3 0.370 164.1 73.6 21.4 0.368 09.15.21 07:42 10.01.21 06:50 11.10.21 06:52 12.04.21 06:45 01.02.22 06:30 02.12.22 06:16 03.02.22 06:12 04.01.22 09:13 0.376 0.378 0.367 0.363 0.368 70 55 190 205 70 80 160 170 40 60 460 520 130 145 175 160 140 150 120 130 340 400 220 280 85 115 90 110 100 70 55 160 175 145 130 90 110 100 80 70 140 150 130 120 100 80 70 140 150 130 120 90 110 100 80 70 140 150 130 120 85 115 100 70 55 160 175 145 130 26.2 21.4 35.1 164.1 73.6 7.12 103.6 7.01 102.0 56.2 102.5 19.80 103.4 19.45 101.6 154.3% 161.3% 209.2% 148.2% 145.3% 0.368 Segmental Fat Analysis Research Parameters Right Arm Left Arm Trunk Right Leg Left Leg Intracellular Water Extracellular Water Basal Metabolic Rate Body Cell Mass Leg Lean Mass SMI Visceral Fat Area Age VFA(cm Impedance RA LA TR TR RL LL 59.7 34.8 1635 85.5 39.2 8.5 ) ) ) ) 48.1 29.3 1600 68.6 58.6 35.9 1873 84.0 lb lb kcal lb lb kg/m2 200 150 100 50 20 40 60 80 109.9 Whole Body Phase Angle 50 6.7˚ ø Segmental Phase Angle RA LA TR RL LL 2.3 5.9 5.6 5 50 250 2.1 5.5 5.0 3.5 8.7 9.5 3.0 7.4 5.5 2.7 7.0 5.5 ø 1 5 50 250 500 1000 2000 3000 (Ω) [000/000/000] ( 2.0 lb) ( 2.0 lb) ( 18.3 lb) ( 5.3 lb) ( 5.1 lb) Body Fat - Fat Free Mass Control Body Fat Mass Fat Free Mass -12.3 lb 0.0 lb (+)means to gain fat/lean (-)means to lose fat/lean (77.4~94.6) (105.2~128.5) (116.8~158.3) 85 90 80 115 110 160 100 100 100 1 9 10 13 14 2 3 4 5 6 7 8 11 12 Body Composition Summary, Body Composition Analysis, Research parameters (BMI, Percent Body Fat, Waist-Hip Ratio, Visceral Fat Area, Obesity Degree, Waist Circumference, FMI, Skeletal Muscle Mass, Soft Lean Mass, FFMI, SMI, Protein, Body Cell Mass, Minerals, Bone Mineral Content, Basal Metabolic Rate, Arm Circumference, Arm Muscle Circumference, TBW/FFM) Segmental Body Phase Angle (5kHz, 50kHz, 250kHz: Right Arm, Left Arm, Trunk, Right Leg, Left Leg), Whole Body Phase Angle, Impedance Graph, Weight, Skeletal Muscle Mass, Body Fat Mass, Extracellular Water Ratio, Phase Angle: Whole Body (Today’s Results, Recent Results, Differences), Fat Free Mass, Extracellular Water Ratio, Phase Angle: Right Arm, Left Arm, Trunk, Right Leg, Left Leg (Today’s Results, Recent Results, Differences), Whole body, Segmental Body Cole-Cole Plot (Today’s Results, Recent Results)
Sizes:
• 12”x18”
• 18”x27”
• 24”x36”
Printed on 20pt PVC
Your Logo Included
Pricing:
12”x18”: $19
18”x27”: $29
24”x36”: $39
(+shipping/HST)
Safety Poster
For more information or to order contact InBodyCanada Marketing Support: marketing@inbodycanada.ca InBody
970
How to Test


marketing@inbodycanada.ca 73 970 | Posters


For more information or to order contact InBodyCanada Marketing Support: marketing@inbodycanada.ca InBody BWA 2.0 Body Water Analyzer
InBody BWA 2.0 | Social Media Template

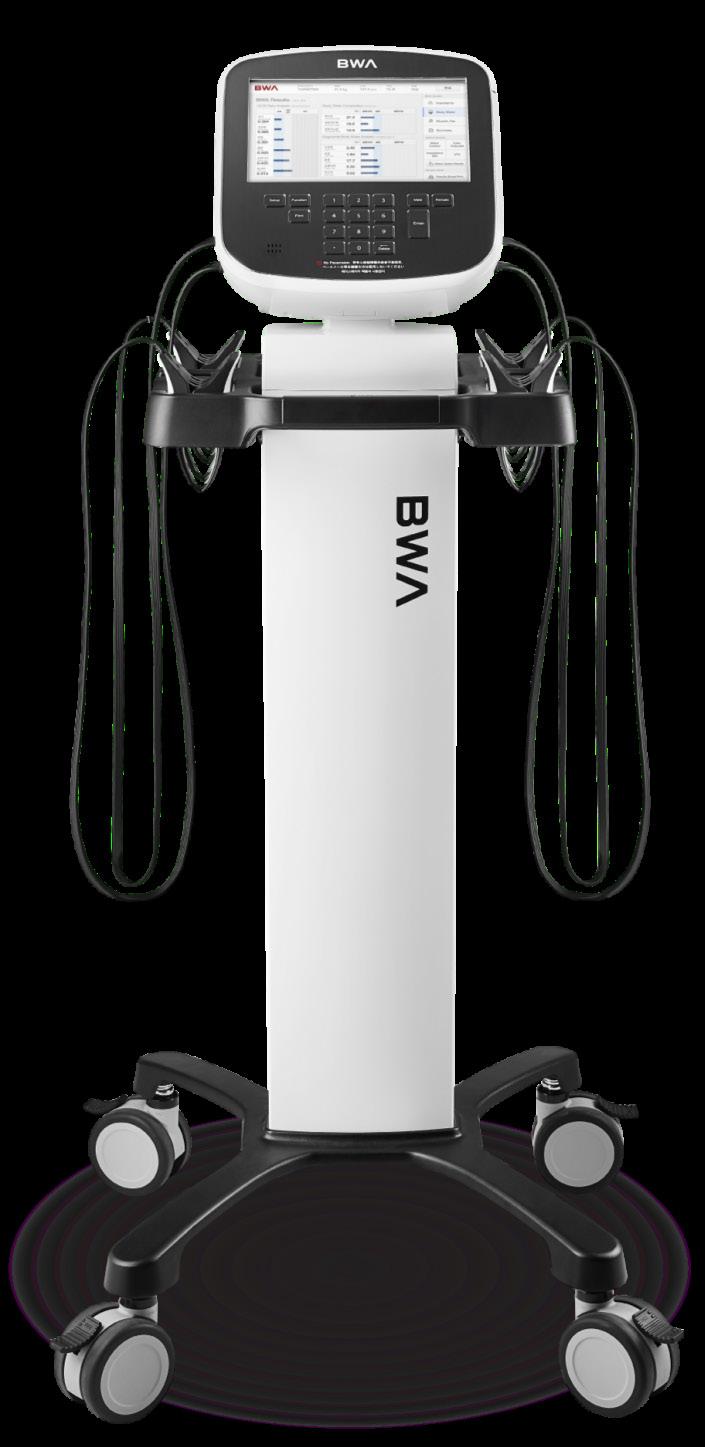
Free digital file template upon request.
Product images are available on request

marketing@inbodycanada.ca 75
- $199 (+shipping/HST) Your company logo and contact info can be
What is Body Composition?
Body composition is a method of breaking down your body into its core components: fat, muscle, and water. It gives you a more in-depth understanding of your weight and health, helps you track diet and exercise progress, and make any changes needed to meet your health goals. Why is it important?
Body composition is a more accurate measure of your weight and health than BMI because it divides your weight into fat, muscle, and water. It tells you exactly what you're losing, gaining, or maintaining. With body composition analysis, you can measure your fat and muscle mass, track your progress, and make any changes needed to meet your goals.
InBody is an advanced body composition analyzer trusted by top hospitals, universities, and professional sports teams. The InBody Test is accurate, fast, and non-invasive— simply step on the device, grab the handles, and in 70 seconds, you will receive a detailed printout of your body composition results that you can review with your InBody specialist.
For more information or to order contact InBodyCanada Marketing Support: marketing@inbodycanada.ca
your health goals with InBody! Open flap to view the sample Result Sheet
Reach
Learn how the InBody plan & meet your health Set Achievable Health Goals Phone (555) 555-5555 Website www.abc.com Address 123 ABC Street City, State, 00000 Print
tri-fold,
gloss stock: 100
250
500
1000
FRONT InBody BWA 2.0 |
Costs – 8.5x11”
100lb coated
- $99
- $129
- $169
| Tri-Fold Brochure
Achievable Goals
InBody Test helps you health goals!

marketing@inbodycanada.ca 77
BACK
• 33”x 80”
• Hardware included
• Single and double sided available
• Your Logo Included
Price each:
Single sided: $119
Double Sided: $217 (+shipping/HST)
For more information or to order contact InBodyCanada Marketing Support: marketing@inbodycanada.ca WHITE LEARN ABOUT BODY COMPOSITION TODAY! 31% Body Fat 0.383 ECW/TBW 73.2 lbs SMM 0.371 ECW/TBW 12% Body Fat 98.6 lbs SMM Same
Height Different
InBody
2.0
BWA
| Pull Up Banners
Different composition
marketing@inbodycanada.ca 79
GRAY LEARN ABOUT BODY COMPOSITION TODAY!
• 33”x 80”
• Hardware included
• Single and double sided available
• Your Logo Included
Pricing:
Single sided: $119
Double Sided: $217 (+shipping/HST)

For more information or to order contact InBodyCanada Marketing Support: marketing@inbodycanada.ca InBody BWA 2.0
See What You’re Made of
| Pull Up Banners
What is Body Composition

marketing@inbodycanada.ca 81
Sizes:
• 12”x18”
• 18”x27”
• 24”x36”
Printed on 20pt PVC
Your Logo Included
Pricing:
12”x18”: $19
18”x27”: $29
24”x36”: $39
(+shipping/HST)
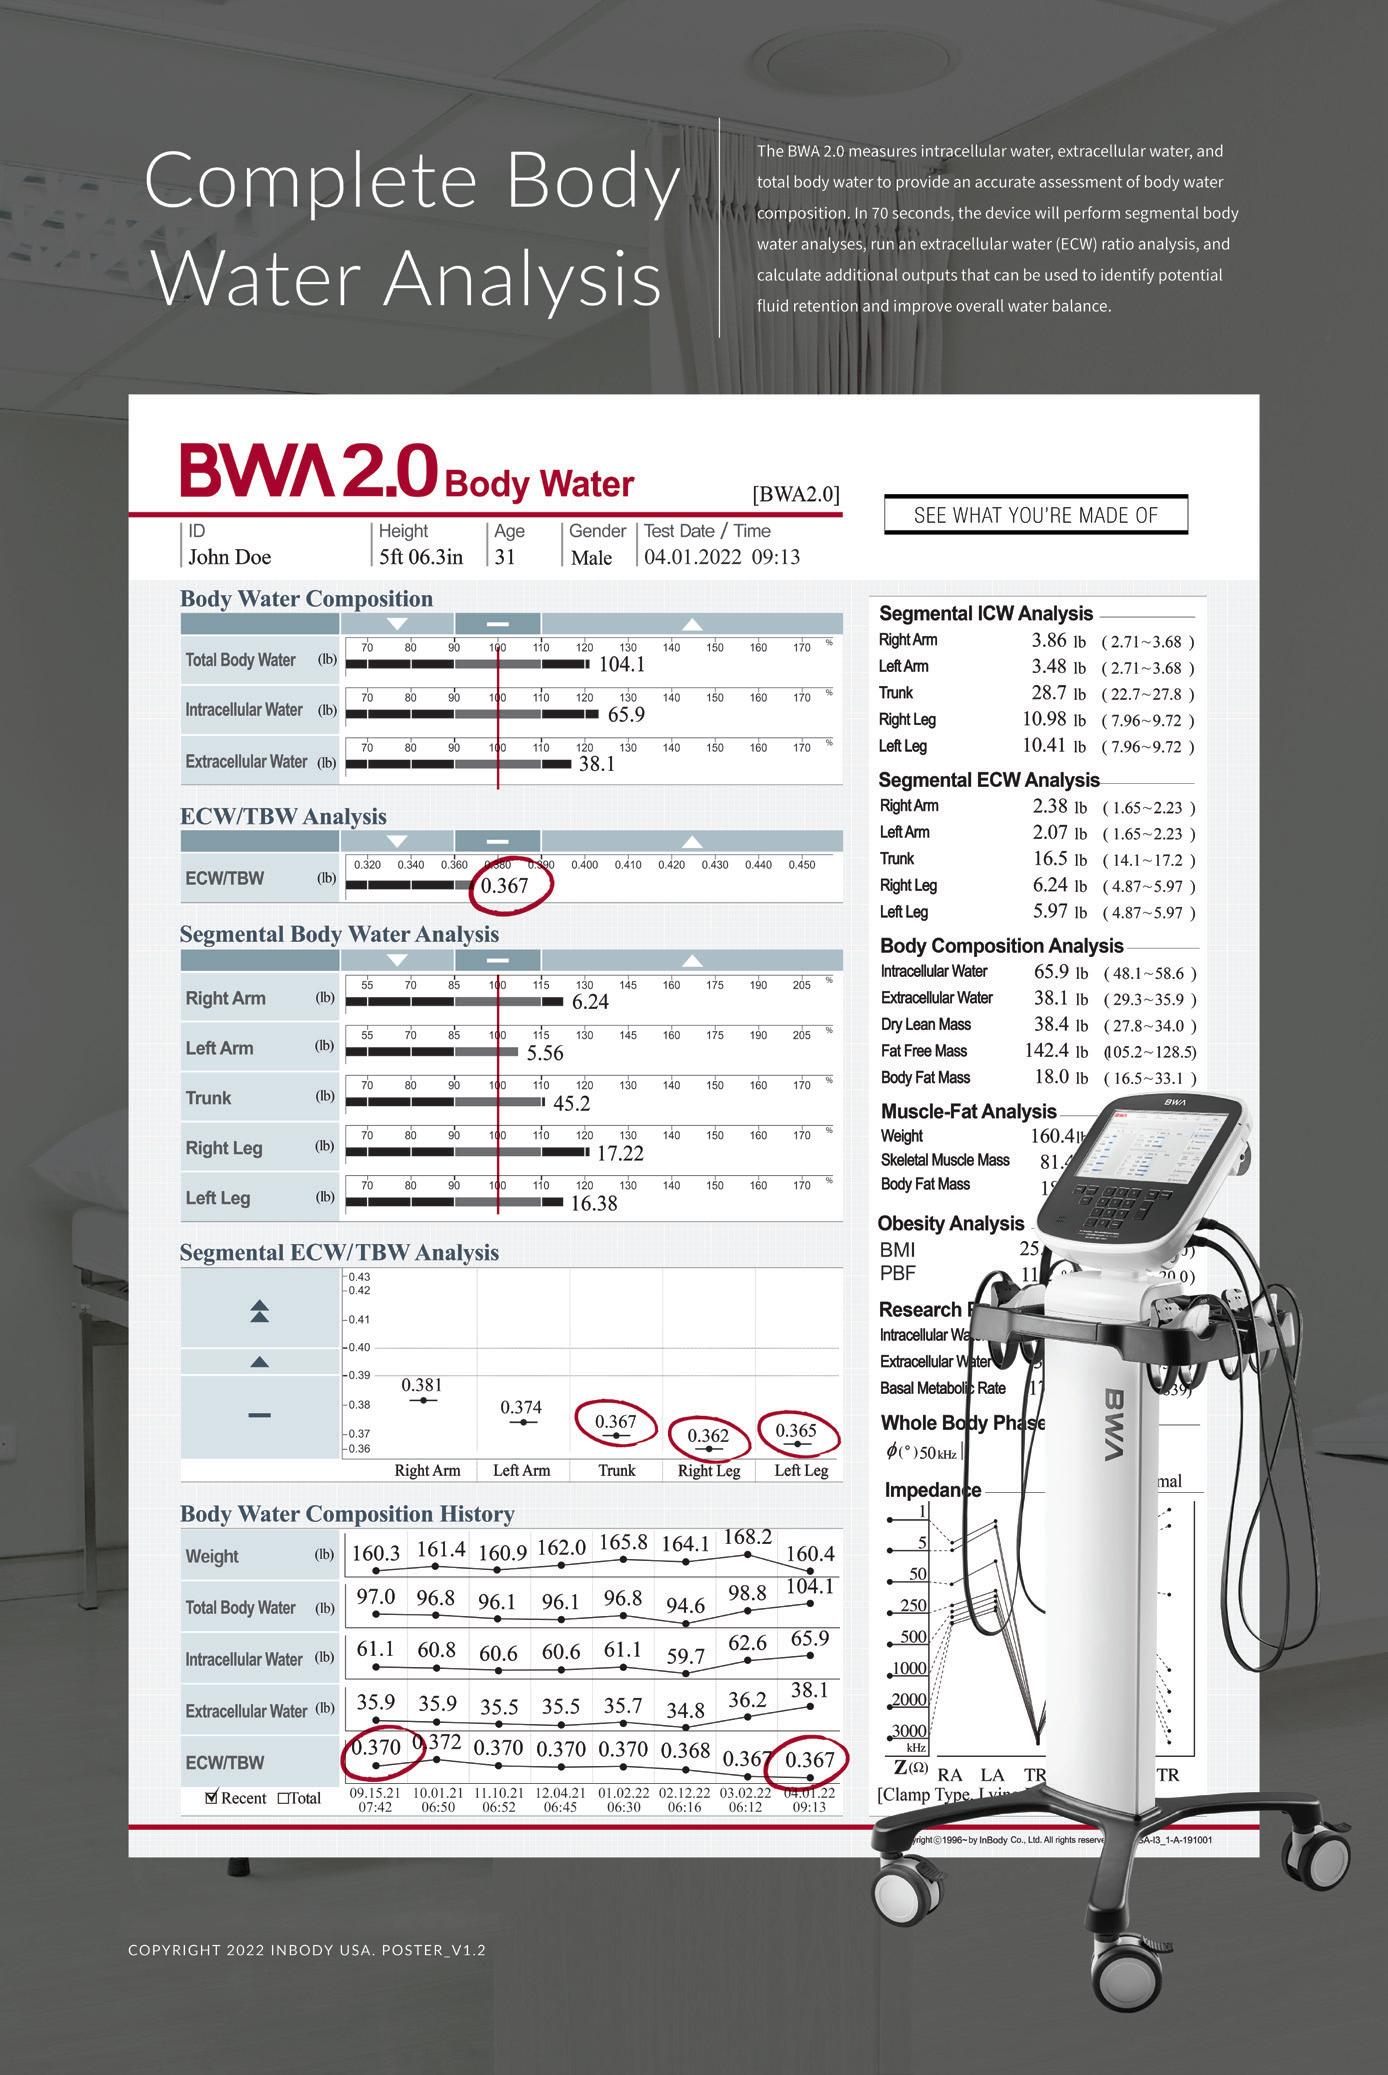

For more information or to order contact InBodyCanada Marketing Support: marketing@inbodycanada.ca InBody BWA InBody BWA 2.0 Product Poster: Body Water

marketing@inbodycanada.ca 83 BWA 2.0 | Posters InBody BWA 2.0 Product Poster: Research
For more information or to order contact InBodyCanada Marketing Support: marketing@inbodycanada.ca InBody BWA Copyright 2021 InBody USA BWA_BW_v1.1 The individual’s ID can be inputted with the keypad. The ID can be up to 14 alpha-numeric characters. PERSONAL INFORMATION 1 This section Segmental Extracellular changes in ECW/TBW SEGMENTAL 7 Skeletal Muscle bones to produce the fat in the fat, and fat surrounding/within found beneath internal organs MUSCLE-FAT 9 BMI is a calculation and commonly for BMI recommended 25.0 kg/m². compared to males and 18-28% OBESITY 10 This section distinct components. and Total Body Water and Extracellular amount of water the total amount is the sum of visceral fat, BODY COMPOSITION 8 Intracellular body’s cells. found in the plasma that Rate (BMR) body uses at RESEARCH 11 Phase Angle cellular integrity. Phase Angle The higher the WHOLE 12 Impedance of electrical the body. Based composition is also used IMPEDANCE 13 BWA Default outputs: Personal Information, Body Water Composition, ECW/TBW Analysis, Segmental Body Water Analysis, Segmental ECW/TBW Analysis, Body Water Composition History, Segmental ICW Analysis, Segmental ECW Analysis, Body Composition Analysis, Muscle-Fat Analysis, Obesity Analysis, Research Parameters, Whole Body Phase Angle, Impedance BODY WATER COMPOSITION Total Body Water is expressed in terms of weight in pounds, and is broken into Intracellular Water (ICW) and Extracellular Water (ECW). ICW is the water that is contained inside the body’s cells, and ECW is the water present outside of the cells. The healthy range is indicated by the “-” at the top of this section and is related to a healthy muscle-fat balance. A healthy balance of ICW and ECW is important for overall health and function.
ECW / TBW ANALYSIS ECW/TBW, the ratio of Extracellular Water to Total Body Water is an important indicator of whether your body water is balanced. High ECW/TBW can be indicative of inflammation, swelling, or edema while a lower ECW/TBW is typically observed in individuals with higher amounts of SMM. Understanding where your normal ECW/TBW is can help you identify deviations that may be indicative of changes in fluid balance due to hydration, lifestyle, or health status. A healthy range for extracellular water and total body water—made up of intracellular and extracellular water—is between 0.36-0.39.
SEGMENTAL BODY WATER ANALYSIS The Segmental Body Water Analysis shows how much Total Body Water (in pounds) is contained in each of the body’s five segments. 4 SEGMENTAL ECW / TBW ANALYSIS The Segmental ECW/TBW Analysis displays the ECW/TBW in each of the body’s five segments. Segmental analysis allows for identification of localized swelling, which may indicate circulatory or other health-related issues. 5 BODY WATER COMPOSITION HISTORY Track the history of body water composition changes. Take the InBody Test periodically to monitor your progress. Continuously measuring using the same ID allows the InBody to save each test for future comparison. The Body Water Composition History allows an individual to track changes in body water over the last eight test results (if selecting ‘Recent’) or a cumulative graph that shows the total progress from the first to most recent test (if selecting ‘Total’). 6 For more information: www.inbody.com (lb) (lb) (lb) (lb) (lb) (lb) (lb) (lb) (lb) Right Arm Left Arm Trunk Right Leg Left Leg 0.386 0.386 0.416 0.427 0.428 39.7 40.3 43.4 39.9 39.7 39.9 39.9 42.1 27.8 28.7 31.7 27.6 27.6 27.6 27.8 30.0 0.412 0.416 0.421 0.408 0.410 0.408 0.410 0.416 67.5 69 67.5 67.2 67.5 67.7 72.1 75.2 142.2 141.1 141.8 141.3 142.0 142.6 147.3 149.7 Total Recent 20.06.21 15:11 20.07.27 14:58 20.08.20 15:02 20.09.23 15:23 20.11.21 15:00 20.12.19 14:52 21.01.20 15:12 21.01.25 15:44 (lb) (lb) (lb) (lb) Segmental ICW Analysis Right Arm Left Arm Trunk Right Leg Left Leg 2.71 2.78 22.3 6.35 6.31 ( ( ( ( ( ) ) ) ) ) 2.87 2.87 24.0 8.42 8.42 3.88 3.88 29.5 10.27 10.27 lb lb lb lb lb Segmental ECW Analysis Right Arm Left Arm Trunk Right Leg Left Leg 2.71 2.78 22.3 6.35 6.31 ) ) ) ) ) 1.74 1.74 14.8 5.14 5.14 2.36 2.36 17.9 6.28 6.28 lb lb lb lb lb Obesity Analysis PBF 21.4 34.3 ) ) 18.5 10.0 25.0 20.0 kg/m2 Body Composition Analysis lntracellular Water Extracellular Water Dry Lean Mass Fat Free Mass Body Fat Mass 40.3 28.7 23.6 92.6 48.5 ( ( ( ( ( 50.7 30.9 29.3 111.1 17.4 61.7 37.9 35.9 135.8 34.8 lb lb lb lb lb Muscle-Fat Analysis Weight Skeletal Muscle Mass Body Fat Mass 141.1 48.1 48.5 ( ( ( ) ) ) 123.2 62.2 17.4 166.9 75.8 34.8 lb lb lb Research Parameters lntracellular Water Extracellular Water Basal Metabolic Rate 40.3 28.7 1278 ( ( ( ) ) ) 50.7 30.9 1428 61.7 37.9 1663 lb lb kcal Whole Body Phase Angle 50 3.8˚ ø(˚ Impedance RA LA TR TR RL LL 1 5 50 250 500 1000 2000 3000 (Ω) [000/000/000] Female 5ft 01.8in Jane Doe 51 2021.01.25. 15 : 44 [BWA2.0] inbody.com 69.0 40.3 28.7 0.416 4.41 4.54 37.9 11.09 11.02 1 7 11 10 9 8 12 13 2 3 4 5 6 Results
Water Analysis
Sizes: • 12”x18” • 18”x27” • 24”x36” Printed
Your Logo Included Pricing: 12”x18”: $19 18”x27”: $29 24”x36”: $39 (+shipping/HST)
2
3
Interpretation | 70-Second Body
Results Interpretation: Body Water Analysis
on 20pt PVC
Results Interpretation | 140-Second Research Analysis
marketing@inbodycanada.ca 85 BWA 2.0 | Posters separates the values expressed in the Body Water Analysis into Intracellular and Extracellular Body Water and can be used to identify where ECW/TBW are occurring. SEGMENTAL ICW & ECW ANALYSIS Muscle Mass is the amount of muscle attached to the produce movement. Body Fat Mass is the sum of all body including the subcutaneous fat, visceral surrounding/within muscles. Subcutaneous fat is beneath the skin, while visceral fat is found surrounding organs in the abdomen. MUSCLE-FAT ANALYSIS calculation of weight (kg) divided by height squared (m²) commonly used as a general health marker. The healthy range recommended by the World Health Organization is 18.5 Percent Body Fat (PBF) is the percentage of body fat body weight. A healthy range for PBF is 10-20% for 18-28% for females. OBESITY ANALYSIS breaks down the individual’s body composition into components. Fat Free Mass is the sum of Dry Lean Mass Body Water. Total Body Water is the sum of Intracellular Extracellular Water. Intracellular Water is the total water inside the body’s cells and Extracellular Water is amount of water outside the body’s cells. Body Fat Mass all the fat in the body including the subcutaneous fat, and fat surrounding/within muscles. COMPOSITION ANALYSIS water (ICW) is the amount of water found within the Extracellular water (ECW) is the amount of water body’s interstitial fluid, transcellular fluid, and blood is found outside the body’s cells. Basal Metabolic is defined as the amount of energy (in calories) that a rest. RESEARCH PARAMETERS (PhA) is known to be an indicator of integrity. The InBody provides Whole Body and Segmental Phase Angle at 50 kHz. the PhA, the healthier the body’s cells are. BODY PHASE ANGLE is the measured opposition to the flow currents that are applied throughout Based on the measured data, key body outputs can be analyzed. Impedance for many research purposes. IMPEDANCE
Research Analysis Copyright 2021 InBody USA BWA_Research_v1.1 The individual’s ID can be inputted with the keypad. The ID can be up to 14 alpha-numeric characters. PERSONAL INFORMATION 1 Whole Body Phase Angle is a measurement of overall cell health that is used to determine the general health of an individual. By examining Whole Body Phase Angle results, measured at a frequency of 50 kHz, it is possible to detect changes in patient health and pinpoint symptoms of, and risk factors for, specific chronic conditions For men, healthy values range from 5-7 degrees. For women, healthy values range from 4-6 degrees. WHOLE BODY PHASE ANGLE 14 Similar to Body Mass Index (BMI), the Fat Mass Index (FMI) is determined by dividing an individual’s mass by their height. However, BMI uses total mass in this equation whereas FMI subtracts an individual’s Fat Free Mass from their total body mass and uses this number to find a unique FMI measurement. FAT MASS INDEX 13 The TBW/FFM value shows an individual’s ratio of Total Body Water to Fat Free Mass. The average value for this measurement is 73.3%. TBW/FFM 12 Arm Circumference refers to the measurement of the distance around the outside of an individual’s arm. This measurement is taken around the widest part of the arm. ARM CIRCUMFERENCE 11 Obesity Degree refers to the percent difference between an individual’s weight and their ideal weight based on the average values for a person of the same height and gender. OBESITY DEGREE 10 The Visceral Fat Area displays how much visceral fat—excess fat stored around the body’s organs—an individual carries on their frame. The goal is to fall somewhere within the healthy range for fat balance, which lies at or below 100 cm VISCERAL FAT AREA 9 Basal Metabolic Rate—or BMR—refers to the number of calories that the body burns while in a state of rest. Though this value will vary from individual to individual, there is a direct correlation between BMR and Fat Free Mass. For instance, if an individual increases their Fat Free Mass by building more muscle, consequently they will also increase their BMR. BASAL METABOLIC RATE 8 Segmental Phase Angle evaluates the overall cell health of each of the five segments of an individual’s body separately. The chart shows which frequencies were used to measure the right arm, left arm, trunk, right leg, and left leg, along with the differences in segmental phase angle measurements that come from variations in the frequencies used. SEGMENTAL PHASE ANGLE 15 Impedance is the measured opposition to the flow of electrical currents that are applied throughout the body. Based on the measured data, key body composition outputs can be analyzed. Impedance is also used for many research purposes. IMPEDANCE 16 BWA Research outputs: Personal Information, Body Composition Summary, Body Composition Analysis, Research Parameters, Whole Body Phase Angle, Segmental Phase Angle, Impedance BODY COMPOSITION SUMMARY The Body Composition Summary provides an overview of individual outputs for each of the five body segments individually and as a whole. Outputs that are measured include Fat Free Mass (FFM), Fat Mass (FM), Intracellular Water (ICW), Extracellular Water (ECW), Total Body Water (TBW), TBW/ECW, and Weight. 2 BODY COMPOSITION ANALYSIS An expansion of the Body Composition Summary, the Body Composition Analysis chart compares an individual’s Lean Mass, Fat Mass, ICW, ECW, and ECW/TBW to the average values for a person of the same height and gender. When reviewing the information within this analysis, an individual can easily determine whether they fall under, within, or above what is considered to be their healthy range. 3 RESEARCH PARAMETERS The list of research parameters gives an individual a comprehensive overview of all body composition measurements calculated by the InBody. For the BWA 2.0, these outputs include Body Mass Index, Body Fat Percent, Skeletal Muscle Mass, Soft Lean Mass, Protein, Mineral, Bone Mineral Content, Basal Metabolic Rate, Waist Hip Ratio, Waist Circumference, Visceral Fat Area, Obesity Degree, Body Cell Mass, Arm Circumference, Arm Muscle Circumference, TBW/FFM, Fat Free Mass Index, Fat Mass Index, and Skeletal Muscle Mass Index. 4 PERCENT BODY FAT Percent Body Fat is a value that measures the percentage of fat in an individual’s body compared to the individual’s Total Body Weight. The healthy range for males is 10-20% and 18-28% for females. 5 SOFT LEAN MASS Soft Lean Mass is a combined measurement of Body Water, Protein, and non-osseous minerals, which are found outside of the bones and cannot be identified with the naked eye. 6 MINERAL The Mineral value refers to the total amount of inorganic minerals that are dissolved in bone and body fluids. They can be categorized as osseous and non-osseous minerals. 7 For more information: www.inbody.com Body Composition Analysis Body Composition Summary Research Right Arm Left Arm Trunk Right Leg Left Leg Whole Body Weight FFM FM ICW ECW TBW ECW/TBW The difference between the whole body values and sum of segmental values are from the craniocervical region. * ECW/TBW ECW Lean Mass Fat Mass ICW Whole Body Right Arm Left Arm Trunk Right Leg Left Leg ( lb) L ) L ) lb) 90 110 100 70 80 140 160 150 120 130 170 lb) L ) L ) lb) 0.398 0.360 0.390 0.380 0.320 0.340 0.420 0.440 0.430 0.400 0.410 0.450 0.360 0.390 0.380 0.320 0.340 0.420 0.440 0.430 0.400 0.410 0.450 0.384 0.360 0.390 0.380 0.320 0.340 0.420 0.440 0.430 0.400 0.410 0.450 0.385 0.414 0.360 0.390 0.380 0.320 0.340 0.420 0.440 0.430 0.400 0.410 0.450 0.360 0.390 0.380 0.320 0.340 0.420 0.440 0.430 0.400 0.410 0.450 90 110 100 70 80 140 160 150 120 130 170 Segmental Phase Angle RA LA TR RL LL 5 50 250 2.2 4.9 4.8 2.0 4.8 4.7 2.2 5.0 5.9 1.6 2.8 3.1 1.5 2.6 2.8 ø Proximal Impedance Proximal [000/000/000] Female 5ft 08.1in Jane Doe 41 2021.03.31. 15 : 44 inbody.com IR-USA-I4_1-A-191001 92.3 18.3 13.0 48.7(223.6%) lb) L ) L ) lb) 80 120 100 40 60 180 220 200 140 160 240 5.51 1.20 0.75 3.5(266.8%) lb) L ) L ) lb) 90 110 100 70 80 140 160 150 120 130 170 47.6 10.0 7.0 27.5(300.6%) lb) L ) L ) lb) 90 110 100 70 80 140 160 150 120 130 170 lb) L ) L ) lb) 80 120 100 40 60 180 220 200 140 160 240 5.75 1.25 0.78 3.3(260.1%) [BWA2.0] Whole Body Phase Angle 50 3.8 ø Proximal 5.51 lb 5.75 lb 47.6 lb 14.2 lb 14.1 lb 92.3 lb 3.5 lb 3.3 lb 27.5lb 5.7 lb 5.7 lb 48.7 lb 141.0 lb 1.20 L 1.25 L 10.0 L 2.91 L 2.91 L 18.3 L 0.75 L 0.78 L 7.0 L 2.19 L 2.18 L 13.0 L 1.95 L 2.03 L 17.0 L 5.10 L 5.09 L 31.3 L 0.384 0.385 0.414 0.429 0.428 0.415 2.19 2.91 14.2 5.7(151.5%) 0.429 0.428 2.18 2.91 14.1 5.7(151.6%) Research Parameters Body Mass Index Percent Body Fat Skeletal Muscle Mass Soft Lean Mass Protein Mineral Bone Mineral Content Basal Metabolic Rate Waist Hip Ratio Waist Circumference Visceral Fat Area Obesity Degree Body Cell Mass Arm Circumference Arm Muscle Circumference TBW/FFM Fat Free Mass Index Fat Mass Index Skeletal Muscle Mass Index 21.4 34.5 48.2 87.5 17.6 5.73 4.76 1275 1.12 39.6 145.0 97 57.7 11.9 10.7 74.8 14.0 7.4 6.0 kg/m % lb lb lb lb lb kcal in % lb in in % kg/m kg/m kg/m ( ( ( ( ( ( ( ( ( ( ( 18.5 10.0 28.2 47.5 9.9 3.43 2.82 1428 0.80 90 32.8 25.0 20.0 34.4 58.1 12.1 4.19 3.44 1663 0.90 110 40.2 ) ) ) ) ) ) ) ) ) ) ) 1 14 13 12 11 10 8 9 7 6 5 4 15 16 2 3
Results Interpretation:

For more information or to order contact InBodyCanada Marketing Support: marketing@inbodycanada.ca InBody BPBIO 750 Blood Pressure Monitor Kiosk
BPBIO 750 | Social Media Template


Free digital file template upon request.
Product images are available on request

marketing@inbodycanada.ca 87
• 33”x 80”
• Hardware included
• Single and double sided available
• Your Logo Included
What do your Results mean? All Outputs

For more information or to order contact InBodyCanada Marketing Support: marketing@inbodycanada.ca 5
Pricing:
(+shipping/HST) BPBIO 750 | Pull
Single sided: $119 Double Sided: $217
Pull Up Banners

marketing@inbodycanada.ca 89
What do your Results mean? Default Outputs
How to Test Your Blood Pressure
How To Test Your Blood Pressure
Sit up straight and adjust the height of the stool until your heart is horizontal to the circular sleeve of the device.
Remain in a relaxed, seated position for at least 5 minutes before your test.

Insert your right or left arm until the blue LED light confirms that your elbow is securely in the elbow groove.
Press the Start/Stop button to start the test.

Pressure is automatically applied to the cuff. Remain calm to get an accurate measurement. Stay in an upright, relaxed position. Do not talk or move until the test is complete.
To stop the test and immediately release pressure, press Start/Stop or Emergency button located on the front side of the device, below the Start/Stop button. If pressure is not immediately released, press the on/off switch located on the back of the device.

For more information or to order contact InBodyCanada Marketing Support: marketing@inbodycanada.ca 5
STEP 1 STEP 2 STEP 3 STEP 4 STEP 5
C AUTI ON: groove LED light
• 33”x 80” • Hardware included • Single and double sided available • Your Logo Included Pricing: Single sided: $119 Double Sided: $217 (+shipping/HST) BPBIO 750 | Pull
Pull Up Banners
Preparatory Steps

marketing@inbodycanada.ca 91
Sizes:
• 12”x18”
• 18”x27”
• 24”x36”
Printed on 20pt PVC Your Logo Included
Pricing:
12”x18”: $19
18”x27”: $29
24”x36”: $39
(+shipping/HST)
How to Test

For more information or to order contact InBodyCanada Marketing Support: marketing@inbodycanada.ca
BPBIO 750


marketing@inbodycanada.ca 93 750 | Poster

marketing@inbodycanada.ca Contact InBodyCanada Marketing: 4338 Innes Rd, Suite 75 Ottawa, ON K4A 3W3 marketing@inbodycanada.ca www.inbodycanada.ca


