INBODY 770 RESULTS SHEET MANUAL


HOW TO READ AND INTERPRET CHANGES IN RESULTS
PREPARED BYInBody Canada 2023
InBody 770 Results Sheet Manual
Contents
Table of

The water found within your cells, this is an indicator of overall hydration, and the ability of cells to process nutrients.
Intracellular water is the water inside of your cells (INTRAcellular water). This water is responsible for the health of each of the cells of your body by aiding the transport of nutrients within your cells.
-ICW is comprised of 70% cytosol (which is a mixture of water and dissolved elements like nutrients and vitamins)
-ICW comprises 2/3 of the total water in your body
Low intracellular water
Generally associated with dehydration, frailty[1], and poor strength[2].
High intracellular water:
A signal of good cell health, this generally occurs when muscle cells increase in number and size. When muscle cells become enlarged, they can uptake more extracellular water to power cell functions.
Increased intracellular water in combination with exercise is a sign of increased lean body mass.
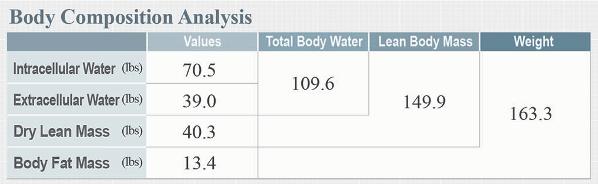
The water found outside of your cells, this may be an indicator of inflammation, kidney disease and overall muscle adequacy.
Extracellular water is the water outside of your cells (EXTRAcellular water). This water is responsible for the movement of electrolytes, oxygen delivery to cells and clearing waste from metabolic processes.
-ECW is found in your interstitial fluid, transcellular fluid, and blood plasma
-ECW comprises 1/3 of the total water in your body
Low extracellular water:
Typically observed in individuals with high skeletal muscle mass.
High extracellular water:
An indicator of health risks such as inflammation, edemas, renal kidney disease, and unhealthy fat levels.
Total Body Water
This is simply, all the water within your body.
Extracellular Water + Intracellular Water = Total Body Water
This value should be around 60-75% of a person’s total body weight.
High Total Body Water:
Usually seen in athletic body types, as the muscles in the body hold more water than fat.
If high TBW is seen within a sarcopenic individual (high-fat mass, low muscle mass), this may indicate inflammation and swelling in the body. This can be checked with the ECW: TBW analysis at the bottom of the results sheet. It is also important to track what supplements an individual is taking. Some supplements can change how the body is holding water.
Low Total Body Water:
Usually seen in unathletic individuals with high-fat mass and low muscle mass. It is essential to ensure the body has enough muscle to maintain regular movements without pain – this is discussed further in the Muscle–Fat Analysis Section.
Dry Lean Mass
This is the mass of your body, without fat and water.
Body Fat Mass
This is the mass of fat throughout the entire body, including visceral and subcutaneous fat.
Lean Body Mass
This is the mass of the body without fat.
Weight
Total mass of the body including muscles, fat, and water.
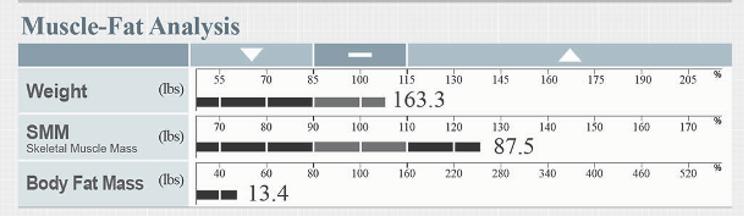
Bar Values Legend:
Below Average* Values:
Average* Values:
Above Average* Values:
Weight
Total mass of the body including muscles, fat, and water.
This is the mass of skeletal muscles throughout the body.
Skeletal muscle mass is comprised of ALL skeletal muscle in the body. This value excludes smooth and cardiac muscles, which are the muscles that make up an individual’s heart and organs.
Muscle mass is responsible for a variety of bodily functions, including metabolic processes, insulin uptake and transformation and
Higher than average muscle mass: This is usually seen in athletic body types, however, individuals who work physically demanding jobs will also usually have higher than average muscle mass.
*Average values are based upon WHO standards for skeletal muscle mass, body fat mass and weight, based upon your gender, age and height. The scale is placed to give the test receive an easy reference value. Empirical estimations are NOT made during the test, and age, gender and height are only factored into the “Average Values” NOT test values
Lower than average muscle mass:
Not indicative of any emergent medical conditions unless other criteria are met (such as high fat mass in sarcopenia and low muscle and fat mass in cachexia). Muscle mass that is insufficient at carrying the body weight (fat masses, bone mass, mineral contents etc.) may cause pains and aches at the joints as the joints start to be overworked in everyday activities such as walking, stepping up a curb or stair and sitting down/standing up. Use this value and reference the Segmental Lean Analysis Section for more information.
This is the mass of fat throughout the entire body, including visceral and subcutaneous fat.
Fat mass is responsible for insulating and protecting the organs within the body and maintaining body temperature, among other things. Body Fat Mass is important.
Lower than average body fat mass: Generally seen on a more athletic individual, but it is important to refer to other sections of the results sheet to make a thorough analysis. Extremely low body fat mass in females has been shown to seize the reproductive cycle and cause menstruation to seize, for these reasons, it is important to consult with a doctor in individuals with low body fat mass.
Higher than average body fat mass: Lower than average body fat in athletic individuals may not be an indication of any health concerns, however, it is important to look at other sections of the result sheet to determine if this is healthy for the client or patient.

This value is derived based on the height and total mass of an individual.
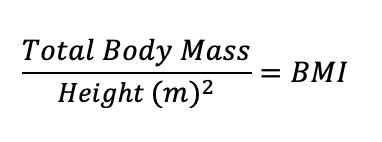
BMI may be important for certain medical calculations and procedures.
Higher than average BMI: May be indicative of an individual being overweight or obese.
It is important to refer to other sections of the results sheet, such as Muscle Fat Analysis to determine whether this value is a true representation of the health of the tested individual.
Lower than average BMI: May be indicative of sarcopenia, cachexia or other health concerns, such as eating disorders.
It is important to refer to other sections of the results sheet, such as Muscle Fat Analysis to determine whether this value is a true representation of the health of the tested individual.
This is a calculation based on the total fat mass of an individual and total weight.
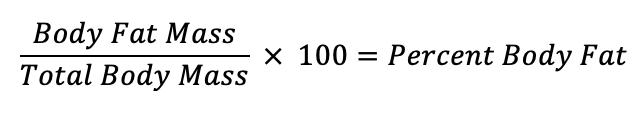
PBF is a good representation of fat-related health risks.
Higher than average PBF: May be an indicator of poor health and fat-related health risks such as cardiovascular disease, diabetes, strokes, and heart attacks.
Lower than average PBF: In athletic individuals, low PBF is generally an indicator of good health, however, PBFs that are too low may be associated with health conditions such as the loss of the menstrual cycle in females. If any individual has lower than average PBF, a medical professional should be brought in to consult whether this is a healthy choice for the individual.
This may also be an indicator of cachexia, sarcopenia, or other body-wasting disorders. It is important to consult a doctor for any person who has a lower-thanaverage PBF.
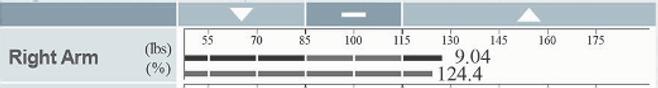
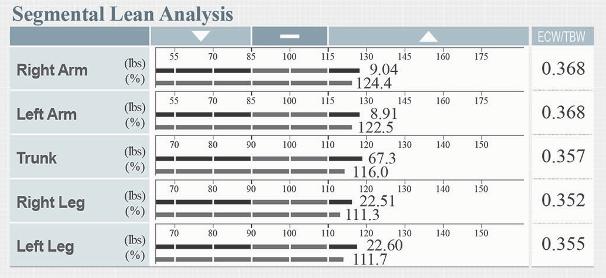
This is the pounds of skeletal muscle in each segment of the body.
Everyone is built differently, but it is important to have sufficient SMM to carry the body. It is important to keep these numbers in the “average” range as much as possible.
Insufficient SMM can lead to joint pain, poor prognosis, surgical outcomes, and lower-than-average metabolism.
**It is important to ensure that each side of the body in the arms and legs (left arm – right arm, and, left leg – right leg) are within 0.5 lbs of each other. This will ensure the individual has balanced muscle mass. Imbalances of 0.5 lbs or more may be indicative of injury, side dominance, or swelling. It is important to open a dialogue with the individual to ensure there are no underlying conditions or issues.
This is the percent sufficiency of the body being able to carry itself via the muscles.
This is based on a collection of data points from research studies conducted worldwide.
For the body to be able to do normal everyday tasks such as standing from a chair, sitting in a chair, walking up the stairs, stepping up a curb, and holding itself vertically when standing, the human body needs muscles to perform these everyday tasks. When there is insufficient muscle mass to do so, this number will be below 100, or, it can be said that the body does not have the sufficient muscle mass to carry itself.
In this case, using the example above, this individual’s right arm is 124.4% sufficient at carrying out tasks such as writing, typing, and fulfilling everyday tasks such as carrying in the groceries, opening a water bottle, etc.
When this number is below 100%, the body is not completely sufficient at carrying itself – and this may be seen in individuals with joint pain or injuries, as the body, instead of using its muscles to perform these tasks, is not putting extra strain on the joints, ligaments, and tendons. This way when an individual who does not usually go to the gym, starts going, they begin to feel fewer aches and pains while carrying out everyday functions.
Research Study:
(Rinninella E, et al, Skeletal muscle mass as a prognostic indicator of outcomes in ovarian cancer) (Moon S, et al, Low muscle mass is related to worse prognosis in idiopathic fibrosis patients):
Skeletal muscle mass is highly linked with surgical outcomes and prognosis. Having sufficient muscle mass is highly important in determining the outcomes of disease and surgical outcomes. This has been studied in ovarian cancer, abdominal aortic aneurysms, idiopathic pulmonary fibrosis, carcinomas as well as lung, gastric and esophageal cancers.
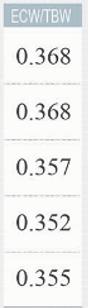
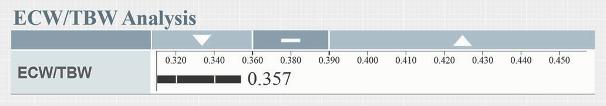
Extracellular Water: Total Body Water is an analysis of the water outside of your cells in comparison to the water inside of your cells. This is an important value on the results sheet and can give you a lot of information about an individual’s body.
Higher values of Extracellular Water: Total Body Water
Values over 0.390 are considered to be in excess. Any values in excess may be indicative of swelling, inflammation, or edema. This section can be especially useful in understanding and treating lymphedema patients.
Lower values of Extracellular Water: Total Body Water
This is generally seen in individuals who have high skeletal muscle mass (SMM), as the muscles have become efficient at carrying water intracellularly for activity or exercise.
Health Risk Cut-Off Value: < 0.360, > 0.390
Extracellular Water: Total Body Water is an analysis of the water outside of your cells in comparison to the water inside of your cells.
This is an important value on the results sheet and can give you a lot of information about an individual’s body.
Higher than average Extracellular Water: Total Body Water
Values over 0.390 are considered to be in excess. Any values in excess may be indicative of swelling, inflammation, or edema. This section can be especially useful in understanding and treating lymphedema patients.
Lower than average Extracellular Water: Total Body Water
This is generally seen in individuals who have high skeletal muscle mass (SMM), as the muscles have become efficient at carrying water intracellularly for activity or exercise.
Health Risk Cut-Off Value: < 0.360, > 0.390
Body Composition History is a quick and easy way to understand the changes occurring in an individual’s body.
This section allows, at a quick glance, to ensure that the correct trends are occurring in the body.
In this section, you can see the results for weight, skeletal muscle mass, percent body fat, and extracellular to total body water from the past 8 tests completed under a specific ID number.
Visceral fat area is the amount of adipose tissue that lies deep under the skin and underneath the abdominal muscles, it wraps around the organs in the body, especially the intestines and liver.
Visceral fat is an integral part of the human body and it provides active energy stores and protection to our vital organs.
Visceral Fat in Excess:
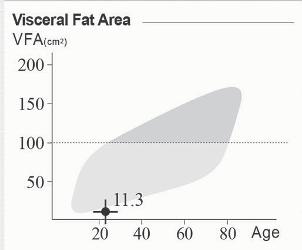
Excess visceral fat is associated with a multitude of health risks, and it is an important value to monitor in individuals. In the values above, visceral fat begins to act as a part of the endocrine system and can release harmful chemicals and hormones, this can be linked to fertility issues in both women and men. High visceral fat also increases the risk of cardiovascular disease and associated illnesses (diabetes, stroke, metabolic conditions).
Low levels of Visceral Fat:
Generally seen in individuals with higher skeletal muscle mass and may be indicative of good health.
Health Risk Cut-Off Value: > 100 cm
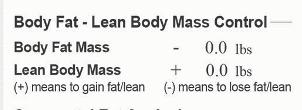
In this section, InBody recommends how many pounds of muscle or fat to lose or gain to obtain an “optimal” body type based on height, age, and gender.
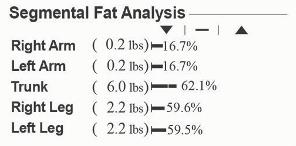
In this section, all adipose tissue in the body is included (both visceral and subcutaneous fat).
This number in pounds is shown between the segment of the body and the percentile bar, these values can be important in nutrition and dieting counseling and in surgical settings.
The bar to the right of this section is a representation of which percentile that amount of fat (in pounds) puts the individual in. Values beside the bar should be less than 100%, but this may vary from individual to individual.

Based on the John Cunningham equations, this is the number of calories an individual should consume at rest to maintain their muscle mass.
The John Cunningham equation only uses skeletal muscle mass in its calculation and is a good reminder to an individual of how many calories they should be consuming to maintain the muscle mass in their body.
This is the sum of lean mass, from the right and left leg.
This value is of exceptional importance to the aging population. It is important to establish a baseline and maintain or increase this value as aging occurs to prevent frailty.

This is the measurement of the hydration of an individual’s lean tissue, as well as the density of the individual’s muscle.
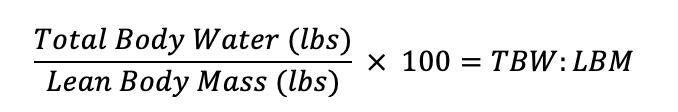
This is a great way to monitor muscle gain, as well as the hydration levels of an individual.

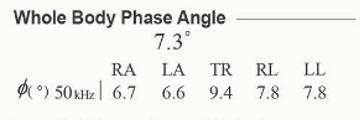
Phase angle is an indicator of cellular integrity, values measured at 50Hz.
Higher Phase Angle is indicative of greater cellular integrity.
Lower Phase Angle is indicative of poor cellular integrity.
A normal, healthy, phase angle is between 5 and 7.
Research Study (Garlini, et al, Phase Angle and Mortality, a Systemic Review):
Phase angle may be used as a prognostic marker for several health conditions. Changes in phase angle may show the presence of disease, inflammation, malnutrition, and functional disabilities. Phase angle has been used as a prognostic marker in cancers, kidney and cardiac diseases, and people with immunodeficiencies such as HIV and amyotrophic lateral sclerosis.